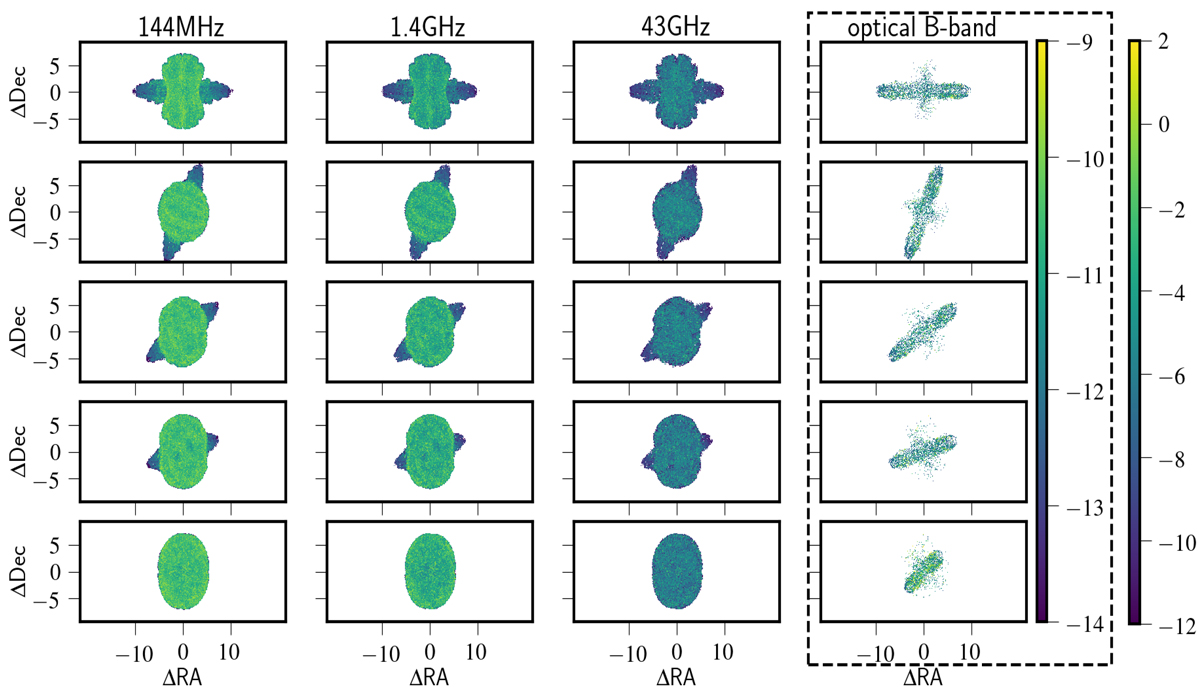
Fig. 7.
Download original image
Intensity maps (log I in Jy arcsec−2) obtained for the run 3Dmaj_ref are highlighted in this image for five line-of-sight angles; i.e. (θ = 70° ,ϕ = 0°), (θ = 20° ,ϕ = 70°), (θ = 45° ,ϕ = 45°), (θ = 70° ,ϕ = 45°), and (θ = 70° ,ϕ = 70°) for the first, second, third, fourth, and fifth rows, respectively (from top), at a time of 3.78 Myr. We used a separate colour bar for the optical image to highlight the small-scale variation in the intensity distribution. It is evident from figure that the relative extent of the active lobes and the wings depend on the viewing effect. The measure of ΔRA and ΔDec here are in arcseconds.
Current usage metrics show cumulative count of Article Views (full-text article views including HTML views, PDF and ePub downloads, according to the available data) and Abstracts Views on Vision4Press platform.
Data correspond to usage on the plateform after 2015. The current usage metrics is available 48-96 hours after online publication and is updated daily on week days.
Initial download of the metrics may take a while.