Fig. 16.
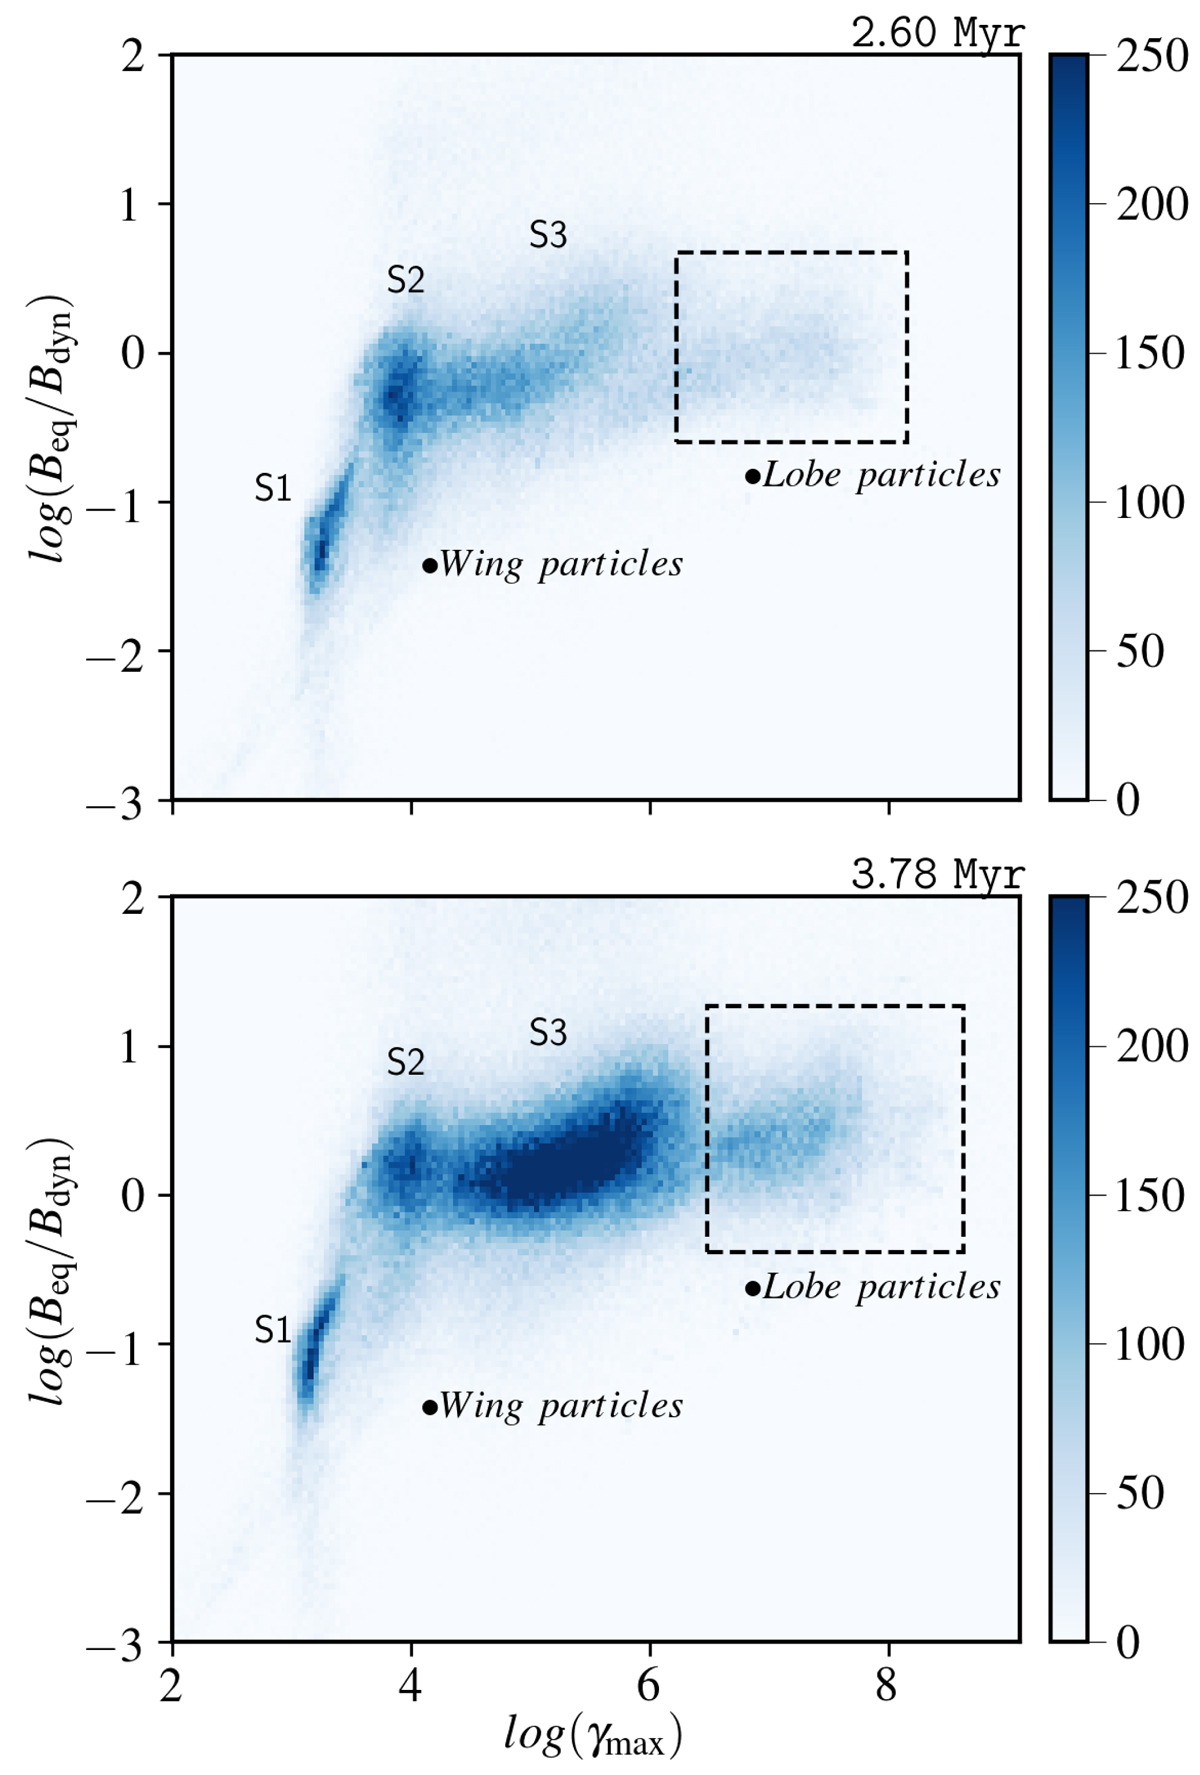
Download original image
2D PDF of Beq/Bdyn vs. γmax of the particles that are in the lobe and in the wing, obtained at a time of 2.6 Myr (top) and 3.78 Myr (bottom). The particles inside the black dashed box are associated with lobes, outside of which are the wing particles. The figure shows that most of the particles have acquired a near-equipartition stage, i.e. Beq ≈ Bdyn, while a few have also deviated from it. Stripes 1, 2, and 3 (i.e. S1, S2, S3) marked in the figure are associated with three types of particles that are found in the wings, which indicate several micro-physical processes occurring in the wing (see Sect. 5.2 for details). The corresponding colour bar represents the number of particles that are distributed in the bins where we set a visualisation limit.
Current usage metrics show cumulative count of Article Views (full-text article views including HTML views, PDF and ePub downloads, according to the available data) and Abstracts Views on Vision4Press platform.
Data correspond to usage on the plateform after 2015. The current usage metrics is available 48-96 hours after online publication and is updated daily on week days.
Initial download of the metrics may take a while.