Fig. 13.
Download original image
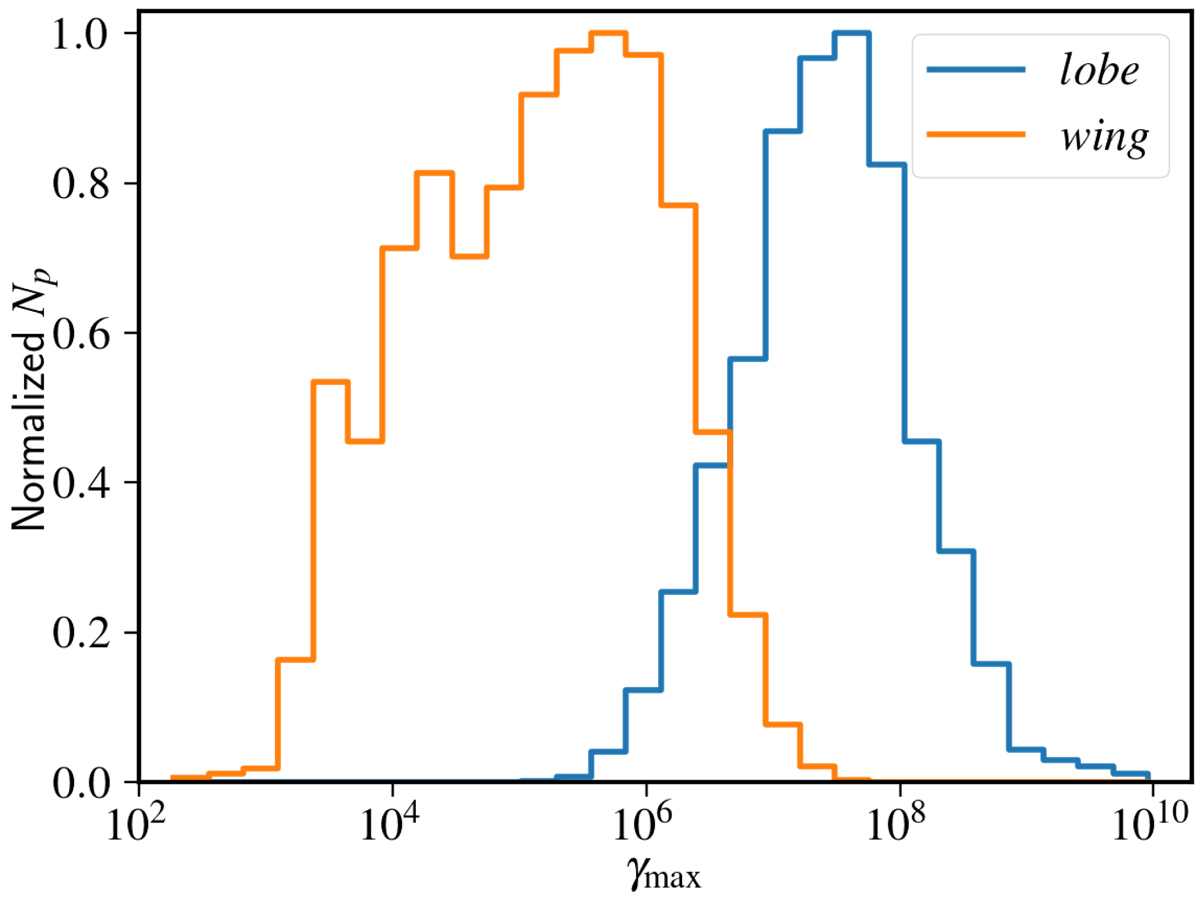
Histogram showing the maximum Lorentz factor distribution (γmax) of lobe and wing particles (considered without contamination) obtained at a time of 3.78 Myr. The vertical axis represents normalised number of particles (Np). We see a lower γmax peak for wing distribution in comparison to the lobe that peaks near 107.7. The wing distribution also shows a spread in values with a high γmax tail (extending up to ∼107.7), providing evidence of re-energisation activities in the wings due to diffusive shocks.
Current usage metrics show cumulative count of Article Views (full-text article views including HTML views, PDF and ePub downloads, according to the available data) and Abstracts Views on Vision4Press platform.
Data correspond to usage on the plateform after 2015. The current usage metrics is available 48-96 hours after online publication and is updated daily on week days.
Initial download of the metrics may take a while.