Fig. 17.
Download original image
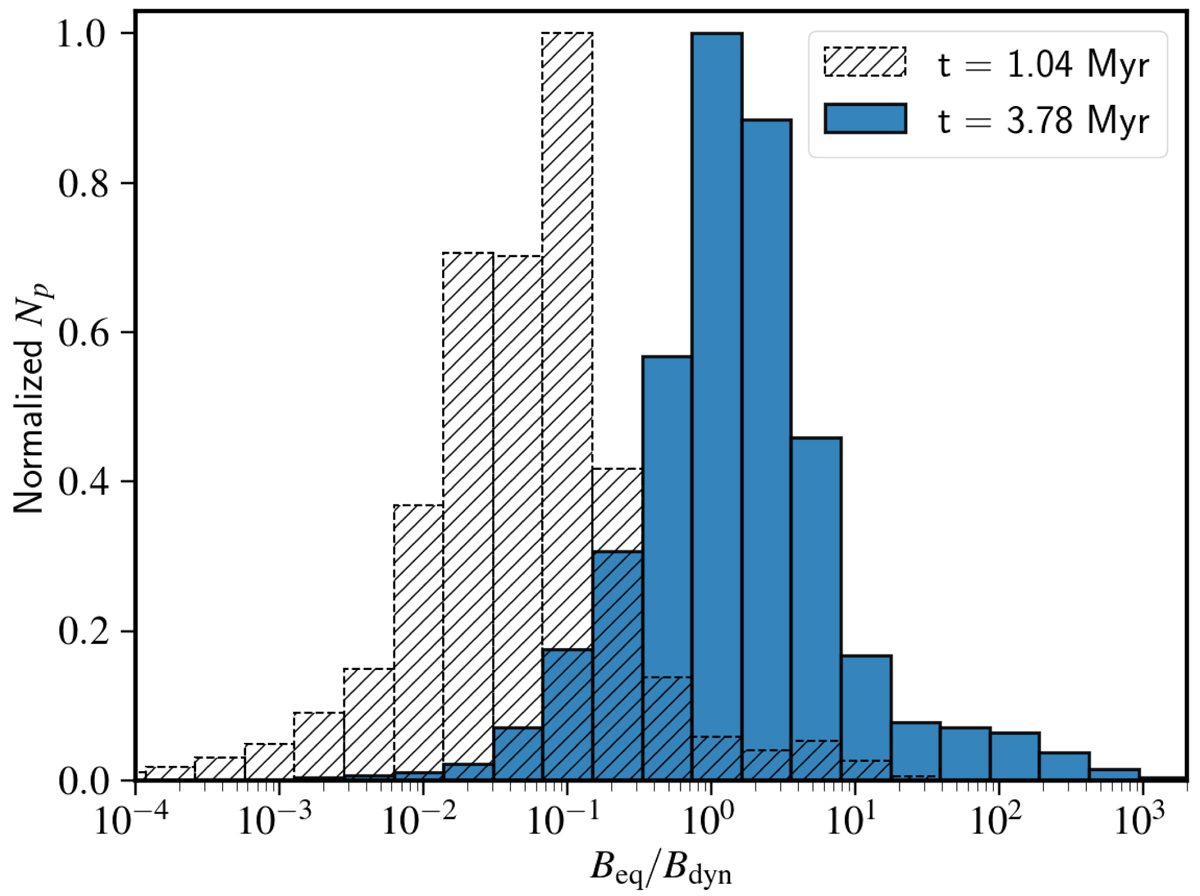
Histograms showing the distribution of Beq/Bdyn for all the particles distributed over the domain at a simulation time (t) of 1.04 Myr and 3.78 Myr. The vertical axis represents the normalised number of particles (Np). A clear shift in the peak value of the histogram can be observed here as the galaxy ages. However, at 3.78 Myr the majority of particles show that the radio structure as a whole has achieved a near equipartition stage (Beq ≈ Bdyn).
Current usage metrics show cumulative count of Article Views (full-text article views including HTML views, PDF and ePub downloads, according to the available data) and Abstracts Views on Vision4Press platform.
Data correspond to usage on the plateform after 2015. The current usage metrics is available 48-96 hours after online publication and is updated daily on week days.
Initial download of the metrics may take a while.