| Issue |
A&A
Volume 655, November 2021
|
|
|---|---|---|
| Article Number | A41 | |
| Number of page(s) | 8 | |
| Section | Astrophysical processes | |
| DOI | https://doi.org/10.1051/0004-6361/202141042 | |
| Published online | 11 November 2021 | |
Multiband nonthermal radiative model of pulsar wind nebulae: Study of the effects of advection and diffusion
1
College of Science, Yunnan Agricultural University, Kunming 650201, PR China
2
Department of Astronomy, Key Laboratory of Astroparticle Physics of Yunnan Province, Yunnan University, Kunming 650091, PR China
e-mail: This email address is being protected from spambots. You need JavaScript enabled to view it.
3
Department of Physics, Yuxi Normal University, Yuxi 653100, PR China
Received:
10
April
2021
Accepted:
23
August
2021
Abstract
Aims. Nonthermal radiation properties of pulsar wind nebulae (PWNe) are studied in the frame of a time-dependent model with particle advection and diffusion.
Methods. The dynamical and radiative evolution of a PWN was self-consistently solved in the model. The time-dependent lepton (electrons and positrons) equation is described by particle injection, advection, diffusion, adiabatic loss, and radiative loss. Nonthermal emission from a PWN is mainly produced by the relativistic leptons through synchrotron radiation and inverse Compton process.
Results. The effect of particle transport including advection and diffusion was analyzed, showing that the particle transport process induces a decrease in the nebula flux, and that the total flux decreases with the increase in advection velocity and diffusion coefficient. Meanwhile, the particle transport processes may play an important role in modifying the spectrum of the emitted radiation at X-ray and TeV wavelengths, but only have slightly effects in radio and GeV bands. We applied our model to the three PWNe Crab nebula, 3C 58, and G54.1+0.3, and observed that the spectral energy distributions of photon emissions from the three PWNe are reproduced well. Our results indicate that (i) the particle cooling processes are dominated by adiabatic loss in lower-energy bands and synchrotron loss dominates for the higher-energy particles; and (ii) the particle transport processes are advection dominated, and a slow diffusion may occur within the Crab nebula, 3C 58, and G54.1+0.3.
Key words: pulsars: general / acceleration of particles / radiation mechanisms: non-thermal
© ESO 2021
1. Introduction
Pulsar wind nebulae (PWNe) are the largest class of Galactic very high-energy gamma-ray sources (e.g., H.E.S.S. Collaboration 2018). It is generally thought that a central pulsar located inside a PWN releases its rotational energy through a pulsar wind, which collides with the ambient medium and results in the termination shock, in which the particles are accelerated to relativistic energy (e.g., Rees & Gunn 1974; Kennel & Coroniti 1984; Gaensler & Slane 2006). The accelerated particles can be injected into the PWN and then propagate away from the center of the nebula. Observations have shown that PWNe can emit nonthermal photons from radio to TeV bands, which can be attributed to synchrotron radiation and inverse Compton scattering of the relativistic particles (electrons and positrons).
To explain the observed multiband emission from the PWNe, some dynamical and radiative spectral evolution models have been constructed in the framework of a one-dimensional spatially independent model (e.g., Zhang et al. 2008; de Jager et al. 2008; Tanaka & Takahara 2010; Bucciantini et al. 2011; Martin et al. 2012; Vorster et al. 2013; Torres et al. 2014; Zhu et al. 2015). In these models, the evolution of the particle is described by solving the time-energy dependent Fokker-Planck equation under different approximations and assumptions. For example, the particles escape quickly from the nebula through Bohm diffusion, and then the adiabatic and inverse Compton scattering losses can be neglected (Zhang et al. 2008). The effect of the radiative and adiabatic losses are analyzed, but the escape of the particles is neglected (Tanaka & Takahara 2010). Finally, particle adiabatic loss, synchrotron loss, inverse Compton scattering loss, and escape process are systematically considered, but the particle escape process is assumed to be Bohm diffusion (e.g., Martin et al. 2012; Torres et al. 2014; Zhu et al. 2015).
It is generally acknowledged that particles injected by the shock will propagate away from the center of the nebula by advection and diffusion processes (e.g., Vorster & Moraal 2013). Advection and diffusion processes are therefore important for studying the nonthermal radiative properties of PWNe. The irregular interaction of particles in the magnetic field will result in diffusion, and it may be argued that the diffusion coefficient κ(t) ∝ 1/BPWN(t) in the PWNe (e.g., Lerche & Schlickeiser 1981). If the diffusion coefficient is chosen to be linearly proportional to the energy, then the functional form of diffusion is similar to Bohm diffusion (e.g., Vorster et al. 2013; Ren et al. 2019). However, the diffusion coefficient may not necessarily scale linearly with energy (e.g., Abeysekara et al. 2017; Tang & Piran 2019).
The importance of the particle advection process inside the PWNe has been described in some previous studies (e.g., Van Etten & Romani 2011; Tang & Chevalier 2012; Porth et al. 2016; Ishizaki et al. 2017, 2018). However, the particle advection form is still highly debated for PWNe. It is also still controversial whether the particle propagation process is dominated by advection or diffusion. Recent studies have shown that the transport of particles may be either advection dominated (e.g., H.E.S.S. Collaboration 2019; Lu et al. 2020) or diffusion dominated in PWNe (e.g., Abeysekara et al. 2017; Liu & Yan 2020).
Motivated by the works mentioned above, a time-dependent model for studying the nonthermal radiative properties of PWNe is presented in this paper. In particular, the effects of both particle advection and diffusion are analyzed in detail. The paper is organized as follows. In Sect. 2 we briefly describe the model. In Sect. 3 we apply the model to the Crab nebula, 3C 58, and G54.1+0.3, and provide their nonthermal radiative properties. Finally, our conclusions and discussions are presented in Sect. 4.
2. Model description
We briefly present the one-dimensional time-dependent model. The PWN is assumed to be spherically symmetric, where advection, diffusion, adiabatic losses, synchrotron emission losses, and inverse Compton scattering losses of the relativistic electrons are included. The evolution of the electron distribution N(E, t) in the emission region can therefore be described by the following equation:
![Mathematical equation: $$ \begin{aligned} \frac{\partial N(E,t)}{\partial t}= \frac{\partial }{\partial E} \left[ \dot{E} N(E,t) \right] + \frac{N(E,t)}{\tau _{\rm con}(E,t)} + \frac{N(E,t)}{\tau _{\rm diff}(E,t)} + Q(E,t), \end{aligned} $$](/articles/aa/full_html/2021/11/aa41042-21/aa41042-21-eq1.gif) (1)
(1)
where an isotropic distribution of the electrons in the PWN is assumed, and Ė is the energy-loss rate of the particles with energy E, including the adiabatic losses Ėad, synchrotron radiation losses Ėsyn, and inverse Compton scattering losses ĖIC.
The particle transport processes within PWNe mainly include advection and diffusion. As mentioned in Sect. 1, the particle advection form is ambiguous. According to the MHD simulations of Kennel & Coroniti (1984), the advection velocity V(r) decreases with the increase in radial distance, and the radial profile of the velocity can be approximated as V(r)∝1/rα, with α the radial profile parameter (Van Etten & Romani 2011). We chose the radial profile to be V(r)∝1/r. The approximation that keeps the magnetic field in the nebula is constant with radius according to the ideal MHD limit, that is, VBr = constant. In addition, the advection velocity is assumed to be equal to the expansion velocity VPWN of the nebula in the outer boundary. Then, the advection velocity can be approximated as
![Mathematical equation: $$ \begin{aligned} V(r) = V_{\rm PWN}(t)\left[\frac{R_{\rm PWN}(t)}{r}\right], \end{aligned} $$](/articles/aa/full_html/2021/11/aa41042-21/aa41042-21-eq2.gif) (2)
(2)
and the advection timescale of particles τcon is described as (e.g., Vorster & Moraal 2013)
 (3)
(3)
Integrating Eq. (3) from Rts to Rpwn, the τcon is given by
 (4)
(4)
where Rts is the radius of termination shock. At the same time, the functional form of diffusion is assumed to vary with energy by a power-law form, and the diffusion can be modeled as κ(t)∝1/BPWN(t) (e.g., Lerche & Schlickeiser 1981). Thus, the diffusion coefficient is assumed to be
![Mathematical equation: $$ \begin{aligned} \kappa (t) = \frac{\kappa (t_{\rm ini})B_{\rm pwn}(t_{\rm ini})}{B_{\rm pwn}(t)}\left[\frac{E_{e}}{1~\mathrm {TeV}} \right]^{\delta }, \end{aligned} $$](/articles/aa/full_html/2021/11/aa41042-21/aa41042-21-eq5.gif) (5)
(5)
where κ(tini) and Bpwn(tini) are the initial diffusion coefficient and initial magnetic field strength, respectively, and tini is the initial time. The diffusion coefficient increases with energy, that is, ∝Eδ. Here, δ depends on the property of turbulence in ambient medium, and the different values of δ represent different diffusion forms (e.g., Strong et al. 2007). Following Abeysekara et al. (2017) and Tang & Piran (2019), we assumed that the turbulence of PWNe is a classical Kolmogorov turbulence, and so the value of δ was chosen to be 1/3 (e.g., Kolmogorov 1941). According to Parker (1965), the diffusion timescale of particles τdiff is described by
 (6)
(6)
where Rpwn(t) is the radius of the PWN.
The last term on the right-hand side in Eq. (1) is the source term Q(E, t). It represents the electron injection rate, which is assumed to be of a broken power law form,
 (7)
(7)
where Q0(t) is a time-dependent normalization coefficient, Eb is the break energy, α1 and α2 are the low- and high-energy spectral indices, respectively, and Emax is the maximum energy of the injected electrons.
For a given pulsar with a period P, a period derivative Ṗ, and a braking index n, the evolution of the spin-down luminosity is given by (e.g., Gaensler & Slane 2006)
 (8)
(8)
where L0 and τ0 are the initial luminosity and initial spin-down of the pulsar. For a pure dipole radiative pulsar, L(t) can be estimated by
 (9)
(9)
where I is the pulsar moment of inertia. The initial spin-down timescale of the pulsar, τ0, is given by
 (10)
(10)
where τc is the characteristic age of the pulsar,
 (11)
(11)
and Tage is the age of the PWN. If Tage and I are given, the L0 and τ0 can be obtained.
In general, the spin-down luminosity is assumed to be distributed between particles of energy (Ėe(t) = ηeL(t)) and the magnetic field energy (ĖB = ηBL(t)) (e.g., Gelfand et al. 2009). Then, the time-dependent normalization coefficient Q0(t) can be estimated by
 (12)
(12)
Similar to Torres et al. (2014) and Zhu et al. (2018), the maximum energy of accelerated particles is given by
 (13)
(13)
where ϵ is the ratio of Larmor radius to the PWN radius. In order to confine the accelerated particles within the PWN, it is necessary for the radius of the PWN to be larger than the Larmor radius, thus ϵ < 1.0 (e.g., Venter & de Jager 2006).
According to the conservation of magnetic energy, the average magnetic field in the nebula BPWN(t) is calculated with (e.g., Gelfand et al. 2009; Zhu et al. 2018)
 (14)
(14)
Similar to Gelfand et al. (2009), Fang & Zhang (2010) and Zhu et al. (2018), the dynamical and radiative properties can be self-consistently studied for each given PWN in our model. As mentioned in Gelfand et al. (2009), the large-scale evolution of a composite SNR depends on the mechanical energy of the explosion Esn, the density of the ambient medium ρISM, the mass of the supernova ejecta Mej, and the spin-down power of the pulsar L(t). The time evolutions of the SNR radius Rsnr(t), the reverse shock radius Rrs(t), the PWN radius RPWN(t), and the termination shock radius Rts(t) of the PWN can be calculated. The calculation process here is the same as in Gelfand et al. (2009) (for details, see their Sect. 2.2 or Appendix A of Zhu et al. 2018). To calculate the spectral energy distribution (SED) of nonthermal photons, the particle spectra at the current time are obtained by solving the transport equation of particles (Eq. (1)), and then the SEDs of nonthermal photons are calculated through synchrotron radiation and inverse Compton (IC) scattering of relativistic electrons inside the PWN.
To study the effects of advection and diffusion on the SEDs of the PWN, we used the model parameters of the benchmark as follows: the pulsar and ejecta parameters are the same as those of the Crab nebula except for the PWN age (the values are listed in Table 1), and the adopted parameters are α1 = 1.5, α2 = 2.5, Eb = 3.0 × 10⁵ MeV, ηB = 0.03, ϵ = 0.3, and κ0 = κ(tini) = 1.0 × 1021 cm2 s−1. Moreover, the four soft photon fields are involved in the inverse Compton scattering: the cosmic microwave background (CMB), the galactic far-infrared (FIR) background, the near-infrared (NIR), and synchrotron radiation photon fields (SSC). The energy density and temperature are the CMB with TCMB = 2.73 K and UCMB = 0.25 eV cm−3, the IR with TIR = 70 K and UIR = 0.5 eV cm−3, and the NIR with TIR = 5000 K and UNIR = 1.0 eV cm−3, respectively.
Related parameters for the three PWNe.
At first, the effects of advection and diffusion on the SEDs at different evolution times of the PWN were considered. To do this, the SEDs for different times of the benchmark were calculated and are shown in Fig. 1 with solid lines. We then calculated the model results with pure diffusion of κt and with pure advection of V(r). They are shown in the left and right panel of Fig. 1, respectively. The three model results are different. More importantly, the advection effect is almost the same as the diffusion effect on the SED of the PWN. In other words, advection and diffusion processes both need to be taken into account.
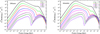 |
Fig. 1. Evolution of the SEDs of nonthermal photons for the PWN. The model parameters are as follows: the pulsar and ejecta parameters are the same as those of the Crab nebula, except for the PWN age (the values are listed in Table 1), and the adopted parameters are α1 = 1.5, α2 = 2.5, Eb = 3.0 × 10⁵ MeV, ηB = 0.03, ϵ = 0.3, κ(tini) = 1.0 × 1021 cm2 s−1, and δ = 1/3. The solid lines represent the benchmark case. Left panel: dashed lines represent pure diffusion scenarios. Right panel: dashed lines represent pure advection scenarios. |
Second, the effects of different advection velocities and different diffusion coefficients on the SEDs were investigated. The model results are shown in the left (different advection velocity) and right (different diffusion coefficients) panels of Fig. 2, where the age of the PWN is assumed to be tage = 1000 yr. Fast advection and diffusion lead to a reduction in synchrotron and IC flux. Fast advection and diffusion indicate that the particles escape more quickly from the nebula. To ensure that the advection velocities were lower than the speed of light in the whole process, the range of the advection velocity was limited to 0.1V(r)≤V ≤ 10V(r). In addition, the spectral indices obviously varied with the advection velocity and diffusion coefficient in X-ray and TeV bands, but only change slightly in radio and GeV bands (see Fig. 2).
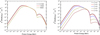 |
Fig. 2. Spectral energy distributions of the PWN for the different advection velocities with κ(tini) = 1.0 × 1021 cm2 s−1 and δ = 1/3 (left panel), and the different diffusion coefficients with advection velocity V(r) (right panel). The PWN age is assumed to be 1000 yr, and other model parameters are the same as those in Fig. 1. |
Finally, the SEDs of the benchmark were calculated for different power-law indices of the diffusion coefficient, and the results are shown in the Fig. 3. The results show that the SEDs of PWNe depend on the index δ, and all the flux decreases with increasing δ.
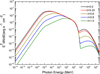 |
Fig. 3. Spectral energy distributions of the PWN for different power-law indices of the diffusion coefficients. The PWN age is assumed to be 1000 yr, and other model parameters are the same as in Fig. 1. |
3. Applications
3.1. Crab nebula
As we know, the Crab nebula is a famous PWN that has been widely studied. The center pulsar is the Crab pulsar, which has rotation period of P = 33.4 ms, a 4.21 × 10⁻¹³ s s−1 period derivative, and a braking index n = 2.509 (e.g., Taylor et al. 1993; Lyne et al. 1993). Observationally, the Crab nebula has been detected in the radio band (e.g., Baldwin 1971; Macias-Perez et al. 2010), IR band (e.g., Ney & Stein 1968; Grasdalen 1979; Temim et al. 2006), optical band (Veron-Cetty & Woltjer 1993), X-ray and soft-γ ray bands (e.g., Hennessy et al. 1992; Kuiper et al. 2001), and gamma-ray band (e.g., Aharonian et al. 2004, 2006; Albert et al. 2008; Abdo et al. 2010; Abeysekara et al. 2019; Amenomori et al. 2019). The whole system lies at a distance of 2.0 kpc.
Because the progenitor SN of the Crab nebula is SN1054, the age of the Crab nebula is Tage = 970 yr. In addition, the initial spin-down luminosity L0 = 6.7 × 1039 erg s−1 and the initial spin-down timescale τ0 = 700 yr were used. By solving the transport equation of particles (Eq. (1)), the particle spectra at the current time were calculated. The corresponding SEDs of nonthermal photons produced by the synchrotron radiation and inverse Compton process of relativistic leptons were then calculated and compared with the observed data. In the calculations, the four soft photon fields involved in the inverse Compton scattering are the same as those used in the previous section. The other model parameters are listed in Table 1.
The model results are shown in Fig. 4. From the results we calculated, the current radius of the Crab nebula is obtained to be R ≈ 1.8 pc. The current magnetic field strength of the Crab nebula is B = 110 μG, the electron maximum energy is Emax = 5.7 PeV, and the diffusion coefficient is 8.5 × 1024 cm2 s−1 at an electron energy of 1 TeV. Furthermore, to illustrate the contribution of electrons in the different energy bands to the radiation from the overall nebula, following H.E.S.S. Collaboration (2020) or Lu et al. (2020), the synchrotron and inverse Compton scattering for electrons in the energy bands of 0.0001–0.1 TeV, 0.1–2.0 TeV, and 2.0–6000.0 TeV were calculated. As shown in Fig. 4, the lower-energy (0.0001–0.1 TeV) electrons radiate the radio photons by synchrotron radiation, medium-energy (0.1–2.0 TeV) electrons radiate the infrared and ultraviolet photons, and GeV-band γ-ray photons radiate through synchrotron and inverse Compton scattering, respectively. Higher-energy (2.0–6000.0 TeV) electrons emit the X-ray band photons and TeV-band γ-ray photons through synchrotron and inverse Compton scattering, respectively.
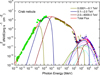 |
Fig. 4. Comparison of the calculated SED with the observed data for the Crab nebula. The calculated SEDs of synchrotron emission (dashed black line), inverse Compton scattering with synchrotron photons (dashed magenta line), IR (dashed blue line), the CMB (dashed green line), starlight (dashed cyan line), and the total emission (solid red line) are shown. The observed data are described in the text. To illustrate the contributions of electrons of different energy to the radiation, the solid dark yellow, navy, and red lines represent the contribution of the electrons in the different energy bands. The model parameters are listed in Table 1. |
To research the effects of the various physical processes, the different cooling timescales and different propagation timescales were calculated. Figure 5 shows the cooling times for the synchrotron radiation (τsyn), the inverse Compton scattering (τIC), the adiabatic loss (τabd), the diffusion time (τdiff), and the advection time (τadv), where τeff represents the total timescales. For particle cooling processes, when τsyn/τabd ≫ 1, the particle cooling is dominated by adiabatic loss, whereas it is dominated by synchrotron loss for τsyn/τabd ≪ 1. For particle propagation processes, when τdiff/τadv ≫ 1, the particle transport is advection dominated, while it is dominated by diffusion when τdiff/τadv ≪ 1. Our results reveal that the particle cooling processes are dominated by adiabatic loss in the lower-energy bands, and synchrotron loss dominates for the higher-energy particles. In addition, the particle transport processes is advection dominated within the Crab nebula.
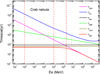 |
Fig. 5. Different cooling and propagation timescales at the current time. The solid back, magenta, blue, green, dark yellow and red lines represent the adiabatic loss timescale, the synchrotron cooling timescale, the inverse Compton cooling timescale, the diffusion timescale, the advection timescale, and the total timescale, respectively. The related parameters are listed in Table 1. |
3.2. 3C 58
The source 3C 58 is a Crab-like PWN that is also known as SNR G130.7+3.1 or SN 1181. The center pulsar is PSR J0205 + 6449 with a rotation period of 65.7 ms, a period derivative of 1.93×10⁻¹³ s s−1, and and an unknown braking index, which is assumed to be n = 3 (e.g., Camilo et al. 2002a). Thus, the pulsar has a characteristic age of ∼5397 yr. According to Kothes (2013), 3C 58 is located at a distance of 2.0 kpc. Observationally, 3C 58 has been detected in the radio band (e.g., Green 1986; Morsi & Reich 1987; Salter et al. 1989; Planck Collaboration XXXI 2016), the infrared band (e.g., Green 1994; Slane et al. 2008), the X-ray band (e.g., Torii et al. 2000; An 2019), and the γ-ray band (e.g., Abdo et al. 2013; Ackermann et al. 2013; Aleksić et al. 2014; Li et al. 2018).
Following Zhu et al. (2018), Tage = 2400 yr was assumed here. With the age, the initial spin-down timescale τ0 = 2997 yr and the initial spin-down luminosity L0 = 1.3 × 1038 erg s−1 were applied. The related results of multiband nonthermal emission from 3C 58 are shown in Fig. 6, and the parameters we used are listed in Table 1. In the calculation process, following Lu et al. (2020), the target photon energy density and temperature are the IR with UIR = 0.6 eV cm−3 and TIR = 25 K, and the NIR with UNIR = 3.2 eV cm−3 and TIR = 2800 K.
With the parameters in Table 1, the observed SED of 3C 58 can be well reproduced. The result is shown in Fig. 6. The observed radio photons can be explained by the synchrotron radiation of the lower-energy (0.0001–0.1 TeV) electrons, the infrared, ultraviolet, and GeV-band photons are mainly produced by synchrotron radiation and inverse Compton scattering of medium-energy electrons (0.1–4.0 TeV), and X-band and TeV γ-ray photons are mainly produced by synchrotron radiation and inverse Compton scattering of high-energy electrons (4.0–2000 TeV). We can also obtain that the current magnetic field strength is B = 32 μG, which is consistent with Torres et al. (2013), the radius is R ≈ 2.86 pc, and the maximum electron energy ∼2.0 PeV.
As shown in Fig. 7, we investigated the particle propagation and cooling properties of 3C 58. With κ(tini) = 1.5 × 1021 cm2 s−1, the current diffusion coefficient 2.5 × 1025 cm2 s−1 at an electron energy of 1 TeV is derived, which is roughly consistent with Lu et al. (2020). By comparison, the particle transport processes within 3C 58 are advection dominated. We conclude that the particle cooling processes are dominated by adiabatic loss in the lower-energy bands, and synchrotron loss dominates for the higher-energy particles.
3.3. G54.1+0.3
The source G54.1+0.3 is also a Crab-like PWN, which was first discovered by Reich et al. (1985). It is powered by the energetic pulsar PSR J1930+1852, which has a rotational period 136 ms and a period derivative of 7.51×10⁻¹³ s s−1 (e.g., Camilo et al. 2002b). Moreover, the braking index is unknown and is generally assumed to be n = 3. Therefore the pulsar has a characteristic age of 2872 yr. According to Leahy et al. (2008), PWN G54.1+0.3 lies at a distance of  kpc. Following H.E.S.S. Collaboration (2018), the distance of 7.0 kpc was used here. G54.1+0.3 has been observed in the radio band (e.g., Green 1985; Velusamy & Becker 1988; Hurley-Walker et al. 2009; Lang et al. 2010), X-ray band (e.g., Lu et al. 2001, 2002; Temim et al. 2010), and γ-ray band (e.g., Acciari et al. 2010; Abeysekara et al. 2018).
The age of G54.1+0.3 is unknown. It is constrained to be between 2100 and 3600 yr (e.g., Chevalier 2005; Gelfand et al. 2015). Following Zhu et al. (2018), Tage = 2600 yr was used here. These parameter values for the model used to reproduce the observed data of G54.1+0.3 are listed in Table 1, and the related results are shown in Fig. 8. An energy density of 1.1 eV cm−3 and a temperature of 3000 K for the optical soft photons were used in the calculation, which are consistent with the value from the GALPROP code (e.g., Porter et al. 2006). For the infrared component, a density of 4.0 eV cm−3 and a temperature of 25 K are needed to reproduce the observation in γ-rays, therefore we employed the values in the calculation.
From the results we calculated, the observed radio photons can be produced by synchrotron radiation of the lower-energy (0.0001–0.1 TeV) electrons, the infrared, ultraviolet, and GeV band photons are mainly produced by synchrotron radiation and inverse Compton scattering of medium energy electrons (0.1–3.0 TeV), and the X-band and TeV γ-ray photons are mainly produced by synchrotron radiation and inverse Compton scattering of high-energy electrons (3.0–800 TeV). The maximum energy of the electrons is ∼0.8 PeV, the current magnetic field strength is ∼16 μG, the current diffusion coefficient is ∼1.3 × 1025 cm2 s−1, and the radius is ∼2.4 pc.
Figure 9 shows that the particle propagation process is advection dominated within the nebula. The effects of the cooling mechanisms are dominated by synchrotron loss in the high-energy bands, while adiabatic loss dominates in the low-energy bands.
4. Conclusion and discussions
As mentioned in Sect. 1, particle propagation processes within PWNe are still debated. Currently, there are at least two possible views. The first view is an advection-dominated transport of particles (e.g., H.E.S.S. Collaboration 2019; Lu et al. 2020). The second view is the diffusion-dominated transport of particles (e.g., Abeysekara et al. 2017; Liu & Yan 2020). We have presented a time-dependent model to investigate the multiband emission properties of PWNe. In this model, the particle advection, diffusion, adiabatic loss, and radiative loss processes were included in the Fokker-Planck equation. We assumed that the particle diffusion form is not Bohm diffusion, and the diffusion form is shown in Eq. (5), that is, κ(t) = κ(tini)Bpwn(tini)(Ee/1 TeV)δ/Bpwn(t). Compared with the Bohm diffusion, for instance, κBorm = cEe/(3qBpwn), more freedom parameters were added to the model. The particle diffusion process in general depends on the property of turbulence in the ambient medium, and the different values of δ represent different diffusion forms (e.g., Strong et al. 2007). The relativistic turbulence is very intricate in pulsar wind neulae. Therefore the model may be used to study different particle diffusion properties resulting from intricate turbulence. In addition, the model enables us also to distinguish the particle-dominated mechanisms in transport and cooling processes.
The effects of diffusion and advection on the spectral evolution of PWN were analyzed in the frame of the model, and the related results are shown in Fig. 1. The figure indicates that advection and diffusion processes have similar effects on the spectral energy distribution. Our results also show that the multiband SED decreases with increasing advection velocity and diffusion coefficient (see Fig. 2). In particular, we found that the particle transport (advection and diffusion) process may play an important role in modifying the spectrum of the emitted radiation at X-ray and TeV wavelengths. The main reasons are that the transport effect of particles gradually increases with increasing energy, and X-band and TeV γ-ray photons are mainly produced by synchrotron radiation and inverse Compton scattering of these high-energy electrons. In Fig. 3, the SEDs are analyzed for different power-law indices of the diffusion coefficient, and the nebula flux decreases with the increase in δ. As shown in Eq. (5), the diffusion coefficient increases with energy, that is, ∝Eδ. The different values of δ represent different diffusion forms (e.g., Strong et al. 2007), for example, δ = 1/3 represents a typical Kolmogorov turbulence diffusion, δ = 1/2 represents a typical Kraichnan turbulence diffusion, and δ = 1 represents a Bohm-like diffusion. We assumed that the turbulence of PWNe is a classical Kolmogorov turbulence, and so the value of δ was chosen to be 1/3 (e.g., Abeysekara et al. 2017; Tang & Piran 2019).
With the model, the multiband SEDs of nonthermal radiation photons of the Crab nebula and two Crab-like pulsar wind nebula (3C 58 and G54.1+0.3) were reproduced. As shown in Figs. 4, 6 and 8, the low-energy radio emissions from three PWNe are mainly produced by synchrotron radiation of low-energy electrons, the infrared, ultraviolet, and GeV-band photons are mainly produced by synchrotron radiation and inverse Compton scattering of medium-energy electrons, and X-band and TeV γ-ray photons are mainly produced by synchrotron radiation and inverse Compton scattering of high-energy electrons. For the particle cooling processes, the cooling mechanisms are dominated by synchrotron loss in the high-energy band, while adiabatic loss dominates in the low-energy band for the three PWNe.
As shown in Figs. 5, 7 and 9, the transport of the particles is advection dominated in the Crab nebula, 3C 58, and G54.1+0.3. In addition, from the results we calculated, current diffusion coefficients of 8.5 × 1024 cm2 s−1, 2.5 × 1025 cm2 s−1, and 1.3 × 1025 cm2 s−1 at an electron energy of 1 TeV are derived for the Crab nebula, 3C 58, and G54.1+0.3, respectively. Compared with the propagation of cosmic rays, the diffusion mechanisms within PWNe are slow. The result is consistent with previous studies of the nonthermal radiation properties of PWNe (e.g., Lu et al. 2017a,b, 2020; Di Mauro et al. 2020).
Acknowledgments
We would like to thank the anonymous referee for the very constructive comments. This work is partially supported by the National Key R & D Program of China under grant No. 2018YFA0404204, and the National Natural Science Foundation of China (NSFC U1738211, 11803027), and Yunnan Fundamental Research Projects (grant No. 202101AU070099).
References
- Abdo, A. A., Ackermann, M., Ajello, M., et al. 2010, ApJ, 708, 1254 [Google Scholar]
- Abdo, A. A., Ajello, M., Allafort, A., et al. 2013, ApJS, 208, 17 [Google Scholar]
- Acciari, V. A., Aliu, E., Arlen, T., et al. 2010, ApJ, 719, L69 [NASA ADS] [CrossRef] [Google Scholar]
- Ackermann, M., Ajello, M., Allafort, A., et al. 2013, ApJS, 209, 34 [NASA ADS] [CrossRef] [Google Scholar]
- Abeysekara, A. U., Albert, A., Alfaro, R., et al. 2017, Science, 358, 911 [NASA ADS] [CrossRef] [Google Scholar]
- Abeysekara, A. U., Archer, A., Benbow, W., et al. 2018, ApJ, 866, 24 [NASA ADS] [CrossRef] [Google Scholar]
- Abeysekara, A. U., Albert, A., Alfaro, R., et al. 2019, ApJ, 881, 134 [NASA ADS] [CrossRef] [Google Scholar]
- An, H. 2019, ApJ, 876, 150 [NASA ADS] [CrossRef] [Google Scholar]
- Aharonian, F., Akhperjanian, A., Beilicke, M., et al. 2004, ApJ, 614, 897 [NASA ADS] [CrossRef] [Google Scholar]
- Aharonian, F., Akhperjanian, A. G., Bazer-Bachi, A. R., et al. 2006, A&A, 457, 899 [NASA ADS] [CrossRef] [EDP Sciences] [Google Scholar]
- Albert, J., Aliu, E., Anderhub, H., et al. 2008, ApJ, 674, 1037 [CrossRef] [Google Scholar]
- Aleksić, J., Ansoldi, S., Antonelli, L. A., et al. 2014, A&A, 567, L8 [NASA ADS] [CrossRef] [EDP Sciences] [Google Scholar]
- Amenomori, M., Bao, Y. W., Bi, X. J., et al. 2019, Phys. Rev. Lett., 123 [CrossRef] [Google Scholar]
- Baldwin, J. E. 1971, in The Crab Nebula, eds. R. D. Davies, & F. Graham-Smith, Proc. IAU Symp., 46, 22 (Reidel, Dordrecht) [NASA ADS] [CrossRef] [Google Scholar]
- Bucciantini, N., Arons, J., & Amato, E. 2011, MNRAS, 410, 381 [NASA ADS] [CrossRef] [Google Scholar]
- Camilo, F., Stairs, I. H., Lorimer, D. R., et al. 2002a, ApJ, 571, L41 [NASA ADS] [CrossRef] [Google Scholar]
- Camilo, F., Lorimer, D. R., Bhat, N. D. R., et al. 2002b, ApJ, 574, L71 [CrossRef] [Google Scholar]
- Chevalier, R. A. 2005, ApJ, 619, 839 [CrossRef] [Google Scholar]
- Di Mauro, M., Manconi, S., & Donato, F. 2020, Phys. Rev. D, 101 [CrossRef] [Google Scholar]
- de Jager, O. C., Slane, P. O., & LaMassa, S. 2008, ApJ, 689, L125 [NASA ADS] [CrossRef] [Google Scholar]
- Fang, J., & Zhang, L. 2010, A&A, 515, A20 [NASA ADS] [CrossRef] [EDP Sciences] [Google Scholar]
- Hennessy, G. S., O’Connell, R. W., Cheng, K. P., et al. 1992, ApJ, 395, L13 [NASA ADS] [CrossRef] [Google Scholar]
- H.E.S.S. Collaboration (Abdalla, H., et al.) 2018, A&A, 612, A2 [NASA ADS] [CrossRef] [EDP Sciences] [Google Scholar]
- H.E.S.S. Collaboration (Abdalla, H., et al.) 2019, A&A, 621, A116 [NASA ADS] [CrossRef] [EDP Sciences] [Google Scholar]
- H.E.S.S. Collaboration (Abdalla, H., et al.) 2020, Nat. Astron., 4, 167 [NASA ADS] [CrossRef] [Google Scholar]
- Hurley-Walker, N., Scaife, A. M. M., Green, D. A., et al. 2009, MNRAS, 396, 365 [CrossRef] [Google Scholar]
- Ishizaki, W., Tanaka, S. J., Asano, K., & Terasawa, T. 2017, ApJ, 838, 142 [NASA ADS] [CrossRef] [Google Scholar]
- Ishizaki, W., Asano, K., & Kawaguchi, K. 2018, ApJ, 867, 141 [NASA ADS] [CrossRef] [Google Scholar]
- Gaensler, B. M., & Slane, P. O. 2006, ARA&A, 44, 17 [Google Scholar]
- Gelfand, J. D., Slane, P. O., & Zhang, W. 2009, ApJ, 703, 2051 [NASA ADS] [CrossRef] [Google Scholar]
- Gelfand, J. D., Slane, P. O., & Temim, T. 2015, ApJ, 807, 30 [NASA ADS] [CrossRef] [Google Scholar]
- Grasdalen, G. L. 1979, PASP, 91, 436 [NASA ADS] [CrossRef] [Google Scholar]
- Green, D. A. 1985, MNRAS, 216, 691 [CrossRef] [Google Scholar]
- Green, D. A. 1986, MNRAS, 218, 533 [NASA ADS] [CrossRef] [Google Scholar]
- Green, D. A. 1994, ApJS, 90, 817 [NASA ADS] [CrossRef] [Google Scholar]
- Kolmogorov, A. 1941, Akademiia Nauk SSSR Doklady, 30, 301 [Google Scholar]
- Kennel, C. F., & Coroniti, F. V. 1984, ApJ, 283, 694 [CrossRef] [Google Scholar]
- Kothes, R. 2013, A&A, 560, A18 [NASA ADS] [CrossRef] [EDP Sciences] [Google Scholar]
- Kuiper, L., Hermsen, W., Cusumano, G., et al. 2001, A&A, 378, 918 [NASA ADS] [CrossRef] [EDP Sciences] [Google Scholar]
- Lang, C. C., Wang, Q. D., Lu, F., & Clubb, K. I. 2010, ApJ, 709, 1125 [Google Scholar]
- Leahy, D., Tian, W., & Wang, Q. D. 2008, ApJ, 136, 1477 [CrossRef] [Google Scholar]
- Li, J., Torres, D. F., Lin, T. T., et al. 2018, ApJ, 858, 84 [NASA ADS] [CrossRef] [Google Scholar]
- Lu, F. J., Aschenbach, B., & Song, L. M. 2001, A&A, 370, 570 [NASA ADS] [CrossRef] [EDP Sciences] [Google Scholar]
- Lu, F. J., Wang, Q. D., Aschenbach, B., Durouchoux, P., & Song, L. M. 2002, ApJ, 568, L49 [NASA ADS] [CrossRef] [Google Scholar]
- Lu, F.-W., Gao, Q.-G., & Zhang, L. 2017a, ApJ, 834, 43 [Google Scholar]
- Lu, F.-W., Gao, Q.-G., Zhu, B.-T., & Zhang, L. 2017b, MNRAS, 472, 2926 [NASA ADS] [CrossRef] [Google Scholar]
- Lu, F.-W., Gao, Q.-G., & Zhang, L. 2020, MNRAS, 498, 1911 [NASA ADS] [CrossRef] [Google Scholar]
- Lerche, I., & Schlickeiser, R. 1981, ApJS, 47, 33 [NASA ADS] [CrossRef] [Google Scholar]
- Liu, R.-Y., & Yan, H. 2020, MNRAS, 494, 2618 [NASA ADS] [CrossRef] [Google Scholar]
- Lyne, A. G., Pritchard, R. S., & Graham-Smith, F. G. 1993, MNRAS, 265, 1003 [NASA ADS] [CrossRef] [Google Scholar]
- Macias-Perez, J. F., Mayet, F., Aumont, J., & Desert, F.-X. 2010, ApJ, 711, 417 [NASA ADS] [CrossRef] [Google Scholar]
- Martin, J., Torres, D. F., & Rea, N. 2012, MNRAS, 427, 415 [NASA ADS] [CrossRef] [Google Scholar]
- Morsi, H. W., & Reich, W. 1987, A&AS, 69, 533 [NASA ADS] [Google Scholar]
- Ney, E. P., & Stein, W. A. 1968, ApJ, 152, L21 [NASA ADS] [CrossRef] [Google Scholar]
- Parker, E. N. 1965, Planet. Space Sci., 13, 9 [Google Scholar]
- Planck Collaboration XXXI. 2016, A&A, 586, A134 [NASA ADS] [CrossRef] [EDP Sciences] [Google Scholar]
- Porth, O., Vorster, M. J., Lyutikov, M., & Engelbrecht, N. E. 2016, MNRAS, 460, 4135 [NASA ADS] [CrossRef] [Google Scholar]
- Porter, T. A., Moskalenko, I. V., & Strong, A. W. 2006, ApJ, 648, L29 [CrossRef] [Google Scholar]
- Rees, M. J., & Gunn, J. E. 1974, MNRAS, 167, 1 [CrossRef] [Google Scholar]
- Reich, W., Fuerst, E., Altenhoff, W. J., Reich, P., & Junkes, N. 1985, A&A, 151, L10 [NASA ADS] [Google Scholar]
- Ren, J.-Y., Gao, Q. G., Li, H. Z., et al. 2019, MNRAS, 487, 5781 [NASA ADS] [CrossRef] [Google Scholar]
- Salter, C. J., Reynolds, S. P., Hogg, D. E., Payne, J. M., & Rhodes, P. J. 1989, ApJ, 338, 171 [NASA ADS] [CrossRef] [Google Scholar]
- Slane, P., Helfand, D. J., Reynolds, S. P., et al. 2008, ApJ, 676, L33 [NASA ADS] [CrossRef] [Google Scholar]
- Strong, A. W., Moskalenko, I. V., & Ptuskin, V. S. 2007, Ann. Rev. Nucl. Part. Sci., 57, 285 [NASA ADS] [CrossRef] [Google Scholar]
- Tanaka, S. J., & Takahara, F. 2010, ApJ, 715, 1248 [NASA ADS] [CrossRef] [Google Scholar]
- Tang, X., & Chevalier, R. A. 2012, ApJ, 752, 83 [NASA ADS] [CrossRef] [Google Scholar]
- Tang, X., & Piran, T. 2019, MNRAS, 484, 3491 [CrossRef] [Google Scholar]
- Taylor, J. H., Manchester, R. N., & Lyne, A. G. 1993, ApJ, 88, 529 [NASA ADS] [Google Scholar]
- Torres, D. F., Cillis, A. N., Martín, J., & Rodriguez, J. 2013, ApJ, 763, L4 [NASA ADS] [CrossRef] [Google Scholar]
- Torres, D. F., Cillis, A., Martín, J., & de Oña Wilhelmi, E. 2014, J. High Energy Astrophys., 1, 31 [NASA ADS] [Google Scholar]
- Torii, K., Slane, P. O., Kinugasa, K., Hashimotodani, K., & Tsunemi, H. 2000, PASJ, 52, 875 [NASA ADS] [CrossRef] [Google Scholar]
- Temim, T., Gehrz, R. D., Woodward, C. E., et al. 2006, ApJ, 132, 1610 [CrossRef] [Google Scholar]
- Temim, T., Slane, P., Reynolds, S. P., Raymond, J. C., & Borkowski, K. J. 2010, ApJ, 710, 309 [NASA ADS] [CrossRef] [Google Scholar]
- Van Etten, A., & Romani, R. W. 2011, ApJ, 742, 62 [NASA ADS] [CrossRef] [Google Scholar]
- Venter, C., & de Jager, O. C. 2006, Max Plank Institut fur extraterrestrische Physik, eds. C. Venter, & O. C. de Jager, Proceedings of the 363 WE-Heraeus Seminar on Neutron Stars and Pulsars, 291, 40 (Garching bei Munchen, Germany) [Google Scholar]
- Velusamy, T., & Becker, R. H. 1988, AJ, 95, 1162 [NASA ADS] [CrossRef] [Google Scholar]
- Veron-Cetty, M. P., & Woltjer, L. 1993, A&A, 270, 370 [NASA ADS] [Google Scholar]
- Vorster, M. J., & Moraal, H. 2013, ApJ, 765, 30 [NASA ADS] [CrossRef] [Google Scholar]
- Vorster, M. J., Tibolla, O., Ferreira, S. E. S., & Kaufmann, S. 2013, ApJ, 773, 139 [Google Scholar]
- Zhang, L., Chen, S. B., & Fang, J. 2008, ApJ, 676, 1216 [NASA ADS] [Google Scholar]
- Zhu, B. T., Fang, J., & Zhang, L. 2015, MNRAS, 451, 3145 [NASA ADS] [CrossRef] [Google Scholar]
- Zhu, B. T., Zhang, L., & Fang, J. 2018, A&A, 609, A110 [NASA ADS] [CrossRef] [EDP Sciences] [Google Scholar]
All Tables
All Figures
|
Fig. 1. Evolution of the SEDs of nonthermal photons for the PWN. The model parameters are as follows: the pulsar and ejecta parameters are the same as those of the Crab nebula, except for the PWN age (the values are listed in Table 1), and the adopted parameters are α1 = 1.5, α2 = 2.5, Eb = 3.0 × 10⁵ MeV, ηB = 0.03, ϵ = 0.3, κ(tini) = 1.0 × 1021 cm2 s−1, and δ = 1/3. The solid lines represent the benchmark case. Left panel: dashed lines represent pure diffusion scenarios. Right panel: dashed lines represent pure advection scenarios. |
| In the text | |
|
Fig. 2. Spectral energy distributions of the PWN for the different advection velocities with κ(tini) = 1.0 × 1021 cm2 s−1 and δ = 1/3 (left panel), and the different diffusion coefficients with advection velocity V(r) (right panel). The PWN age is assumed to be 1000 yr, and other model parameters are the same as those in Fig. 1. |
| In the text | |
|
Fig. 3. Spectral energy distributions of the PWN for different power-law indices of the diffusion coefficients. The PWN age is assumed to be 1000 yr, and other model parameters are the same as in Fig. 1. |
| In the text | |
|
Fig. 4. Comparison of the calculated SED with the observed data for the Crab nebula. The calculated SEDs of synchrotron emission (dashed black line), inverse Compton scattering with synchrotron photons (dashed magenta line), IR (dashed blue line), the CMB (dashed green line), starlight (dashed cyan line), and the total emission (solid red line) are shown. The observed data are described in the text. To illustrate the contributions of electrons of different energy to the radiation, the solid dark yellow, navy, and red lines represent the contribution of the electrons in the different energy bands. The model parameters are listed in Table 1. |
| In the text | |
|
Fig. 5. Different cooling and propagation timescales at the current time. The solid back, magenta, blue, green, dark yellow and red lines represent the adiabatic loss timescale, the synchrotron cooling timescale, the inverse Compton cooling timescale, the diffusion timescale, the advection timescale, and the total timescale, respectively. The related parameters are listed in Table 1. |
| In the text | |
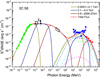 |
Fig. 6. Same as Fig. 4, but for 3C 58. |
| In the text | |
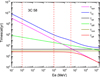 |
Fig. 7. Same as Fig. 5, but for 3C 58. |
| In the text | |
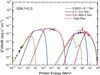 |
Fig. 8. Same as Fig. 4, but for G54.1+0.3. |
| In the text | |
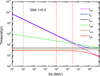 |
Fig. 9. Same as Fig. 5, but for G54.1+0.3. |
| In the text | |
Current usage metrics show cumulative count of Article Views (full-text article views including HTML views, PDF and ePub downloads, according to the available data) and Abstracts Views on Vision4Press platform.
Data correspond to usage on the plateform after 2015. The current usage metrics is available 48-96 hours after online publication and is updated daily on week days.
Initial download of the metrics may take a while.