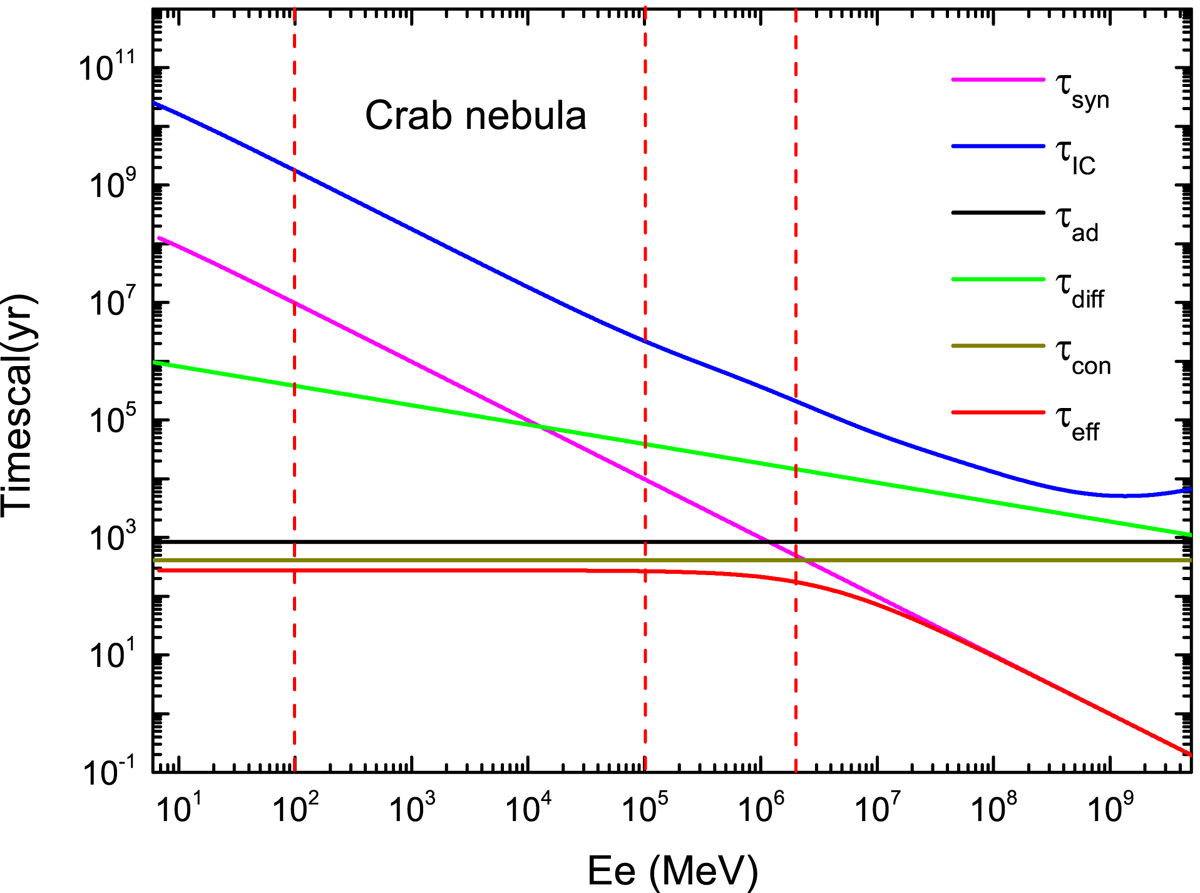
Fig. 5.
Download original image
Different cooling and propagation timescales at the current time. The solid back, magenta, blue, green, dark yellow and red lines represent the adiabatic loss timescale, the synchrotron cooling timescale, the inverse Compton cooling timescale, the diffusion timescale, the advection timescale, and the total timescale, respectively. The related parameters are listed in Table 1.
Current usage metrics show cumulative count of Article Views (full-text article views including HTML views, PDF and ePub downloads, according to the available data) and Abstracts Views on Vision4Press platform.
Data correspond to usage on the plateform after 2015. The current usage metrics is available 48-96 hours after online publication and is updated daily on week days.
Initial download of the metrics may take a while.