| Issue |
A&A
Volume 636, April 2020
|
|
|---|---|---|
| Article Number | A113 | |
| Number of page(s) | 10 | |
| Section | Interstellar and circumstellar matter | |
| DOI | https://doi.org/10.1051/0004-6361/201936505 | |
| Published online | 28 April 2020 | |
Halo fraction in TeV-bright pulsar wind nebulae
1
Max-Planck-Institut für Kernphysik,
PO Box 103980,
69029
Heidelberg,
Germany
e-mail: This email address is being protected from spambots. You need JavaScript enabled to view it.
2
Physik Institut, Universität Zürich,
Winterthurerstrasse 190,
8057
Zürich,
Switzerland
3
Istituto Nazionale di Fisica Nucleare,
Sezione di Padova,
35131
Padova,
Italy
4
Friedrich-Alexander-Universität Erlangen-Nürnberg, Erlangen Centre for Astroparticle Physics,
Erwin-Rommel-Str. 1,
91058
Erlangen,
Germany
Received:
13
August
2019
Accepted:
14
March
2020
Abstract
The discovery of extended TeV emission around the Geminga and PSR B0656+14 pulsars, with properties consistent with free particle propagation in the interstellar medium (ISM), has led to the suggestion of “TeV halos” as a separate source class, which is distinct from pulsar wind nebulae. This has sparked considerable discussion on the possible presence of such halos in other systems. In defining halos as regions where the pulsar no longer dominates the dynamics of the interstellar medium, yet where an over-density of relativistic electrons is present, we make an assessment of the current TeV source population associated with energetic pulsars in terms of size and estimated energy density. Based on two alternative estimators, we conclude that a large majority of the known TeV sources have emission originating in the zone that is energetically and dynamically dominated by the pulsar (i.e. the pulsar wind nebula), rather than from a surrounding halo of escaped particles diffusing into the ISM. Furthermore, whilst the number of established halos will surely increase in the future since there is a known large population of older, less energetic pulsars, we find that it is unlikely that such halos contribute significantly to the total TeV γ-ray luminosity from electrons accelerated in pulsar wind nebulae due to their lower intrinsic surface brightness.
Key words: gamma rays: general / pulsars: general / cosmic rays / diffusion
© G. Giacinti et al. 2020
 Open Access article, published by EDP Sciences, under the terms of the Creative Commons Attribution License (http://creativecommons.org/licenses/by/4.0), which permits unrestricted use, distribution, and reproduction in any medium, provided the original work is properly cited.
Open Access funding provided by Max Planck Society.
1 Introduction
The size of the zone within which a pulsar’s influence is dominant, that is, the pulsar wind nebula (PWN), is primarily dictated by the injected energy and the external pressure. Within this zone, relativistic particle propagation may be dominated by advection, rather than diffusion. Particle acceleration to >TeV energies is thought to occur at or near the pulsar wind termination shock, located at ~0.1 pc from the pulsar; however, relativistic particles are present, and radiating, on potentially much larger scales. The usual formalism applied to study the evolution of a PWN is magneto-hydrodynamics (MHD) and in this description the escape of particles cannot be easily included, but it is generally accepted that for young pulsars, such as the Crab, the confinement within the PWN is very effective. At some point in the evolution of the PWN, the mixing of the low density PWN material with the interstellar medium (ISM) or the reverse shock of an associated supernova remnant (SNR) is likely, and the PWN boundary becomes less clear cut and escape becomes possible. Escaping particles encounter the conditions of the ISM (or perhaps modified conditions associated with the earlier SNR, cf. Evoli et al. 2018) and their transport becomes dominated by diffusion, thus potentially forming a detectable halo of escaped particles and/or reaching the Earth to contribute to the measured local electron and positron fluxes. The recent detection of extended TeV emission around the two very nearby low power pulsars Geminga and PSR B0656+14 (Abeysekara et al. 2017a,b) has led to an extensive discussion of TeV halos and their contribution to the general population of TeV emitting PWN (Linden et al. 2017).
We propose a definition of an electron halo (referred to as “halo” hereafter) to be the presence of an over-density of relativistic electrons around a source or acceleration site in a zone in which the source itself does not dominate the dynamics or composition of the interstellar medium. This implies that diffusion is always expected to dominate in halos unless sources exist in regions where there are very large scale flows, such as a galactic wind or outflow. Alternative definitions have been suggested that are related to the emission region size in different wavebands and the dominant transport mechanism (Linden et al. 2017). The size of the emission region only corresponds to a physical boundary in the case of emission from un-cooled particles, for example, in the radio band; the highest energy electrons cool very rapidly and hence never reach any boundary or physical transition of the system. However, in all wavebands, the extent of the observed emission may also vary due to instrumental sensitivity and biases. Whilst a definition based on transport is appealing, in practice, it is extremely difficult to disentangle the transport processes inside the region that is energetically dominated by the pulsar to define a boundary at which diffusion begins to dominate (see e.g. H.E.S.S. Collaboration 2019). We note that halos may not always be symmetric. Electrons follow magnetic field lines in the interstellar turbulence around the source; additionally, in cases where the bulk of emitting electrons is located at distances from the source that are smaller than the coherence length of the turbulence, the halo is expected to appear asymmetric and filamentary (López-Coto & Giacinti 2018).
The potential existence of γ-ray emission in halo regions around energetic pulsars has long been known; their detectability has been predicted to depend on a low diffusion coefficient (Aharonian 1995). The formation of a halo is possible around any source class from which cosmic-ray electrons may escape before cooling. For GeV-emitting electrons, this has long been assumed to be the case for SNR, for example. For the >10 TeV electrons producing TeV γ-rays, radiative lifetimes are much shorter,  yr, and it is less clear if escape before cooling is possible for SNR or for other galactic sources.
After long being discussed as a potential source of the locally measured cosmic-ray electrons (see e.g. Atoyan et al. 1995), pulsar wind nebulae are the only class of sources for which the escape of TeV-emitting electrons is now firmly established (Abeysekara et al. 2017a). There are also indications of missing (apparently escaped) high energy electrons in the case of the Vela system (Hinton et al. 2011); however, alternative explanations, such as rapid cooling due to an enhanced magnetic field, are possible (Bao & Chen 2019). Apparently escaped relativistic electrons are detected in X-rays around the GuitarNebula (e.g. Johnson & Wang 2010) and the Lighthouse Nebula (e.g. Pavan et al. 2014). The most obvious way to differentiate between escaped and confined radiating particles is to estimate the PWN boundary using multi-wavelength data. This process is often problematic due to the effects of instrumental sensitivity, non-uniform magnetic fields, and particle cooling. For example, it is very often the case that the zone in which imaging of a PWN is possible in the X-ray domain, with instruments such as Chandra or XMM-Newton, is much smaller than the physical size of the PWN as determined in other wavelengths. Within the X-ray domain, the physical PWN size is also often energy dependent, which is interpreted as a signature of the rapid cooling of the highest energy electrons producing the keV synchrotron emission. Indeed, the typical cooling time of electrons emitting photons with characteristic energy hνc is  . In the radio domain, the cooling effect is unimportant, but surface brightness sensitivity is usually only sufficient for young and compact sources.
Here, we consider various estimates for the expected size of the nebulae around pulsars that have been associated to TeV emission, comparing these estimates to the measured sources sizes. We also assess the fraction of the power that is present in sources with and without halos and hence their contribution to the total γ-ray emission of all pulsars within star-forming systems.
2 Pulsar wind nebula evolution
According to the definition found above, halos may only exist around PWN whose electrons and positrons have started to escape into the surrounding, unperturbed ISM. It is therefore instructive to briefly recall the main stages of the evolution of a PWN. The environment of pulsars changes dramatically over time, firstly as contained within an evolving supernova remnant (SNR), and finally within the general ISM when the “kick” velocity received by the pulsar at birth moves it beyond the decelerated shell of the host SNR. There is considerable literature associated with PWN evolution, including several reviews, see in particular Gaensler & Slane (2006). In general, however, the existing work focuses on X-ray and radio emission, rather than TeV emission, and/or exclusively on the early to middle stages (≪ 100 kyr) of PWN evolution. Here we briefly consider the physical properties of the region from which TeV emission originates during the lifetime of a pulsar.
Figure 1 illustrates three stages in the evolution of a TeV-emitting PWN. In chronological order, we depict the following: first, the system at early times t ≲ 10 kyr after the supernova in the upper left panel, then intermediate times t ~ 10−100 kyr in the upper right panel, and, finally, late times t ≳ 100 kyr in the lower panel. Hereafter, we refer to these three stages as stage 1, stage 2, and stage 3, respectively. In all three panels of this sketch, the kick velocity that is initially imparted to the pulsar during the supernova explosion is assumed to point towards the left, and theISM density gradient in which the SNR evolves points “upwards”. The areas shaded in grey correspond to the SNR, and the surrounding solid, dashed, or dotted green lines denote the location of its forward shock. The black dots show the location of the pulsar, the PWN is shaded in blue, and the pulsar wind termination shock is represented with the thin solid blue line inside the PWN. The inset in the lower panel corresponds to an enlargement of the innermost regions of the PWN in stage 3. The high-energy electrons and/or positrons that are responsible for the TeV emission from PWN are usually thought to be accelerated at the termination shock. We note that electrons and positrons are often assumed to be accelerated in equal quantities, but this may not be the case. Giacinti & Kirk (2018)found that an individual pulsar may favour either positrons or electrons at the highest energies. Hereafter we use the word “electrons” indiscriminately when referring to electrons and/or positrons, unless stated otherwise. In each panel, with thin magenta lines, we sketched a few illustrative trajectories for some of these ≳ 10 TeV electrons. The dotted red lines delineate the typical extent of the ≳1 TeV γ-ray emission resulting from these electrons (see Fig. 1).
2.1 Stage 1: < 10 kyr
At early times (stage 1), the pulsar is still relatively close to its birthplace. The relativistic electron-positron wind that surrounds it, and which is decelerated to non-relativistic speeds at the termination shock, inflates a nebula inside the parent SNR. The ejecta from the supernova expands at supersonic speeds in the surrounding ISM, creating a forward shock (labelled “FS”). Inside the volume delimited by the contact discontinuity (“CD”) between the ejecta and the shocked ISM, a reverse shock (“RS”) appears as the expansion slows down. At these early times t ≲ 10 kyr, the reverse shock has not reached the PWN yet. The high-energy electrons accelerated at the PWN are thought to remain confined inside at this stage, and the TeV γ-rays emitted by these electrons should therefore come from within the nebula. Therefore, TeV emission from PWNe in stage 1 cannot be associated to halos. For the sake of simplicity, we drew the nebula as a spherically symmetric system, but we note that the reality may be more complex, see for example, the Crab Nebula where prominent filaments from the Rayleigh–Taylor instability are present. Eventually, the reverse shock returns inwards, towards the centre of the explosion. As is depicted in Fig. 1, the SNR expands more slowly in the direction where the ISM density is higher, and the reverse shock may then reach the PWN earlier from some directions than in others. At the end of stage 1 and the beginning of stage 2, the reverse shock crushes and disrupts the PWN; against which the PWN forward shock rebounds with the system experiencing several reverberations between the shock and the PWN (Blondin et al. 2001).
2.2 Stage 2: 10–100 kyr
At intermediate times t ~ 10−100 kyr (stage 2, see Fig. 1), the morphology of a PWN-SNR system is often highly irregular. It depends on both the properties of the material in the surrounding ISM as well as on the direction and velocity of the pulsar. The nebula is disrupted and the pulsar can be strongly off-centre with respect to the PWN. In our sketch, we drew the typical geometry one would expect for a system evolving in a smooth region of the ISM with a steady density gradient perpendicular to the pulsar velocity (see, for example, Figs. 12 and 13 in Slane et al. 2018 for hydrodynamical simulations of Vela X, as well as Fig. 6 in Temim et al. 2015 and Fig. 8 in Kolb et al. 2017 for simulations of G 327.1−1.1). At this stage, high-energy electrons start to escape from the PWN and propagate into the surrounding SNR; further escape into the surrounding ISM then becomes possible. A study of electron escape from Vela X is presented in Hinton et al. (2011). In Fig. 1, we show that the extent of the resulting TeV emission may now be greater than that of the nebula. This still does not constitute a true halo, in that the bulk of the TeV emission originates from electrons that do not propagate in the “unperturbed” ISM. Stage 2 may, however, correspond to TeV halos under the definition of Linden et al. (2017), as particle propagation may be diffusive within the expanding region producing non-thermal emission. We note that the sketch in Fig. 1 of Sudoh et al. (2019) corresponds to a standard PWN-SNR system in its stage 2, albeit in the specific case of a homogeneous ISM density and no pulsar motion.
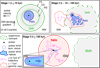 |
Fig. 1 Sketch of the main evolutionary stages of a PWN. Upper left panel: early times, t ≲ 10 kyr (“stage 1”), when the PWN is contained inside the SNR and before the reverse shock (RS) interacts with it. The SNR forward shock (FS) and contact discontinuity (CD) are plotted with green lines. The electrons that are responsible for the TeV γ-ray emission of the nebula are thought to be confined within the nebula at this stage. Upper right panel: intermediate times, t ~ 10− 100 kyr (“stage 2”), after the PWN is disrupted by the reverse shock, but before the pulsar escapes its SNR. At this stage, TeV γ-ray emitting electrons start to escape from the PWN into the SNR and possibly into the ISM. Lower panel: system at late times, t ≳ 100 kyr (“stage 3”), when the pulsar has escaped from its currently fading parent SNR. At this stage, high-energy electrons escape into the surrounding ISM, and may, only then, form a halo under our definition. See the text in Sect. 2for more details. The key is in the lower left corner. In all three panels, the ISM density gradient is upwards, and the pulsar “kick” velocity is towards the left. |
2.3 Stage 3: >100 kyr
At late times, typically t ≳ 100 kyr (stage 3, seeFig. 1), the pulsar has finally escaped from its parent SNR due to its kick velocity. At this stage, the SNR expands very slowly and fades away. The pulsar propagates in the ISM and forms a bow-shock PWN, with a tail of shocked pulsar wind trailing behind (blue region in Fig. 1). The inset shows an enlargement of the region around the head of the nebula. Observations of X-ray “filaments” around some bow-shock PWNe demonstrate that high-energy electrons can escape into the surrounding ISM. See, for example, Johnson & Wang (2010) and Hui et al. (2012) for the Guitar Nebula, and Pavan et al. (2014, 2016) for the Lighthouse Nebula. Theoretical studies also suggest that some of the high-energy electrons inside a bow-shock PWN can escape into the ISM, even in regions that are not far from the head of the nebula: see, for example, Bucciantini (2018) and Barkov et al. (2019). These particles should then diffuse in the surrounding turbulent interstellar magnetic fields and emit TeV γ-rays in a volume that is substantially larger than that of the PWN.
Only at this stage, and under the condition that escaped relativistic electrons do not dominate the energy density of the ISM, shouldthe TeV emission be considered as a true halo system. In general, only may old PWNe with ages ≳ 100 kyr (or, at least, ≳ a few tens of kyr) be surrounded by halos of TeV γ-ray emission. The recent HAWC detection of halos at TeV energies around the two stage 3 PWNe of Geminga pulsar and PSR B0656+14 (Abeysekara et al. 2017a) is consistent with this picture. We consider halos at this stage to constitute a clearly phenomenologically distinct source class from the PWNe of stages 1 and 2, whilst acknowledging that stage 2 systems may present ambiguous properties (see Table 1).
Properties of selected well-known PWN systems in different evolutionary stages, ordered according to the system age.
2.4 Properties of known PWNe
Table 1 provides a summary of the properties of several well-studied PWN systems in different evolutionary stages, which roughly correspond to the three stages illustrated in Fig. 1. Where the evolutionary stage is denoted as “1b” or “2b” in Table 1, the system may be considered to be currently between stages. This assignment is roughly based on the pulsar characteristic age; however, this may be a poor estimate of the true system age. In particular, the morphology of HESS J1825-137 suggests transitory behaviour with evolutionary models favouring an older age for the system (H.E.S.S. Collaboration 2019; Van Etten & Romani 2011).
To explore the relative sizes of the different components in a PWN-SNR system and their evolution, Table 1 compiles multi-wavelength measurements of the emission extent. The size of the SNR, RSNR, is given by the radius of a shell, which is often detected from radio information. The size of the central PWN, RPWN, is obtained from the extent of radio emission located immediately around the pulsar. The X-ray size, RX-ray, provided forcomparison is a measure of the central PWN size, which traces to the youngest energetic particles in the system. For the synchrotron emission seen in the radio to X-ray, the observed sizes relate to the magnetic field distribution as well as the particle distribution. In contrast the TeV size, RTeV, only depends on the particle distribution, at least in the usual case of close to uniform radiation density for inverse Compton scattering.
At early evolutionary times (stage 1), both X-ray and TeV emission fill the available region for a similar overall size as the PWN remains confined by a shock front. Towards later times (stages 2–3), the discrepancy between X-ray and TeV size becomes more pronounced as high energy electrons, producing synchrotron X-ray emission, cool close to the source; whereas older, lower energy electrons continue to produce significant TeV emission by IC scattering out to large radii due to particle transport and/or proper motion of the pulsar. However, the measured extension of X-ray emission may also be limited due to absorption along the line of sight and instrument sensitivity. Typically, RTeV is therefore somewhat larger than RX-ray for older systems, with RTeV∕RX-ray ≈ 5 for HESS J1825-137 and ≈ 100 for Geminga, whilst for the younger system MSH 15–52, RTeV∕RX-ray ≈ 1. We note, however, that here RTeV is given by the one sigma radius of the emission from Abdalla et al. (2018b), whereas RX-ray is given by the total visible extent of X-ray emission.
Lastly, as a further scale comparison, the pulsar kick velocity v and age of the system t are used to obtain an estimated displacement of the pulsar from its birth place. In Table 1, a value of 300 km s−1 is adopted, corresponding to the average of known pulsar kick velocities (Hansen & Phinney 1997). In comparing the emission extent for specific PWN-SNR systems across multiple wavelengths, differences in projection effects arising from variation in the extent along the line of sight have been neglected and they are assumed to be small with respect to the distance to the system.
3 Energy density estimates
Using two different methods, we now estimate the energy densities εe in relativistic electrons and positrons around pulsars with established associated TeV emission; see Table 2. Our selection of TeV sources comprises those identified as PWNe by the HESS collaboration in their study of the PWN population (Abdalla et al. 2018b), which has been expanded to include Geminga and PSR B0656+14 (Abeysekara et al. 2017a). Comparing these energy densities with the typical energy density of the ISM, εISM, allows one to determine in a first approximation whether the electrons that are responsible for the VHE γ-ray emission occupy the relatively unperturbed ISM (εe ≪ εISM) or if they are still contained in a region that is energetically and dynamically dominated by the pulsar (εe ≳ εISM).
Compilation of TeV γ-ray sources with pulsar associations (i.e. PWN or associated Halos), together with estimated electron energy densities within the emission region (see notes below and text for details).
3.1 Estimator using pulsar properties
Measured properties of the associated pulsar can be used to estimate the total power injected into accelerated electrons. The energy density is estimated simply as εe = Einj∕V, where V = 4πR3∕3 and R is the 68% containment radius for the TeV emission. For Geminga and PSR B0656+14, we calculated, according to the morphology reported in Abeysekara et al. (2017a), the radius at which 68% of the total γ-ray emission is contained. For the remaining sources, the sizes reported in Tables 1 and 3 of Abdalla et al. (2018b) were scaled to correspond to 68% containment and upper limits are kept as reported. The following two cases are considered: (A) Einj = Ė0τ0, where Ė0 is the initial spin down power and τ0 is the characteristic spin-down timescale; and (B) Einj = Ėτc, where τc is the characteristic age of the pulsar and Ė is the present spin-down power.
Case A represents the case of injection of essentially the full rotational energy of the pulsar soon after birth. We adopt values for the initial characteristic spin-down timescale corresponding to an extreme value of the birth period P0 = 10 ms in order to provide an upper limit to the energy content.This assumption leads to inferred energy densities that are larger than 10 eV cm−3 for all the sources considered here. Whilst for older sources, where cooling losses cannot be ignored, this is clearly an overestimate; it is worth noting that a low birth period can easily result in very high energy densities for systems of age < a few 10s of kyrs.
In Case B, we adopt the current spin down power of the pulsar as a measure of power input, again neglecting energy losses, hence: Einj = Ėτc. The results with this estimator are shown in the two upper panels of Fig. 2 and in the second column from the right in Table 2. The estimates in this case are typically a factor of 10− 100 lower than those of Case A. This case is pessimistic in the sense that it ignores the early evolution of the pulsar where significant energy injection may have taken place at higher Ė; however, it is optimistic in that it ignores losses and energy input in other channels (e.g. expansion of the nebula, magnetic fields). We consider Case B to be a better guide, in general, particularly for evolved sources as losses are unlikely to be negligible for TeV γ-ray emitting particles in the early life of the PWN when magnetic fields are high.
Clearly, more sophisticated treatments are possible, but all rely on models of the evolution of pulsars and their nebulae, which are not currently well constrained by the available data. Instead, we turned to existing measurements at TeV energies to empirically establish the current day electron population in (and/or around) these PWN.
3.2 Estimator using TeV γ-ray luminosity
The second method adopted consists of estimating εe from the measured VHE γ-ray emission of these objects. For Geminga and PSR B0656+14, we used the luminosities and spectral indices measured by the HAWC Collaboration over the energy range Eγ = 8−40 TeV (Abeysekara et al. 2017a). For all the other PWNe considered here, we used the measurements of their luminosities and spectral indices over the energy range Eγ = 1−10 TeV, as reported in Abdalla et al. (2018b). Since the electrons emitting at such high energies only provide a fraction of the total energy density εe, we needed to make a phenomenological assumption on the shape of the electron spectrum outside the energy range where it is constrained by these observations. To do so, we note that the electron spectra inferred for those PWNe that are observed at multiple wavelengths are roughly compatible with broken power-law spectra, with a low-energy break at Elow ~ 100 GeV, and a high-energy break at Ehigh ~ 1−10 TeV.
At energies Elow ≲ Ee ≲ Ehigh, the spectrum is roughly compatible with an  spectrum, and it softens at Ee ≳ Ehigh. At Ee ≲ Elow, the spectrum is, on the contrary, harder than
  , implying that the electrons at these low energies hardly contribute to the total energy density in relativistic electrons; see, for example, Meyer et al. (2010) for the Crab Nebula. We set Elow = 100 GeV and neglected the contribution of all electrons with Ee < Elow in our calculations of εe. In line with the theoretical expectation for particle acceleration at an ultra-relativistic shock with isotropic scattering, we assume that the electron spectrum between Elow and Ehigh follows a power-law
  (e.g. Achterberg et al. 2001). In order to test the dependence of our results on the a priori unknown value of Ehigh, we carried out our calculations for three different values: Ehigh = 1, 3, and 10 TeV. For each of these values of Ehigh, we tried two different slopes for the electron spectrum at Ee > Ehigh. First, we took a spectrum
  , which is consistent with the expectation for a cooled
  spectrum1. Second, we took a spectrum
  , where Γ was adjusted individually for each source such that the spectral index of its calculated γ-ray emission is consistent with the spectral index measured in the relevant energy range.
For each of the six electron spectra described above, we calculated, for each source, the γ-ray emission from inverse Compton scattering of these electrons on background radiation fields (CMB, UV, optical, and IR), using the Eq. (2.48) of Blumenthal & Gould (1970), which takes Klein-Nishina effects into account. The spectra of the background UV, optical, and IR photons were calculated using the model of Popescu et al. (2017) for the interstellar radiation fields. These fields were determined individually for each PWN, depending on its location in the Milky Way. Assuming the same source radii R as in the first method, we then inferred the electron densities εe that are required to fit the observed γ-ray luminosities in the energy ranges Eγ = 1−10 TeV for the H.E.S.S. paper sources, and Eγ = 8−40 TeV for the two HAWC sources. We note that since we only calculated typical average energy densities εe, our calculations are formally equivalent to assuming that the electrons are uniformly distributed within the volumes V = 4πR3∕3 of their sources. When we used the three electron spectra that are ∝E−3.2 at Ee > Ehigh, we only fitted the (total) measured γ-ray luminosity. In contrast, for the three electron spectra with adjustable slopes at Ee > Ehigh, we simultaneously fitted the measured γ-ray spectral index. For each source, we calculated six values of εe – one per electron spectrum. Hereafter, we provide the average of these values and indicate the spread with asymmetric errors.
The results are given in the last column of Table 2, and they are shown in the lower row of Fig. 2 as a function of the spin-down power (lower left) or characteristic age (lower right) of the associated pulsar. As in the upper row of Fig. 2, the colour of each symbol refers to the source radius R (see the colour bar on the right-hand side), and the area shaded in grey corresponds to the region where εe < 0.1 eV cm−3, that is, where εe ≪ εISM. Since the values of εe calculated with this second method are derived from measurements, they are likely a better indicator of the actual electron energy densities at the sources than those derived with the estimator of Sect. 3.1. Moderately large error-bars are present on the results due to the uncertainties on the shape of the electron spectrum. One can see that almost all of the objects considered here lie above or partly outside the grey band, except for the two HAWC sources (Geminga and PSR B0656+14).
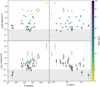 |
Fig. 2 Energy density within TeV sources associated with pulsars as a function of pulsar Ė and τc under different assumptions. Top panels: energy density calculated as εe = Ėτc∕V, described in Sect. 3.1. Bottom panels: energy density calculated using the electron spectrum derived from TeV γ-ray measurements, described in Sect. 3.2. The shaded regions correspond to an energy density lower than that of the ISM under any reasonable assumption. Systems for which measured properties are taken from the HGPS are indicated bycircles, whereas stars indicate the systems where HAWC data is used (see also Table 2). |
4 Discussion
4.1 Current halo fraction in TeV-bright PWNe
Figure 2 demonstrates that the VHE γ-ray emission from most TeV-bright PWNe is due to electrons that are contained in a region which is influenced energetically or dynamically by the pulsar (i.e. the PWN itself). Therefore, these sources do not constitute proper halos in which the TeV emission arises from a low energy density zone around the PWN. It is clear from Fig. 2 that the only really unambiguous halo cases in the sample of established TeV-emitting PWN are those powered by Geminga and PSR B0656+14, as established by Abeysekara et al. (2017a). These two HAWC sources stand out as clear halo cases: The electrons responsible for their TeV γ-ray emission propagate in a region where their contribution to the local total energy density is negligible (εe < 0.1 eV cm−3).
We note that there is a strong correlation (coefficient 0.98) between the two different energy density estimates shown in Fig. 2. This indicates that the γ-ray properties of PWN are typically more closely related to the current spin-down power, rather than the early lifetime of their pulsars. Whilst for the majority of systems the estimator using γ-ray luminosity results in consistent or lower energy densities than the Case B estimates of Sect. 3.1, for a small number of PWN, the energy density is larger. This is likely due to significant energy injected during the early phase of pulsar evolution.
The threshold in εe below whicha source can be classified as a halo is, of course, neither sharp, nor universal. Several of the sources are close to our indicative grey band. Some of these sources might be reaching the stage of their life when they start to transition towards a halo, although wecaution that the presence of incorrect pulsar associations in our sample is not excluded. Several objects are ambiguous cases in which more careful study of morphology, energetics, and environment would be needed for a clear classification. The ambiguous cases have characteristic ages that are consistent with stage 2 of Fig. 1, and it seems plausible that some of these objects are hybrids, exhibiting halo as well as PWN components. HESS J1825−137 is a candidate for this mixed situation. The energy-dependence of the morphology strongly suggests advection dominated transport within the PWN, but the fringes of the emission extend to very large distances and may indicate the presence of unconfined TeV-emitting particles (H.E.S.S. Collaboration 2019). The emission profile measured with HESS exhibits a change in slope on thesouthern side of the nebula, which may hint at a boundary between a high electron energy density core (the PWN) and a surrounding diffusive halo. This effect is more pronounced in linear strips and averages out over the azimuthal angle around the pulsar (see Figs. 4 and 5 of H.E.S.S. Collaboration 2019). Vela X is a well-known example where the TeV IC emission is concentrated within a central region; it is more extensive than the X-ray synchrotron emission, yet well-contained within the surrounding radio SNR such that we consider this to be a system entering stage 2 (Hinton et al. 2011; Bao & Chen 2019).
In our sample of TeV-bright systems with firm pulsar associations listed in Table 2, we note that the Crab and Geminga, both frequently used as canonical examples of the class, have the highest and lowest Ė, respectively. This suggests that both are extreme systems rather than typical of the population.
4.2 Total halo fraction in Galactic PWNe
Whilst the fraction of halos in current TeV catalogues is low, these catalogues are clearly biased towards compact, that is, PWN-like, rather than halo-like, objects, given the reduction in sensitivity to lower surface brightness emission at a fixed flux for resolved objects. In addition, the highest power objects are young (Table 2) and would not be expected to form halos yet; only close-by (old, low-power) pulsars are likely to exhibit detectable halos. However, the older systems which do exhibit halos are much more numerous, and it is important to consider the entire pulsar population to assess what fraction of the integrated TeV γ-ray emission is likely to occur within, and outside of, PWN.
Figure 3 shows the cumulative fraction of the energetic output of Galactic ATNF pulsars; this excludes millisecond pulsars2 (Manchester et al. 2005)as a function of their characteristic age. The energy fraction is extracted from the beaming angle corrected (Tauris & Manchester 1998) pulsar Ė, which is shown assuming the current pulsar properties. In order to better assess the contribution of different aged pulsars to the total energy in Galactic electrons, the total energy output of the pulsars was integrated over timescales of 104 and 105 yr (or the pulsar age if shorter), corresponding to the radiative lifetime in the ISM of around 10 and 1 TeV electrons, respectively. The energy output of the pulsars were assumed to evolve identically as  , with a τ0 set to 103 yr and α =(n + 1)∕(n − 1) assumed to be equal to 2 as for a pulsar braking index n = 3. Assuming that the power injected in to relativistic electrons evolves in the same manner, a simple evolutionary model using the GAMERA package (Hahn 2016) was constructed to predict the expected evolution of the PWN γ-ray luminosity at 1 TeV, both in a constant magnetic field environment and for a magnetic field evolving as
  . The cumulative energy fraction in 1 TeV γ-rays from this model is also shown in Fig. 3. As expected, these curves are approximately consistent with the cumulative energy fraction in the known pulsar population integrated over an electron lifetime of 104 yr, corresponding to 10 TeV electrons, which are responsible for 1 TeV γ-ray emission.
Figure 3 shows that the contribution of ≳ 105 yr old pulsars to the total TeV γ-ray luminosity of PWNe (black curves) is small, in general, and it depends on the cooling history of electrons injected early in the life of pulsars, when most of the rotational energy is lost. The γ-ray luminosity of older halo systems is low, as the majority of the power is injected into the PWN in the early phase of the pulsars evolution, with particle cooling expected prior to escape into the ISM. By contrast, stage 2 systems may account for up to a third of the total γ-ray luminosity. The overall efficiency for pulsars as cosmic-ray electron sources depends on the interplay of the electron lifetime and effectiveness of particle escape.
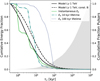 |
Fig. 3 Cumulative fraction of the energy output of the known Galactic pulsar population with ages < 107 yr (Manchester et al. 2005) created using the instantaneous energy output into electrons Ee as well as the energy output integrated up to 104 and 105 yr electron lifetimes. For comparison purposes, we show the cumulative γ-ray luminosity at 1 TeV from a generic PWN model as a function of system age, both for a constant magnetic field and a magnetic field evolving in time. The cumulative fraction of pulsars indicates that the energy output into electrons and γ-ray luminosity is dominated by a small fraction of young, energetic pulsars. |
4.3 Electron diffusion and escape
The electron diffusion coefficient measured by HAWC around Geminga and PSR B0656+14 is close to the Bohm limit and is two orders of magnitude smaller than the one inferred from the boron-to-carbon ratio (Abeysekara et al. 2017a). This naturally raises the question of whether the electrons responsible for these two halos probe the unperturbed interstellar turbulence or the turbulence generated by the cosmic rays that have escaped from these (or nearby) sources. Cosmic-ray self-confinement around hadronic sources has been studied by Ptuskin et al. (2008), Malkov et al. (2013), D’Angelo et al. (2016), and Nava et al. (2016), for example. More recently, Evoli et al. (2018) point out that self-confinement could also occur around sources of leptons, suggesting that this may explain the small diffusion coefficient found by HAWC around Geminga and PSR B0656+14. Our finding in Sect. 3.2 that εe ≪ εISM around these sources casts doubts on the ability of their electrons to modify the properties of the interstellar turbulence substantially. It cannot be excluded, though, that larger electron currents during an earlier phase, or cosmic rays from a nearby hadronic source, such as the parent SNRs of these pulsars, could have modified the turbulence in the halo regions around these two PWNe. However, it is worth noting that there is currently no need to invoke cosmic-ray-driven instabilities to explain the data. In particular, the value of the cosmic-ray diffusion coefficient measured by HAWC is compatible with theoretical expectations for isotropic turbulence with strengths and coherence lengths that are in the relevant ranges for interstellar turbulence (López-Coto & Giacinti 2018). If cosmic rays diffuse substantially faster in the Galactic halo than in the local ISM, tensions with the boron-to-carbon ratio might be avoided. Indeed, the boron-to-carbon ratio provides an estimate of the amount of matter that cosmic rays traverse before reaching Earth. Assuming homogeneous, isotropic diffusion in the entire Galaxy, one finds a typical diffusion coefficient value of ~ 1028 cm2 s−1 for GeV cosmic rays. However, this does not rule out the existence of regions with substantially slower diffusion; for instance, an example is the Galactic disc, so long as the grammage accumulated by cosmic rays in these regions does not overshoot that from the boron-to-carbon ratio. Cosmic rays would diffuse faster in the Galactic halo if it contains an out-of-plane, ordered magnetic field and has lower turbulence levels than the disc (e.g. Giacinti et al. 2018).
H.E.S.S. observations of electrons at Earth with > 10 TeV energies place stronger constraints on the possibility of a low diffusion coefficient in our local environment than the boron-to-carbon ratio does. As demonstrated in Hooper & Linden (2018), cosmic rays must diffuse substantially faster through the bulk of the Galactic disc than around Geminga for local known pulsars to explain the detection of > 10 TeV electrons at Earth. Alternatively, the scenario of a low diffusion coefficient in our local ISM would remain viable if a nearby undetected pulsar contributes to the high-energy end of the all-electron spectrum measured at Earth (López-Coto et al. 2018). In the future, observations of halos around pulsars in different γ-ray energy ranges should help to constrain the spectrum and nature of the turbulence probed by the emitting electrons. Extended GeV emission has recently been measured with the Fermi satellite around Geminga (Di Mauro et al. 2019).
Here, we discuss the halo fraction in TeV-bright PWNe; however, the formation of halo-like emission at TeV energies due to electron escape is a general phenomenon expected from cosmic accelerators. One possible example is the TeV emission that is detected beyond the shell in the SNR RX J1713.7-3946, which is hypothesised to be either due to a shock precursor or the escape of energetic particles from the shock region (H.E.S.S. Collaboration 2018). We note, however, that in this system and other candidate cases for leptonic halos, there is often ambiguity with a hadronic emission scenario.
4.4 Future prospects
Future detections of diffusive halos would considerably help to constrain this picture; the prospects for this were already discussed in Linden et al. (2017). New halos may have already been detected: the HAWC Collaboration recently announced the detection oftwo more candidate halos – HAWC J0543+233 around PSR B0540+23 (Ė = 4.1 ×1034 erg s−1, distance= 1.56 kpc, τc = 253 kyr, found in a search for extended sources with disc radius 0.5° (Riviere et al. 2017)) and HAWC J0635+070 around PSR J0633+0632 (Ė = 1.2 × 1035 erg s−1, distance = 1.35 kpc, τc = 59 kyr, with a Gaussian 1σ extent of 0.65° ± 0.18° (Brisbois et al. 2018)). The pulsars that may be powering these sources are in an advanced state of their evolution, and both fulfil the condition of being older than a few tens of kyr. A rough estimate of their energy densities can be made using the method of Sect. 3.1, which yields values of 0.6 eV cm−3 (using the 0.5° disc radius in lieu of the 68% containment radius) and 0.09 eV cm−3 (for a 23 pc 68% containment radius) for HAWC J0543+233 and HAWC J0635+070, respectively. Whilst these values are certainly consistent with those of Geminga and PSR B0656+14, using the estimator based on pulsar properties, it is difficult to provide a more accurate placement in Fig. 2 using the method of Sect. 3.2 due to the lack of more detailed information about their size and spectral properties. Because of the spin-down power and characteristic age of their central source, they should be located inside the grey band, corresponding to εe ≪ εISM, and remain clear candidates to be TeV halos; although, HAWC J0635+070 may be an ambiguous case. Despite their low luminosity, the total number of known halo sources may significantly increase with improvements in sensitivity of current and future γ-ray experiments, as a large population of older, less powerful pulsars is known.
Linden et al. (2017) propose that TeV-bright sources coincident with PWNe are a distinguishable halo phenomenon; most of the sources included in that study are consistent with the classical picture of a middle-age PWN (stage 2 of Fig. 2) with effective confinement, rather than an escaped population of electrons propagating in the ISM. Examples where the X-ray emission region boundary does not correspond to a physical discontinuity include the Crab nebula, MSH 15-52, and G327.1-1.1, as listed in Table 1, as well as G359.23-0.82 (“the Mouse” nebula), as shown in Fig. 6 of Gaensler & Slane (2006). The tail of the Mouse nebula is clearly longer in radio than in X-rays. From the observational point of view, it must be noted that the X-ray and TeV γ-ray size of these sources are expected to differ even in fully confined systems, for reasons discussed in Sect. 2. Observational γ-ray data may be used to determine whether individual sources are better classified as PWNe, halos, or hybrid systems. Both the energy density and particle transport properties within these systems can be derived by model fitting to the spectral energy distributions and angular emission profiles, respectively, thus enabling classification according to the evolutionary stage. We note, however, that neither property can be determined in a truly model-independent manner.
5 Conclusions
From this study, we conclude that the fraction of TeV-bright PWNe exhibiting halo properties is low; however, the fraction of PWNe that produce electron halos is presumably large and this is a generic feature of all pulsars with ages ≳ 105 yr. In the future, CTA (Cherenkov Telescope Array Consortium et al. 2019), SGSO/SWGO (Albert et al. 2019), and LHAASO (Bai et al. 2019)will detect new candidates and the number of halos will increase further. Nevertheless, the total halo fraction of TeV-bright γ-ray PWN is likely to remain small due to their comparatively low γ-ray luminosity (Fig. 3) and large angular size, limiting future detections towards local objects. A study of the prospects for future detections of halos by SGSO/SWGO is presented in the Sect. 4.1 of Albert et al. (2019).
Acknowledgements
The work of R.L.C. was financially supported by the European Union–Horizon 2020 research and innovation programme under the Marie Skłodowska-Curie grant agreement No. 754496 - FELLINI.
References
- Abdalla, H., Abramowski, A., Aharonian, F., et al. 2018a, A&A, 612, A1 [NASA ADS] [CrossRef] [EDP Sciences] [Google Scholar]
- Abdalla, H., Abramowski, A., Aharonian, F., et al. 2018b, A&A, 612, A2 [NASA ADS] [CrossRef] [EDP Sciences] [Google Scholar]
- Abeysekara, A. U., Albert, A., Alfaro, R., et al. 2017a, Science, 358, 911 [NASA ADS] [CrossRef] [Google Scholar]
- Abeysekara, A. U., Albert, A., Alfaro, R., et al. 2017b, ApJ, 843, 40 [NASA ADS] [CrossRef] [Google Scholar]
- Achterberg, A., Gallant, Y. A., Kirk, J. G., & Guthmann, A. W. 2001, MNRAS, 328, 393 [NASA ADS] [CrossRef] [Google Scholar]
- Aharonian, F. A. 1995, Nucl. Phys. B Proc. Suppl., 39, 193 [NASA ADS] [CrossRef] [Google Scholar]
- Albert, A., Alfaro, R., Ashkar, H., et al. 2019, ArXiv e-prints [arXiv:1902.08429] [Google Scholar]
- Atoyan, A. M., Aharonian, F. A., & Völk, H. J. 1995, Phys. Rev. D, 52, 3265 [NASA ADS] [CrossRef] [Google Scholar]
- Bai, X., Bi, B. Y., Bi, X. J., et al. 2019, ArXiv e-prints [arXiv:1905.02773] [Google Scholar]
- Bao, Y., & Chen, Y. 2019, ApJ, 881, 148 [NASA ADS] [CrossRef] [Google Scholar]
- Barkov, M. V., Lyutikov, M., Klingler, N., & Bordas, P. 2019, MNRAS, 485, 2041 [NASA ADS] [CrossRef] [Google Scholar]
- Blondin, J. M., Chevalier, R. A., & Frierson, D. M. 2001, ApJ, 563, 806 [NASA ADS] [CrossRef] [Google Scholar]
- Blumenthal, G. R., & Gould, R. J. 1970, Rev. Mod. Phys., 42, 237 [NASA ADS] [CrossRef] [Google Scholar]
- Brisbois, C., Riviere, C., Fleischhack, H., & Smith, A. 2018, ATel, 12013 [Google Scholar]
- Brisken, W. F., Thorsett, S. E., Golden, A., & Goss, W. M. 2003, ApJ, 593, L89 [NASA ADS] [CrossRef] [Google Scholar]
- Bucciantini, N. 2018, MNRAS, 480, 5419 [NASA ADS] [CrossRef] [Google Scholar]
- Caraveo, P. A., Bignami, G. F., De Luca, A., et al. 2003, Science, 301, 1345 [NASA ADS] [CrossRef] [Google Scholar]
- Caswell, J. L., Milne, D. K., & Wellington, K. J. 1981, MNRAS, 195, 89 [NASA ADS] [Google Scholar]
- Cherenkov Telescope Array Consortium, Acharya, B. S., Agudo, I., et al. 2019, Science with the Cherenkov Telescope Array (Singapore: World Scientific) [Google Scholar]
- D’Angelo, M., Blasi, P., & Amato, E. 2016, Phys. Rev. D, 94, 083003 [NASA ADS] [CrossRef] [Google Scholar]
- Di Mauro, M., Manconi, S., & Donato, F. 2019, Phys. Rev. D 100, 123015 [NASA ADS] [CrossRef] [Google Scholar]
- Du Plessis, I., de Jager, O. C., Buchner, S., et al. 1995, ApJ, 453, 746 [NASA ADS] [CrossRef] [Google Scholar]
- Dubner, G., Giacani, E., & Decourchelle, A. 2008, A&A, 487, 1033 [NASA ADS] [CrossRef] [EDP Sciences] [Google Scholar]
- Duncan, A. R., Stewart, R. T., Haynes, R. F., & Jones, K. L. 1996, MNRAS, 280, 252 [NASA ADS] [CrossRef] [Google Scholar]
- Duvidovich, L., Giacani, E., Castelletti, G., Petriella, A., & Supán, L. 2019, A&A, 623, A115 [NASA ADS] [CrossRef] [EDP Sciences] [Google Scholar]
- Dwarakanath, K. S. 1991, JA&A, 12, 199 [NASA ADS] [Google Scholar]
- Evoli, C., Linden, T., & Morlino, G. 2018, Phys. Rev. D, 98, 063017 [NASA ADS] [CrossRef] [Google Scholar]
- Frail, D. A., Kassim, N. E., Cornwell, T. J., & Goss, W. M. 1995, ApJ, 454, L129 [NASA ADS] [CrossRef] [Google Scholar]
- Gaensler, B. M., & Slane, P. O. 2006, ARA&A, 44, 17 [NASA ADS] [CrossRef] [Google Scholar]
- Giacinti, G., Kachelrieß, M., & Semikoz, D. V. 2018, J. Cosmol. Astropart. Phys., 2018, 051 [CrossRef] [Google Scholar]
- Giacinti, G., & Kirk, J. G. 2018, ApJ, 863, 18 [NASA ADS] [CrossRef] [Google Scholar]
- Gotthelf, E. V., Halpern, J. P., Terrier, R., & Mattana, F. 2011, ApJ, 729, L16 [NASA ADS] [CrossRef] [Google Scholar]
- Green, D. A. 2014, Bull. Astron. Soc. India, 42, 47 [NASA ADS] [Google Scholar]
- Green, D. A. 2017, A Catalogue of Galactic Supernova Remnants (2017 June version), available at http://www.mrao.cam.ac.uk/surveys/snrs/, Cavendish Laboratory, Cambridge, UK [Google Scholar]
- Hahn, J. 2016, PoS, ICRC2015, 917 [Google Scholar]
- Halpern, J. P., & Ruderman, M. 1993, ApJ, 415, 286 [NASA ADS] [CrossRef] [Google Scholar]
- Hansen, B. M. S., & Phinney, E. S. 1997, MNRAS, 291, 569 [NASA ADS] [Google Scholar]
- H.E.S.S. Collaboration (Abdalla, H., et al. ) 2018, A&A, 612, A6 [NASA ADS] [CrossRef] [EDP Sciences] [Google Scholar]
- H.E.S.S. Collaboration (Abdalla, H., et al.) 2019, A&A, 621, A116 [NASA ADS] [CrossRef] [EDP Sciences] [Google Scholar]
- Hinton, J. A., Funk, S., Parsons, R. D., & Ohm, S. 2011, ApJ, 743, L7 [NASA ADS] [CrossRef] [Google Scholar]
- Hooper, D., & Linden, T. 2018, Phys. Rev. D, 98, 083009 [NASA ADS] [CrossRef] [Google Scholar]
- Hui, C. Y., Huang, R. H. H., Trepl, L., et al. 2012, ApJ, 747, 74 [NASA ADS] [CrossRef] [Google Scholar]
- Johnson, S. P., & Wang, Q. D. 2010, MNRAS, 408, 1216 [NASA ADS] [CrossRef] [Google Scholar]
- Kargaltsev, O., Cerutti, B., Lyubarsky, Y., & Striani, E. 2015, Space Sci. Rev., 191, 391 [NASA ADS] [CrossRef] [Google Scholar]
- Kolb, C., Blondin, J., Slane, P., & Temim, T. 2017, ApJ, 844, 1 [NASA ADS] [CrossRef] [Google Scholar]
- Kothes, R. 2013, A&A, 560, A18 [NASA ADS] [CrossRef] [EDP Sciences] [Google Scholar]
- Linden, T., Auchettl, K., Bramante, J., et al. 2017, Phys. Rev. D, 96, 103016 [NASA ADS] [CrossRef] [Google Scholar]
- López-Coto, R., & Giacinti, G. 2018, MNRAS, 479, 4526 [NASA ADS] [CrossRef] [Google Scholar]
- López-Coto, R., Parsons, R. D., Hinton, J. A., & Giacinti, G. 2018, Phys. Rev. Lett., 121, 251106 [NASA ADS] [CrossRef] [Google Scholar]
- Ma, Y. K., Ng, C. Y., Bucciantini, N., et al. 2016, ApJ, 820, 100 [NASA ADS] [CrossRef] [Google Scholar]
- Malkov, M. A., Diamond, P. H., Sagdeev, R. Z., Aharonian, F. A., & Moskalenko, I. V. 2013, ApJ, 768, 73 [NASA ADS] [CrossRef] [Google Scholar]
- Manchester, R. N., Hobbs, G. B., Teoh, A., & Hobbs, M. 2005, AJ, 129, 1993 [NASA ADS] [CrossRef] [Google Scholar]
- Matheson, H., & Safi-Harb, S. 2010, ApJ, 724, 572 [NASA ADS] [CrossRef] [Google Scholar]
- Meyer, M., Horns, D., & Zechlin, H.-S. 2010, A&A, 523, A2 [NASA ADS] [CrossRef] [EDP Sciences] [Google Scholar]
- Mineo, T., Cusumano, G., Maccarone, M. C., et al. 2001, A&A, 380, 695 [NASA ADS] [CrossRef] [EDP Sciences] [Google Scholar]
- Nava, L., Gabici, S., Marcowith, A., Morlino, G., & Ptuskin, V. S. 2016, MNRAS, 461, 3552 [NASA ADS] [CrossRef] [Google Scholar]
- Ng, C. Y., Roberts, M. S. E., & Romani, R. W. 2005, ApJ, 627, 904 [NASA ADS] [CrossRef] [Google Scholar]
- Pavan, L., Bordas, P., Pühlhofer, G., et al. 2014, A&A, 562, A122 [NASA ADS] [CrossRef] [EDP Sciences] [Google Scholar]
- Pavan, L., Pühlhofer, G., Bordas, P., et al. 2016, A&A, 591, A91 [NASA ADS] [CrossRef] [EDP Sciences] [Google Scholar]
- Pavlov, G. G., Kargaltsev, O., & Brisken, W. F. 2008, ApJ, 675, 683 [NASA ADS] [CrossRef] [Google Scholar]
- Pellizzoni, A., Govoni, F., Esposito, P., Murgia, M., & Possenti, A. 2011, MNRAS, 416, L45 [NASA ADS] [CrossRef] [Google Scholar]
- Popescu, C. C., Yang, R., Tuffs, R. J., et al. 2017, MNRAS, 470, 2539 [NASA ADS] [CrossRef] [Google Scholar]
- Porquet, D., Decourchelle, A., & Warwick, R. S. 2003, A&A, 401, 197 [NASA ADS] [CrossRef] [EDP Sciences] [Google Scholar]
- Posselt, B., Pavlov, G. G., Slane, P. O., et al. 2017, ApJ, 835, 66 [NASA ADS] [CrossRef] [Google Scholar]
- Ptuskin, V. S., Zirakashvili, V. N., & Plesser, A. A. 2008, Adv. Space Res., 42, 486 [NASA ADS] [CrossRef] [Google Scholar]
- Rauw, G., Manfroid, J., Gosset, E., et al. 2007, A&A, 463, 981 [NASA ADS] [CrossRef] [EDP Sciences] [Google Scholar]
- Riviere, C., Fleischhack, H., & Sandoval, A. 2017, ATel, 10941 [Google Scholar]
- Safi-Harb, S., Harrus, I. M., Petre, R., et al. 2001, ApJ, 561, 308 [NASA ADS] [CrossRef] [Google Scholar]
- Slane, P., Lovchinsky, I., Kolb, C., et al. 2018, ApJ, 865, 86 [Google Scholar]
- Stupar, M., Parker, Q. A., & Filipović, M. D. 2008, MNRAS, 390, 1037 [NASA ADS] [CrossRef] [Google Scholar]
- Sudoh, T., Linden, T., & Beacom, J. F. 2019, Phys. Rev. D, 100, 043016 [NASA ADS] [CrossRef] [Google Scholar]
- Tauris, T. M., & Manchester, R. N. 1998, MNRAS, 298, 625 [NASA ADS] [CrossRef] [Google Scholar]
- Temim, T., Slane, P., Gaensler, B. M., Hughes, J. P., & Van Der Swaluw, E. 2009, ApJ, 691, 895 [NASA ADS] [CrossRef] [Google Scholar]
- Temim, T., Slane, P., Kolb, C., et al. 2015, ApJ, 808, 100 [NASA ADS] [CrossRef] [Google Scholar]
- Tibaldo, L., Zanin, R., Faggioli, G., et al. 2018, A&A, 617, A78 [NASA ADS] [CrossRef] [EDP Sciences] [Google Scholar]
- Trussoni, E., Massaglia, S., Caucino, S., Brinkmann, W., & Aschenbach, B. 1996, A&A, 306, 581 [NASA ADS] [Google Scholar]
- Uchiyama, H., Matsumoto, H., Tsuru, T. G., Koyama, K., & Bamba, A. 2009, PASJ, 61, S189 [NASA ADS] [CrossRef] [Google Scholar]
- Van Etten, A., & Romani, R. W. 2011, ApJ, 742, 62 [Google Scholar]
In a steady state, and for electrons that are continuously injected with a power-law spectrum with index − p and subject to synchrotron (or IC in the Thomson regime) cooling, the resulting population of cooled electrons has a power-law spectrum with index − p − 1.
This is on the basis that for a spun-up pulsar, the characteristic age is not a meaningful indication of the true age.
All Tables
Properties of selected well-known PWN systems in different evolutionary stages, ordered according to the system age.
Compilation of TeV γ-ray sources with pulsar associations (i.e. PWN or associated Halos), together with estimated electron energy densities within the emission region (see notes below and text for details).
All Figures
|
Fig. 1 Sketch of the main evolutionary stages of a PWN. Upper left panel: early times, t ≲ 10 kyr (“stage 1”), when the PWN is contained inside the SNR and before the reverse shock (RS) interacts with it. The SNR forward shock (FS) and contact discontinuity (CD) are plotted with green lines. The electrons that are responsible for the TeV γ-ray emission of the nebula are thought to be confined within the nebula at this stage. Upper right panel: intermediate times, t ~ 10− 100 kyr (“stage 2”), after the PWN is disrupted by the reverse shock, but before the pulsar escapes its SNR. At this stage, TeV γ-ray emitting electrons start to escape from the PWN into the SNR and possibly into the ISM. Lower panel: system at late times, t ≳ 100 kyr (“stage 3”), when the pulsar has escaped from its currently fading parent SNR. At this stage, high-energy electrons escape into the surrounding ISM, and may, only then, form a halo under our definition. See the text in Sect. 2for more details. The key is in the lower left corner. In all three panels, the ISM density gradient is upwards, and the pulsar “kick” velocity is towards the left. |
| In the text | |
|
Fig. 2 Energy density within TeV sources associated with pulsars as a function of pulsar Ė and τc under different assumptions. Top panels: energy density calculated as εe = Ėτc∕V, described in Sect. 3.1. Bottom panels: energy density calculated using the electron spectrum derived from TeV γ-ray measurements, described in Sect. 3.2. The shaded regions correspond to an energy density lower than that of the ISM under any reasonable assumption. Systems for which measured properties are taken from the HGPS are indicated bycircles, whereas stars indicate the systems where HAWC data is used (see also Table 2). |
| In the text | |
|
Fig. 3 Cumulative fraction of the energy output of the known Galactic pulsar population with ages < 107 yr (Manchester et al. 2005) created using the instantaneous energy output into electrons Ee as well as the energy output integrated up to 104 and 105 yr electron lifetimes. For comparison purposes, we show the cumulative γ-ray luminosity at 1 TeV from a generic PWN model as a function of system age, both for a constant magnetic field and a magnetic field evolving in time. The cumulative fraction of pulsars indicates that the energy output into electrons and γ-ray luminosity is dominated by a small fraction of young, energetic pulsars. |
| In the text | |
Current usage metrics show cumulative count of Article Views (full-text article views including HTML views, PDF and ePub downloads, according to the available data) and Abstracts Views on Vision4Press platform.
Data correspond to usage on the plateform after 2015. The current usage metrics is available 48-96 hours after online publication and is updated daily on week days.
Initial download of the metrics may take a while.