| Issue |
A&A
Volume 683, March 2024
|
|
|---|---|---|
| Article Number | A180 | |
| Number of page(s) | 8 | |
| Section | Interstellar and circumstellar matter | |
| DOI | https://doi.org/10.1051/0004-6361/202347311 | |
| Published online | 19 March 2024 | |
Searching for X-ray counterparts of degree-wide TeV halos around middle-aged pulsars with SRG/eROSITA
1
Max-Planck Institut für extraterrestrische Physik,
Giessenbachstraße,
85748
Garching, Germany
e-mail: This email address is being protected from spambots. You need JavaScript enabled to view it.
2
Max-Planck Institut für Radioastronomie,
Auf dem Hügel 69,
53121
Bonn, Germany
3
INAF – Osservatorio Astronomico di Brera,
Via E. Bianchi 46,
23807
Merate (LC), Italy
4
Dr. Karl Remeis Observatory, Erlangen Centre for Astroparticle Physics, Friedrich-Alexander-Universität Erlangen-Nürnberg,
Sternwartstraße 7,
96049
Bamberg, Germany
5
School of Astronomy and Space Science, Nanjing University,
Nanjing
210023
Jiangsu, PR China
6
Key laboratory of Modern Astronomy and Astrophysics (Nanjing University), Ministry of Education,
Nanjing
210023, PR China
Received:
28
June
2023
Accepted:
6
November
2023
Abstract
Context. Extended gamma-ray TeV emission (TeV halos) has been detected around middle-aged pulsars. A proposed model to explain these TeV halos is that electrons from a degree-wide pulsar wind nebula (PWN) get up-scattered by cosmic microwave background photons through inverse Compton processes. However, no X-ray degree-wide faint diffuse PWNe have been found around these middle-aged pulsars in previous X-ray observations.
Aims. We performed a search for degree-wide PWNe around Geminga, PSR B0656+14, B0540+23, J0633+0632, and J0631+1036 using data from the first four consecutive Spectrum Roentgen Gamma/eROSITA all-sky surveys. In order to better understand the mechanisms underlying the formation of TeV halos, we investigated the magnetic field strength within an area of 1° in radius centred on those pulsars.
Methods. To achieve our goals, we selected a list of suitable candidate pulsars in the eROSITA-DE part of the sky and applied data reduction techniques to process the eROSITA data. We then performed a spatial analysis of the regions around selected pulsars.
Results. We do not detect any degree-wide diffuse emission driven by rotation-powered pulsars around Geminga, PSR B0656+14, B0540+23, J0633+0632, or J0631+1036. Indeed, close inspection of the data shows that the pulsars of interest are all embedded in diffuse emission from supernova remnants such as the Monogem Ring or the Rosetta Nebula, while PSR B0540+23 is located ~2.5° away from the Crab pulsar, which is exceptionally bright, causing its X-ray emission to spread over a significant area up to the position of PSR B0540+23 and therefore strongly diminishes our capacity to search for degree-wide bright diffuse X-ray emission.
Conclusions. Despite the non-detection of any degree-wide PWN surrounding the analysed pulsars, we set flux upper limits to provide useful information on magnetic field strength and its spatial distribution around those pulsars, providing additional constraints on the proposed theory for the formation of TeV halos around pulsars.
Key words: pulsars: general / ISM: magnetic fields / X-rays: ISM
© The Authors 2024
 Open Access article, published by EDP Sciences, under the terms of the Creative Commons Attribution License (https://creativecommons.org/licenses/by/4.0), which permits unrestricted use, distribution, and reproduction in any medium, provided the original work is properly cited.
This article is published in open access under the Subscribe to Open model.
Open Access funding provided by Max Planck Society.
1 Introduction
Extended TeV emission (so-called TeV halos) was recently detected around a few middle-aged pulsars. This includes the discovery of extended TeV emission around the nearby pulsars Geminga and PSR B0656+14 by the High Altitude Water Cherenkov observatory (HAWC) Abeysekara et al. (2017), and the discovery of the source LHAASO J0621+3755 Aharonian et al. (2021) surrounding PSR J0622+3749, which was achieved using the Large High Altitude Air Shower Observatory (LHAASO). These findings strongly suggest that these phenomena may be common. A proposed model to explain this extended TeV emission – which relates it to the associated pulsars – is that electrons from a degree-wide pulsar wind nebula (PWN) get up-scattered by cosmic microwave background (CMB) photons through inverse Compton processes Li et al. (2022).
These electrons can produce emission in the X-ray range via the synchrotron process in the interstellar magnetic field, which typically has a strength of 3–6 μG. Consequently, diffuse X-ray emission with a comparable morphology to the TeV halos is expected (Li et al. 2022).
Li et al. (2023) recently studied the X-ray emission in the region of the extended TeV source HESS J1809-193. The pulsar wind nebula of PSR J1809-1917, which is located within the extended gamma-ray emission, was proposed by these authors as a possible candidate for producing the TeV emission. Their results show the presence of diffuse non-thermal X-ray emission extending beyond the PWN, which these authors interpreted as an X-ray halo caused by escaping electron-positron pairs from the PWN. The analysis of Li et al. (2023) suggests that a relatively strong magnetic field of 21 μG is required to explain the spatial evolution of the X-ray spectrum.
The High Energy Spectroscopic System (H.E.S.S.) is an array of Imaging Atmospheric Cherenkov Telescopes (IACTs) designed to study cosmic gamma rays with energies ranging from ~100 GeV to several tens of TeV (Aharonian et al. 2006). H.E.S.S. uses the imaging atmospheric Cherenkov technique to detect gamma rays via their interactions with the atmosphere, which produce a shower of charged particles that emit Cherenkov light.
The HAWC observatory uses the water Cherenkov detector array to detect gamma rays. It has been operating since 2015, has a field of view of more than 2 sr and is sensitive to gamma rays in an energy range from hundreds of GeV to hundreds of TeV (Albert et al. 2020). The angular resolution of HAWC varies depending on the energy and zenith angle of the signal, ranging from 0.1° to 1.0°. The LHAASO combines several different types of detectors: a 1.3 km array of electromagnetic particle and muon detectors, a water Cherenkov detector array, 18 wide-field-of-view air Cherenkov telescopes, and an electron-neutron detector array. Current X-ray telescopes, such as Chandra and XMM-Newton, have comparatively small fields of view and are therefore not very suitable for detecting such emission. Liu et al. (2019a) analysed the data of Chandra and XXMM-Newton around the Geminga pulsar and found no indication of the X-ray halo emission. The result posed an upper limit of 0.6μG on the interstellar magnetic field around the pulsar, or implies a mean magnetic field direction closely aligned with the line of sight of the observer toward the pulsar Liu et al. (2019b). However, the result only applies to the innermost 10' region from the pulsar due to the limited field of view of these two instruments. Given its excellent sensitivity and unlimited field of view, eROSITA is an ideal instrument to search for X-ray halo emission or to deduce more comprehensive constraints on the magnetic field in the halo region.
The eROSITA (extended ROentgen Survey with an Imaging Telescope Array) instrument (Predehl et al. 2021) is a space-based X-ray telescope designed to conduct a survey of the entire X-ray sky in unprecedented detail. Launched in 2019 as a part of the Russian-German Spectrum-Roentgen-Gamma (SRG) mission, eROSITA consists of seven identical X-ray mirror modules and has now completed four full all-sky surveys.
Its excellent sensitivity in a broad energy range (~0.2–10 keV) and large field of view (0.81 deg2) make eROSITA a suitable instrument for measuring the spatial distribution of the X-ray halos from sub-parsec scale up to scales of tens of parsecs. eROSITA data are divided between German and Russian consortia. Data with a Galactic longitude of <180° belong to the Russian consortium, while data with 1 > 180° (western Galactic hemisphere) belong to the German eROSITA consortium (eROSITA-DE).
In order to search for the X-ray halos, we selected a list of suitable candidate pulsars in the eROSITA-DE part of the sky. These include PSR J0633+1746 (Geminga), PSR B0656+14, PSR J0633+0632, PSR J0631+1036, and PSR B0540+23. However, the first four pulsars are located in the Monogem Ring, a nearby supernova remnant of 20° in width, which hampers the search for faint diffuse emission around these pulsars (cf. Knies et al. 2023). PSR B0540+23 is located near the Crab pulsar, which is exceptionally bright, causing its X-ray emission to spread over a significant area up to the position of PSR B0540+23. Nevertheless, the detection of such emission – or even upper limits on it – may provide useful information on magnetic field strength and its spatial distribution around pulsars and important input into the proposed theory for the formation of TeV halos around middle-aged pulsars.
Our paper is organised as follows: in Sect 2, we describe the data reduction techniques used to process the eROSITA data. In Sect. 3, we present the results of our spatial analysis of the regions around selected pulsars. Section 4 summarises the results, including upper limits on the degree-wide diffuse emission around pulsars. Finally, in Sect. 5, we summarise our findings, highlighting the implications of the upper limits for the proposed model and including potential explanations for the lack of detection and suggestions for future research in this area.
Properties of X-ray halo candidate pulsars.
2 Data reduction
We used data from the eROSITA telescope to search for X-ray halos around a sample of pulsars. Our sample consists of five pulsars, selected based on their value of spin-down energy per square distance, their age, their magnetic field, and the presence of TeV counterparts. Table 1 shows the list of selected pulsars, including those from Li et al. (2022) and three additional pulsars, and summarises the properties of the pulsars, including dispersion measure (DM), distance, age, surface magnetic field strength (Bsurf), spin-down power ( ), and energy flux at Earth (
 ).
).
Li et al. (2022) argue that there is an age range within which pulsars produce X-ray halos. Young pulsars are unlikely to exhibit halo-like emission because electrons accelerated by PWNe are injected into the interstellar medium (ISM) only a few tens of thousands of years after their birth. On the other hand, the spin-down luminosity of pulsars diminishes with age, causing the diffuse X-ray emission surrounding old pulsars to be too faint to be detected. Therefore, X-ray halos are expected to be visible only around middle-aged pulsars, which have characteristic ages of between 50 and 500 kyr.
We expanded the sample from Li et al. (2022) by including PSR J0631+1036 and PSR B0540+23. Although the Crab pulsar also satisfies the aforementioned criteria, it is too bright to apply a meaningful data analysis to it. Moreover, the Crab pulsar partly overlaps with the position of PSR B0540+23. The other four pulsars (Geminga, B0656+14, J0633+0632, and J0631+1036) are located in the Monogem Ring, a nearby supernova remnant complex of 20° in width. Figure 1 shows the Monogem Ring as seen by eROSITA during the four sky surveys. A detailed analysis of the Monogem Ring complex as seen by eROSITA will be presented in an upcoming paper by Knies et al. (2023). As can be seen from Fig. 1, searching for faint diffuse emission around these pulsars is challenging because of the diffuse background contribution from the Monogem Ring itself.
To search for X-ray halos around pulsars, we analysed data from the eRASS:4 (stacked data from the first four consecutive all-sky surveys). Specifically, we used events in the 0.2–8.0 keV energy range in regions around Geminga, B0656+14, J0633+0632, J0631+1036 (~400 s expositions ), and B0540+23 (~500 s exposition).
To combine data from all seven telescope modules (TMs) and merge the individual sky tiles, we followed the standard data reduction procedure using the evtool task provided in the latest internal release of eSASS, which is the eROSITA science analysis software (version eSASSusers_211214; Brunner et al. 2022). During the merging process, we employed the recommended flag and pattern filter keywords. To recentre the images around the positions of the pulsars of interest, we used the radec2xy task. Subsequently, we created exposure-corrected images of the regions around these pulsars using the expmap task and binned them to a pixel size of 20″ as per the established method.
To avoid contamination, we masked out all highly significant point sources using the catalogue produced at MPE with eSASS. We used a detection likelihood threshold of DET_LIKE_0 > 14.37 (5σ) and a mask radius of 120″. In the case of B0656+14, we masked the pulsar with a circle of 6′ radius because of its high level of brightness.
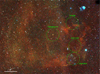 |
Fig. 1 Image of the Monogem Ring complex as seen in the eROSITA all-sky surveys eRASS:4 (cf. Knies et al. 2023). The supernova remnants IC443 and G189.6+03.3 (cf. Camilloni & Becker 2023) are visible in the upper right corner. Photons to produce the image were colour-coded according to their energy (red for energies 0.2–0.4 keV, green for 0.4–0.6 keV, blue for 0.6–1.2 keV). The green circles have a radius of 2° centred on the position of the pulsars PSR B0656+14, Geminga, PSR J0631+1036, and PSR J0633+0632. |
3 Spatial analysis
In order to search for any potential extended X-ray emission around the pulsars, we first conducted a thorough visual inspection of the images obtained from eROSITA. Despite careful examination, we did not detect any halo-like structures.
To obtain a quantitative measure of the significance of any potential extended emission, we extracted the source photons from circular regions with radii of 0.5° and 1° centred around the pulsars (see Fig. 2). In order to determine the background levels, we employed 9 and 15 circular regions with radii of 0.25° around the smaller and larger source regions, respectively. We calculated the background level as the average of counts in these regions. PSR J0633+0632 is located near the Monoceros Nebula (see Fig. 2d). Therefore, in this case, we used only regions 5–9 for background.
The uncertainty was estimated as
 (1)
(1)
where t is exposure, N is the number of photons, and CR is the count rate. We also computed the resulting uncertainty in the background using error propagation:
 (2)
(2)
where n is the number of background regions, and  is the uncertainty of the i-th background region.
Our analysis indicates that there is no significant extended X-ray emission around the pulsars in the studied energy range. We note that the background estimation is subject to potential systematic uncertainties due to the presence of contaminating sources.
Background variability can also be an important factor to consider. We investigated the background variability in the eROSITA data and found it to be relatively constant. We examined light curves from background regions around all pulsars in our sample and observed no significant changes in the background signal over time within the errors.
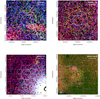 |
Fig. 2 eROSITA X-ray images showing the regions surrounding the pulsars. (a)–(c): the RGB eROSITA X-ray images. Photons to produce the image were colour-coded according to their energy (red for energies 0.2–0.7 keV, green for 0.7–1.1 keV, blue for 1.1–8.0 keV). Point sources with a detection likelihood equal to or larger than 5σ were removed. Solid circles have radii 0.5° (white) and 1° (yellow) and are used as source regions. Dashed circles with radii 0.25° are used as background regions. (d) eROSITA X-ray image showing the region surrounding PSR J0633+0632. The blue circle indicates the Monoceros Nebula, which contributes to a higher background level in regions 5–9. |
X-ray count rates and flux upper limits (0.5–2.0 keV) along with magnetic field strength constraints.
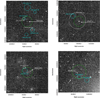 |
Fig. 3 eROSITA X-ray images showing the regions surrounding the pulsars. The white and blue circles and the square in panel c indicate the positions and uncertainties of the TeV sources from the 2HWC and 3HWC catalogues, respectively. The sizes of the circles correspond to the uncertainties of positions. The green dashed circles centred around the pulsars have a radius of 0.5°. (a) Geminga. (b) B0656+14. (c) J0633+0632. (d) B0540+23. |
4 Results
Our analysis results are presented in Table 2, which displays the count rates and corresponding errors in circles of 1° in diameter and background regions for each selected pulsar.
The first and second columns of the table provide the count rates and errors for the regions around the pulsar and the background, respectively.
No diffuse emission was detected around the selected pulsars at a significance level of 3σ. To derive upper limits on the flux of the degree-wide emission, we calculated the maximum possible count rate as
 (3)
(3)
where CRs is the count rate in the central region, CRb is the mean count rate in the background regions, and σs; and σb are corresponding uncertainties.
We then converted the count rate to flux by assuming a power-law spectrum with a photon index Γ = 2 and simulating the observations using XSPEC. The hydrogen column density (NH) was taken to be 2 × 1020 cm−2 for Geminga (Mori et al. 2014), 1.7 × 1020 cm−2 for B0656+14 (Schwope et al. 2022), 3 × 1021 cm−2 for J0633+0632 (Danilenko et al. 2015), and 2 × 1021 cm−2 for J0631+1036 (Torii et al. 2001). For B0540+23, which was not detected in X-rays, we assumed NH = 2 × 1021 cm−2 based on the known DM of 77.7 cm−3 pc and the correlation between NH and DM (He et al. 2013). The resulting 3σ flux upper limit for each pulsar is presented in the third column of Table 2. We also examined the effect of varying parameters – such as the photon index and the size and shape of the background regions – on the derived upper limits. Our findings reveal that varying these parameters within a reasonable range (~15%) yields consistent results, emphasising the stability of our upper limits.
We determined the magnetic field strength upper limits presented in the fifth column of Table 2 using the model introduced in Li et al. (2022). These upper limits were computed based on the observed X-ray upper limits associated with potential diffuse emissions surrounding the target pulsars following the framework outlined in Li et al. (2022).
Our analysis methodology involves fitting the TeV flux and surface brightness profiles while ensuring that the simulated X-ray flux remain below the eROSITA upper limits. For the TeV data, we relied on the TeV flux measurements from HAWC for Geminga and B0656+14, as provided by Abeysekara et al. (2017). For the remaining pulsars, we used LHAASO data (Cao et al. 2023).
To provide context for our findings, we compare them to the predicted interstellar magnetic field strengths around these pulsars, as calculated by the Jansson & Farrar 2012 model (JF12) (Jansson & Farrar 2012). The derived magnetic field strength upper limit (BUL) is consistent with the expected interstellar magnetic field strength (BJF12) around the first three pulsars in the table (Geminga, PSR B0656+14, and J0633+0632), while significantly lower limits are obtained for the last two pulsars (J0631+1036 and B0540+23).
It is worth noting that our findings provide important clues as to the magnetic field geometry in the halo region under the anisotropic diffusion model of TeV halos, as described by Liu et al. (2019b). Additionally, we acknowledge the contribution of the study conducted by Liu et al. (2019a), in which magnetic field constraints around Geminga were obtained based on XMM and Chandra data, revealing an upper limit of <0.6, μG for the inner 10 arcminutes. The use of eROSITA, with its broader field of view, enables a more comprehensive understanding of the magnetic field properties in these pulsar halos.
Figure 2 shows exposure-corrected images of the pulsars regions. Point sources with detection likelihood corresponding to 5σ are removed. Solid circles have radii of 0.5° (green) and 1° (yellow) and are used as source regions. Dashed circles with radii 0.25° are used as background regions. The location of the PSR B0540+23 is very close to the bright Crab pulsar, which outshines the eROSITA PSF and makes the analysis of the background quite problematic.
5 Conclusion
Our results show that no degree-wide diffuse halo-like emission is detected around the selected pulsars using eROSITA data. This non-detection could be attributed to several factors. In the case of PSR B0656+14, Geminga, PSR J0633+0632, and PSR J0631+1036, which are located inside the Monogem Ring, the diffuse emission from that supernova remnant (SNR) complex certainly reduces the sensitivity for detecting emission from low-surface brightness and degree-wide plerions powered by the pulsars. Although the contribution from the Monogem Ring is mostly below 1 keV, we do not detect diffuse X-ray emission at higher energies (above 1 keV) as well. Similarly, PSR B0540+23 is located near the bright Crab pulsar, which outshines the full eROSITA PSF and partly overlaps the position of PSR B0540+23, making the detection of faint diffuse emission challenging.
Our upper limits on the degree-wide diffuse emission are used to put constraints on the strength and spatial distribution of magnetic fields around pulsars. Our results show that the magnetic field strength in the TeV halos around Geminga, PSR J0631+1036, and PSR B0540+23 is lower than the anticipated average value of 3 μG (Li et al. 2022).
Alternatively, it is possible that for some pulsars, the TeV emission is produced by other sources in the vicinity of the pulsars. Not all of the candidates are reliably associated with TeV sources. The positions of the possible TeV counterparts and corresponding uncertainties are shown in Fig. 3. Only for B0656+14 does the position of the pulsar lie within the error circle. The 1σ positional error is computed as  , where rc is 1σ statistical uncertainty taken from Table 1 in Albert et al. (2020), and rs = 0.1° is the systematic pointing uncertainty.
Due to inhomogeneities in Galactic absorption, we do not provide analysis on a larger scale. Even on a scale of 1°, the background around the pulsars is highly inhomogeneous due to the presence of the nearby SNR Monogem Ring.
Overall, our study provides important insights into the magnetic field strength and spatial distribution around pulsars, contributing to a better understanding of the mechanisms underlying the formation of TeV halos.
Acknowledgements
A.K. acknowledges support from the International Max-Planck Research School on Astrophysics at the Ludwig-Maximilians University (IMPRS). A.K. thanks Martin G. F. Mayer for the helpful discussions and suggestions. G.P. acknowledges funding from the European Research Council (ERC) under the European Union's Horizon 2020 research and innovation programme (grant agreement No 865637) and from "Bando per il Finanzia-mento della Ricerca Fondamentale 2022 dell'Istituto Nazionale di Astrofisica (INAF): Canale: GO Large program". This work is based on data from eROSITA, the soft X-ray instrument aboard SRG, a joint Russian-German science mission supported by the Russian Space Agency (Roskosmos), in the interests of the Russian Academy of Sciences represented by its Space Research Institute (IKI), and the Deutsches Zentrum für Luft- und Raumfahrt (DLR). The SRG spacecraft was built by Lavochkin Association (NPOL) and its subcontractors, and is operated by NPOL with support from the Max Planck Institute for Extraterrestrial Physics (MPE). The development and construction of the eROSITA X-ray instrument was led by MPE, with contributions from the Dr. Karl Remeis Observatory Bamberg & ECAP (FAU Erlangen-Nuernberg), the University of Hamburg Observatory, the Leibniz Institute for Astrophysics Potsdam (AIP) and the Institute for Astronomy and Astrophysics of the University of Tübingen, with the support of DLR and the Max Planck Society. The Argelander Institute for Astronomy of the University of Bonn and the Ludwig Maximilians Universität Munich also participated in the science preparation for eROSITA. The eROSITA data shown here were processed using the eSASS software system developed by the German eROSITA consortium. This work makes use of the Astropy Python package (https://www.astropy.org/, Astropy Collaboration 2013, 2018, 2022). A particular mention goes to the indevelopment coordinated package of Astropy for region handling called Regions (https://github.com/astropy/regions). We also acknowledge the use of Python packages Matplotlib (Hunter 2007) and NumPy (Harris et al. 2020).
Appendix A eROSITA counts
eROSITA counts and effective areas for the regions around pulsars
Notes. Region C1 represents a circle of 0.5 degrees in radius centred around a specific pulsar, while C2 corresponds to a circle of 1 degree in radius. Regions 1-9 and 1-15 refer to the background regions indicated in Fig.2. The effective area is calculated by subtracting the area of excluded point sources from the total region area. For PSR B0540+23, counts are provided only for the 0.5 degree circle due to contamination from the bright Crab pulsar (see Fig.2c).
References
- Abeysekara, A. U., Albert, A., Alfaro, R., et. al. 2017, Science, 358, 911 [NASA ADS] [CrossRef] [Google Scholar]
- Aharonian, F., Akhperjanian, A. G., Bazer-Bachi, A. R., et. al. 2006, ApJ, 636, 777 [NASA ADS] [CrossRef] [Google Scholar]
- Aharonian, F., An, Q., Axikegu Bai, L. X., et. al. 2021, Phys. Rev. Lett., 126, 241103 [NASA ADS] [CrossRef] [Google Scholar]
- Albert, A., Alfaro, R., Alvarez, C., et. al. 2020, ApJ, 905, 76 [NASA ADS] [CrossRef] [Google Scholar]
- Astropy Collaboration (Robitaille, T. P., et al.) 2013, A & A, 558, A33 [NASA ADS] [CrossRef] [EDP Sciences] [Google Scholar]
- Astropy Collaboration (Price-Whelan, A. M., et al.) 2018, AJ, 156, 123 [Google Scholar]
- Astropy Collaboration (Price-Whelan, A. M., Lim, P. L., et. al. 2022, ApJ, 935, 167 [NASA ADS] [CrossRef] [Google Scholar]
- Brunner, H., Liu, T., Lamer, G., et. al. 2022, A & A, 661, A1 [NASA ADS] [CrossRef] [EDP Sciences] [Google Scholar]
- Camilloni, F., & Becker, W. 2023, A & A, 680, A83 [NASA ADS] [CrossRef] [EDP Sciences] [Google Scholar]
- Cao, Z., Aharonian, F., An, Q., et. al. 2023, arXiv e-prints [arXiv:2305.17030] [Google Scholar]
- Danilenko, A., Shternin, P., Karpova, A., Zyuzin, D., & Shibanov, Y. 2015, PASA, 32, e038 [NASA ADS] [CrossRef] [Google Scholar]
- Harris, C. R., Millman, K. J., van der Walt, S. J., et. al. 2020, Nature, 585, 357 [NASA ADS] [CrossRef] [Google Scholar]
- He, C., Ng, C. Y., & Kaspi, V. M. 2013, ApJ, 768, 64 [NASA ADS] [CrossRef] [Google Scholar]
- Hunter, J. D. 2007, Comput. Sci. Eng., 9, 90 [NASA ADS] [CrossRef] [Google Scholar]
- Jansson, R., & Farrar, G. R. 2012, ApJ, 761, L11 [NASA ADS] [CrossRef] [Google Scholar]
- Knies, J. R., Sasaki, M., Becker, W., et. al. 2023, A & A, submitted [Google Scholar]
- Li, B., Zhang, Y., Liu, T., Liu, R.-Y., & Wang, X.-Y. 2022, MNRAS, 513, 2884 [Google Scholar]
- Li, C.-M., Ge, C., & Liu, R.-Y. 2023, ApJ, 949, 90 [NASA ADS] [CrossRef] [Google Scholar]
- Liu, R.-Y., Ge, C., Sun, X.-N., & Wang, X.-Y. 2019a, ApJ, 875, 149 [NASA ADS] [CrossRef] [Google Scholar]
- Liu, R.-Y., Yan, H., & Zhang, H. 2019b, Phys. Rev. Lett., 123, 221103 [Google Scholar]
- Manchester, R. N., Hobbs, G. B., Teoh, A., & Hobbs, M. 2005, AJ, 129, 1993 [Google Scholar]
- Mori, K., Gotthelf, E. V., Dufour, F., et. al. 2014, ApJ, 793, 88 [NASA ADS] [CrossRef] [Google Scholar]
- Predehl, P., Andritschke, R., Arefiev, V., et. al. 2021, A & A, 647, A1 [NASA ADS] [CrossRef] [EDP Sciences] [Google Scholar]
- Schwope, A., Pires, A. M., Kurpas, J., et. al. 2022, A & A, 661, A41 [NASA ADS] [CrossRef] [EDP Sciences] [Google Scholar]
- Torii, K., Saito, Y., Nagase, F., et. al. 2001, ApJ, 551, L151 [NASA ADS] [CrossRef] [Google Scholar]
All Tables
X-ray count rates and flux upper limits (0.5–2.0 keV) along with magnetic field strength constraints.
All Figures
|
Fig. 1 Image of the Monogem Ring complex as seen in the eROSITA all-sky surveys eRASS:4 (cf. Knies et al. 2023). The supernova remnants IC443 and G189.6+03.3 (cf. Camilloni & Becker 2023) are visible in the upper right corner. Photons to produce the image were colour-coded according to their energy (red for energies 0.2–0.4 keV, green for 0.4–0.6 keV, blue for 0.6–1.2 keV). The green circles have a radius of 2° centred on the position of the pulsars PSR B0656+14, Geminga, PSR J0631+1036, and PSR J0633+0632. |
| In the text | |
|
Fig. 2 eROSITA X-ray images showing the regions surrounding the pulsars. (a)–(c): the RGB eROSITA X-ray images. Photons to produce the image were colour-coded according to their energy (red for energies 0.2–0.7 keV, green for 0.7–1.1 keV, blue for 1.1–8.0 keV). Point sources with a detection likelihood equal to or larger than 5σ were removed. Solid circles have radii 0.5° (white) and 1° (yellow) and are used as source regions. Dashed circles with radii 0.25° are used as background regions. (d) eROSITA X-ray image showing the region surrounding PSR J0633+0632. The blue circle indicates the Monoceros Nebula, which contributes to a higher background level in regions 5–9. |
| In the text | |
|
Fig. 3 eROSITA X-ray images showing the regions surrounding the pulsars. The white and blue circles and the square in panel c indicate the positions and uncertainties of the TeV sources from the 2HWC and 3HWC catalogues, respectively. The sizes of the circles correspond to the uncertainties of positions. The green dashed circles centred around the pulsars have a radius of 0.5°. (a) Geminga. (b) B0656+14. (c) J0633+0632. (d) B0540+23. |
| In the text | |
Current usage metrics show cumulative count of Article Views (full-text article views including HTML views, PDF and ePub downloads, according to the available data) and Abstracts Views on Vision4Press platform.
Data correspond to usage on the plateform after 2015. The current usage metrics is available 48-96 hours after online publication and is updated daily on week days.
Initial download of the metrics may take a while.