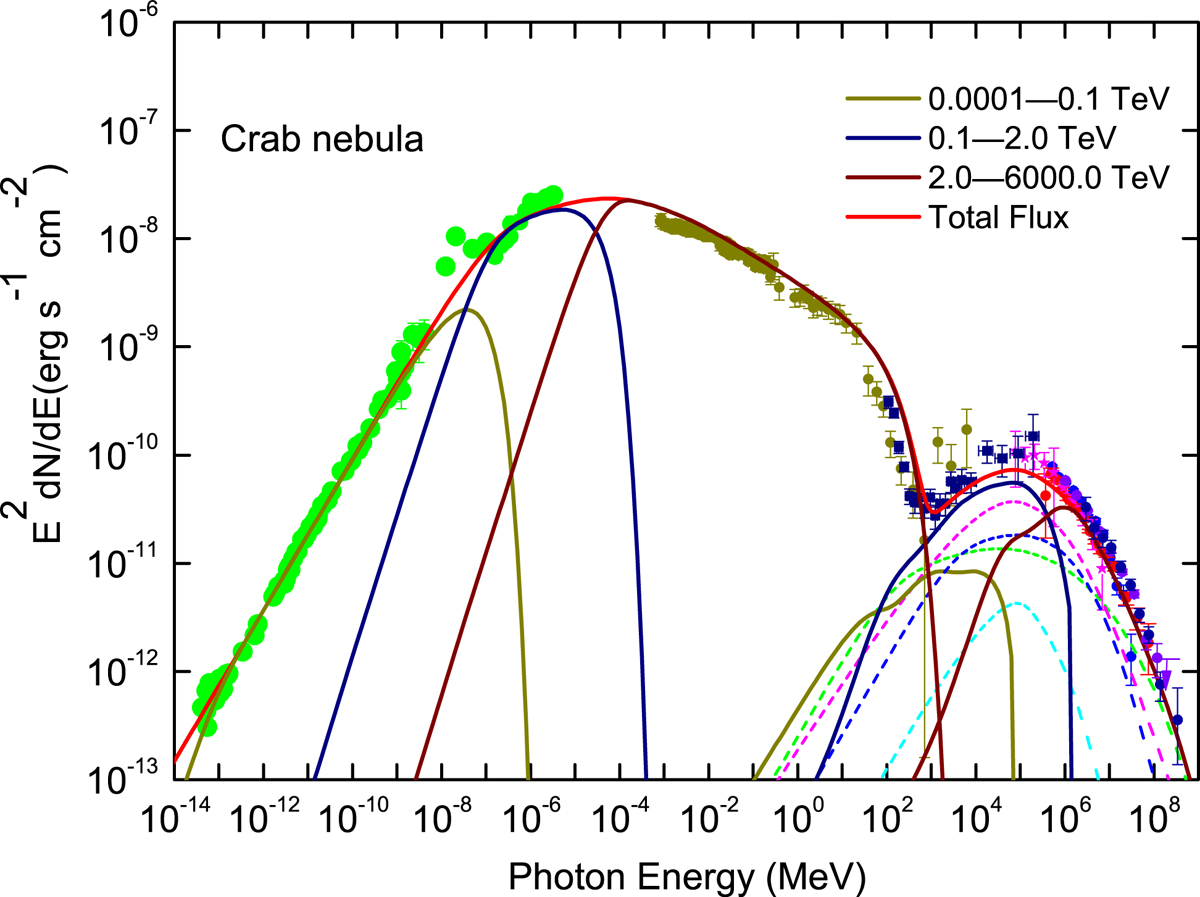
Fig. 4.
Download original image
Comparison of the calculated SED with the observed data for the Crab nebula. The calculated SEDs of synchrotron emission (dashed black line), inverse Compton scattering with synchrotron photons (dashed magenta line), IR (dashed blue line), the CMB (dashed green line), starlight (dashed cyan line), and the total emission (solid red line) are shown. The observed data are described in the text. To illustrate the contributions of electrons of different energy to the radiation, the solid dark yellow, navy, and red lines represent the contribution of the electrons in the different energy bands. The model parameters are listed in Table 1.
Current usage metrics show cumulative count of Article Views (full-text article views including HTML views, PDF and ePub downloads, according to the available data) and Abstracts Views on Vision4Press platform.
Data correspond to usage on the plateform after 2015. The current usage metrics is available 48-96 hours after online publication and is updated daily on week days.
Initial download of the metrics may take a while.