| Issue |
A&A
Volume 652, August 2021
|
|
|---|---|---|
| Article Number | A23 | |
| Number of page(s) | 13 | |
| Section | Extragalactic astronomy | |
| DOI | https://doi.org/10.1051/0004-6361/202039716 | |
| Published online | 04 August 2021 | |
Measuring chemical abundances with infrared nebular lines: HII-CHI-MISTRY-IR⋆
1
Istituto di Astrofisica e Planetologia Spaziali (INAF–IAPS), Via Fosso del Cavaliere 100, 00133 Roma, Italy
e-mail: This email address is being protected from spambots. You need JavaScript enabled to view it.
2
Instituto de Astrofísica de Andalucía (IAA-CSIC), Glorieta de la Astronomía s/n, 18008 Granada, Spain
e-mail: This email address is being protected from spambots. You need JavaScript enabled to view it.
3
Instituto de Investigación Multidisciplinar en Ciencia y Tecnología, Universidad de La Serena, Raúl Bitrán 1305, La Serena, Chile
4
Departamento de Astronomía, Universidad de La Serena, Av. Juan Cisternas 1200 Norte, La Serena, Chile
Received:
19
October
2020
Accepted:
15
March
2021
Abstract
We provide a new method for deriving heavy element abundances taking advantage of the unique suite of fine-structure lines in the mid- to far-infrared (IR) range. Using grids of photo-ionisation models that cover a wide range in O/H and N/O abundances and ionisation parameter, our code HII-CHI-MISTRY-IR (HCM-IR) provides model-based abundances based on extinction-free and temperature-insensitive tracers. These are two significant advantages over optical diagnostics when they are applied to dust-obscured regions or unresolved (stratified) nebulae, typical conditions found in high-z galaxies. The performance of the code is probed using three different samples of galaxies that extend over a wide range in metallicity, 7.2 ≲ 12 + log(O/H) ≲ 8.9, with available mid- to far-IR spectroscopic observations from Spitzer and Herschel, respectively. The samples correspond to 28 low-metallicity dwarf galaxies, 19 nearby starbursts, and 9 luminous IR galaxies. The IR model-based metallicities obtained are robust within a scatter of 0.03 dex when the hydrogen recombination lines, which are typically faint transitions in the IR range, are not available. When compared to the optical abundances obtained with the direct method, model-based methods, and strong-line calibrations, HCM-IR estimates show a typical dispersion of ∼ 0.2 dex. This is in line with previous studies comparing IR and optical abundances and does not introduce a noticeable systematic above 12 + log(O/H) ≳ 7.6. This accuracy can be achieved by measuring the sulphur ([S IV]10.5 μm and [S III]18.7, 33.5 μm) and the neon lines ([Ne III]15.6 μm and [Ne II]12.8 μm). Additionally, HCM-IR provides an independent N/O measurement when the oxygen ([O III]52, 88 μm) and nitrogen ([N III]57 μm) transitions are measured. The derived abundances in this case do not rely on particular assumptions on the N/O ratio. Large uncertainties (∼ 0.4 dex) may affect the abundance determinations of galaxies at sub- or over-solar metallicities when a solar-like N/O ratio is adopted. Finally, the code has been applied to 8 galaxies located at 1.8 < z < 7.5 with ground-based detections of far-IR lines redshifted in the submillimetre range, revealing solar-like N/O and O/H abundances in agreement with recent studies. A script to derive chemical abundances with HCM-IR has been made publicly available online.
Key words: ISM: abundances / galaxies: abundances / infrared: ISM / techniques: spectroscopic
Full Tables 1 and 3 are only available at the CDS via anonymous ftp to cdsarc.u-strasbg.fr (130.79.128.5) or via http://cdsarc.u-strasbg.fr/viz-bin/cat/J/A+A/652/A23
© ESO 2021
1. Introduction
Elements heavier than hydrogen and helium are known as metals and represent a very small fraction of the total baryon mass in the present Universe (∼0.02%; Madau & Dickinson 2014; Maiolino & Mannucci 2019). Nevertheless, they play a fundamental role in essentially every astrophysical environment, from the evolution of galaxies to the formation of stellar systems and planets and the emergence of life. Understanding these processes requires reliable diagnostics and robust tracers to measure the abundances of the different chemical elements.
The first witness of the chemical enrichment is the interstellar medium (ISM), to which heavy elements are returned at the end of the stellar evolution. Gas-phase metallicities in star-forming regions, planetary nebulae, and the ISM of galaxies are typically measured using nebular lines in their optical spectra (see Peimbert et al. 2017; Maiolino & Mannucci 2019 for reviews). The direct method provides accurate metallicities based on collisionally excited lines of heavy elements, whose emissivities are known once the density and temperature of the gas are determined (e.g., Izotov et al. 1994, 1997; Izotov & Thuan 1999; Kennicutt et al. 2003; Hägele et al. 2008). The latter is a critical step because it depends on the measurement of auroral lines (e.g., [O III] λ4363), associated with high-energy levels, which are typically faint at solar-like metallicities (Bresolin et al. 2005; Moustakas et al. 2010). When these are not available, the estimates rely on indirect methods (Fernández-Martín et al. 2017), based on ratios of strong nebular lines that are calibrated against determinations based on the direct method and/or photo-ionisation models (e.g., Pagel et al. 1979; McGaugh 1991; Pilyugin 2001; Pilyugin & Thuan 2005; Pérez-Montero & Díaz 2005). However, the systematic discrepancies among the different strong-line calibrations can be quite large (∼ 0.7 dex; Kewley & Ellison 2008), smearing out the results that are obtained when different line tracers are combined.
In the past 30 years, the infrared (IR) range has been exploited by various generations of IR spectroscopic observatories, from the Infrared Space Observatory (ISO, 2.4–197 μm; Kessler et al. 1996) to the Spitzer Space Telescope (5–39 μm; Werner et al. 2004) and the Herschel Space Observatory (51–671 μm; Pilbratt et al. 2010). This provided access to a unique suite of fine-structure lines that serve as diagnostics for a very wide range of physical conditions (Spinoglio & Malkan 1992). In particular, metallicity determinations based on IR lines provide major advantages with respect to the optical and UV estimates (e.g., Pottasch & Beintema 1999; Verma et al. 2003; Bernard-Salas et al. 2008; Croxall et al. 2013). First, the IR range is insensitive to the interstellar reddening, thus only IR tracers can probe the gas-phase elemental abundances in the ISM of dusty galaxies (Nagao et al. 2011; Pereira-Santaella et al. 2017; Herrera-Camus et al. 2018). This is particularly critical for studies at high-z, where ∼90% of the light emitted by star-forming galaxies is absorbed and reprocessed in the IR (Madau & Dickinson 2014; Santini et al. 2010; Rowlands et al. 2014), but also in the dusty regions of nearby galaxies where new stars are being formed. The latter provide the most recent estimate for the chemical age in these galaxies (Verma et al. 2003; Wu et al. 2008), including our own Galaxy (Carr et al. 2000; Inno et al. 2019). Generally, the nebular emission in galaxies tends to show significant extinction above star formation rates of ≳ 20 M⊙ yr−1 and the gas tends to be selectively affected over the continuum for sub-solar metallicities (12 + log(O/H) ≲ 8.5; Reddy et al. 2015; Shivaei et al. 2020). Second, the emissivity of IR lines shows a negligible dependence on the gas temperature because the atomic levels involved in the transitions are much closer to the ground state than optical and UV lines (e.g., Bernard Salas et al. 2001). In this regard, Fig. 1 shows that the emissivity of the [Ne II]12.8 μm and [Ne III]15.6 μm lines change by a factor ≲4 in the 1000 < Te < 100 000 K range (at ne = 100 cm−3; Luridiana et al. 2015). In contrast, the emissivity of the optical nebular lines varies by five orders of magnitude in the 2000 < Te < 30 000 K range. This implies that uncertainties in the temperature determination have a minor effect on the derived IR abundances, including temperature fluctuations in the nebula due to inhomogeneities in the density structure and/or the radiation field that are not spatially resolved in the observed spectra. This is known as the t2 or temperature problem, which may cause a systematic underestimation of the chemical abundances derived from optical lines using the direct method (Peimbert 1967), and leading to values lower by a factor of ∼4 (0.6 dex) than the IR abundance determinations (Vermeij & van der Hulst 2002; Dors et al. 2013). Furthermore, the electron temperature might vary among the various elements and ionic species (Garnett 1992), adding a differential effect on the emissivity of the nebular lines that will be stronger in the optical transitions than those in the IR. Additionally, the optical collisionally excited lines cannot detect the contribution from heavy elements in cold plasmas (∼ 1000 K; see Fig. 1), which is one of the possible causes of the abundance discrepancy factors (e.g., Liu et al. 2006; Tsamis et al. 2008).
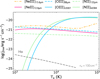 |
Fig. 1. Emissivity (jline) of the fine-structure lines in the optical range (solid blue line: [O III] λ5007; solid green: [N II] λ6584) is a strong function of the electron temperature Te in the 2000–30 000 K range, in contrast to the IR lines (solid pink: [Ne II]12.8 μm; dot-dashed orange: [Ne III]15.6 μm; dashed blue: [O III]88 μm; dashed green: [N II]122 μm). The emissivities are computed using PYNEB (Luridiana et al. 2015) for a fixed ne = 100 cm−3. For comparison, the emissivity of the Hα recombination line is also shown (dashed black line). |
In this work we extend the method developed in the HII-CHI-MISTRY code for the optical (Pérez-Montero 2014) and the UV lines (Pérez-Montero & Amorín 2017) to determine chemical abundances using the nebular lines in the mid- and far-IR spectral range. The IR line fluxes are compared with grids of photo-ionisation models covering a wide range in N/O and O/H abundances and ionisation parameter (log U). When applied to optical lines, HII-CHI-MISTRY avoids the offsets and systematics that typically affect the strong-line calibrations (Pérez-Montero 2014), providing abundance determinations that are consistent with the direct method with an average offset below 0.1 dex, that is, when the code estimates are compared to those based on a previous determination of Te. In Sect. 2 we present a spectral database of galaxies that are used as a case study to test the validity of the new IR-based method. These data include star-forming and luminous IR galaxies in the local Universe, and a sample of galaxies at high redshift where far-IR lines have been used to measure the chemical abundances. The IR method is described in detail in Sect. 3, including the main line ratios used to constrain the N/O and O/H abundances and log U. In Sect. 4 we present the main results obtained with the IR method, which are then discussed in Sect. 5. Finally, the main conclusions are summarised in Sect. 6.
2. Data
As a case study to test the validity of the abundances derived from IR nebular lines, we applied our new method to a sample of star-forming galaxies with spectroscopic observations in the mid- to far-IR range. The latter were acquired with the InfraRed Spectrograph (IRS; Houck et al. 2004) on board Spitzer and the Photodetector Array Camera and Spectrometer (PACS; Poglitsch et al. 2010) on board Herschel. A few detections of the [O III]52 μm and [N III]57 μm far-IR lines obtained with FIFI-LS (Fischer et al. 2018) on board the SOFIA airborne observatory (Temi et al. 2018) were also taken from Peng et al. (2021). The final sample includes 28 dwarf galaxies with sub-solar metallicities (Madden et al. 2013; Cormier et al. 2015), 19 active star-forming galaxies with solar-like metallicities (Fernández-Ontiveros et al. 2016), and 9 low-redshift luminous and ultra-luminous IR galaxies (LIRGs and ULIRGs, respectively) dominated by the star formation component (Pereira-Santaella et al. 2017; Fernández-Ontiveros et al. 2016). The active galactic nucleus (AGN) contribution in these (U)LIRGs is lower than 10%, according to their [Ne V]14.3 μm/[Ne II]12.8 μm measured ratios (Pereira-Santaella et al. 2017). In all cases we favoured the Spitzer/IRS high-spectral resolution mode (R ∼ 600) when available. Because hydrogen recombination line fluxes are not provided in these works, we completed our spectroscopic sample by measuring the H I (7-6) Humphreys-α line at 12.37 μm directly from the Spitzer calibrated and extracted spectra available in the CASSIS1 database (Lebouteiller et al. 2015). The line flux was obtained by integrating the continuum-subtracted spectrum, and then normalised to the [Ne II] 12.81 μm line flux reported in the literature. Additionally, we include flux measurements of the Brackett-α 4.05 μm line for three of the (U)LIRG galaxies provided by Imanishi et al. (2010) with AKARI/IRC. The compilation of the IR line fluxes for our sample of galaxies is provided in Table 1.
IR line fluxes for our sample of star-forming galaxies.
To compare the IR O/H derived abundances with the estimates based on the optical lines, we performed a comprehensive search in the literature to compile line fluxes in this range and/or abundance measurements (see Table 1). For cases with available line fluxes, the optical metallicities were obtained using the HII-CHI-ChI-MISTRY v4.1 code (Pérez-Montero 2014; Pérez-Montero et al. 2019), which relies on the same photo-ionisation models adopted here to derive the IR abundance estimates. The models are described in Sect. 3.
Finally, we compiled recent measurements for galaxies at high-z (z ≳ 4). These are sub-millimetre (sub-mm) and Lyα systems where strongly redshifted emission lines of [O III]52, 88 μm and [N II]122, 205 μm or [N III]57 μm have been detected using observations in the sub-mm range (Table 1). These results are relevant for chemical evolution studies, and therefore IR based abundances for O/H or N/O in these galaxies are provided in this work.
3. Model-based abundances
Chemical abundances from IR lines were calculated using an adapted version of the code HII-CHI-ChI-MISTRY, which we denote here HII-CHI-ChI-MISTRY-IR2 (hereinafter HCM and HCM-IR, respectively). Both HCM and HCM-IR are based on the same grid of photo-ionisation models. A detailed analysis of the model-based metalicities derived from the optical lines for 550 star-forming emission-line objects in the local Universe, compared to the measurements obtained with the direct method, show that HCM has a precision better than 0.1 dex and does not introduce offsets or systematics with respect to the direct-method determinations (Pérez-Montero 2014). In this section we describe the specific procedure for determining abundances using HCM-IR. We refer to Pérez-Montero (2014) for a comprehensive description of the models and the general method, however.
This code performs a Bayesian-like calculation of the total oxygen abundance, the nitrogen-to-oxygen abundance ratio, and the ionisation parameter by comparing a set of reddening-corrected emission-line fluxes with the predictions from a large grid of photo-ionisation models. For this version of the code we used the grid of models computed with CLOUDY v17.01 (Ferland et al. 2017), adopting the spectral energy distribution (SED) of simple stellar population models from POPSTAR (Mollá et al. 2009), also described in Pérez-Montero (2014). The grid covers a wide range in oxygen abundance, from 12 + log(O/H) = 6.9 to 9.1 in bins of 0.1 dex, in nitrogen abundance from log(N/O) = −2.0 to 0.0 in bins of 0.125 dex, and in ionisation parameter from log U = −4.0 to −1.5 in bins of 0.25 dex. This yields a total of 4 301 models, although the code also allows interpolating between the computed values to multiply the resolution of the grid by a factor 10 in each of the three explored dimensions. All models were calculated assuming a constant electron density of 100 particles per cm−3, a filling factor of 0.1, a standard dust-to-gas mass ratio, and a plane-parallel geometry. The calculations were stopped in each model when the density of free electrons in relation to hydrogen atoms was lower than 98%. All species, with the exception of N, were scaled to the solar proportions given by Asplund et al. (2009), and the metallicity of the stars were assumed to match that of the gas in each model.
As input, the HCM-IR code admits reddening-corrected fluxes in arbitrary units with their corresponding errors of the following emission lines: H I 4.05 μm (Brackett-α or Brα), H I 7.46 μm (Pfund-α or Pfα), [S IV] 10.5 μm, H I 12.37 μm (Humphreys-α or Huα), [Ne II] 12.8 μm, [Ne III] 15.6 μm, [S III] 18.7 μm, [S III] 33.5 μm, [O III] 52 μm, [N III] 57 μm, [O III] 88 μm, and [N II] 122 μm. We did not consider other fine-structure IR lines such as [C II] 157 μm or [O I] 63 μm, which can be partially emitted by the photo-dissociation region (PDR) and are not well reproduced by our models. If the errors are also introduced, the code can iterate by randomly perturbing the nominal value around the dispersion in a Monte Carlo simulation to produce realistic uncertainties for the derived chemical abundances and U. A significant advantage of this method is that the abundances can be derived even if one or several of the input lines are missing, based on a limited set of input emission lines. This is especially convenient to compare results for objects observed at different spectral ranges or at different redshifts or for lines whose measurement is not reliable.
The code calculates N/O, O/H, and log U as the weighted means of all the input values in all the models of the grid where the weights (1/χ2) are obtained as the quadratic sum of the difference between certain predicted and measured emission-line ratios that correlate with one or more of the searched properties.
Additionally, metallicities based on the intensities of optical emission lines were compiled from the literature when available, or were derived otherwise from published optical line fluxes (Table 3) using HCM v4.1, which is based on the same photo-ionisation models as HCM-IR. The lines typically used for the optical abundance determinations are [O II] λ3727, [Ne III] λ3869, [O III] λ4363, [O III] λ5007, [N II] λ6584, and [S II] λλ6716, 6731. Figures 2–6 show the comparison of the O/H and log U values derived from the optical lines against the different IR parameters for our sample of local star-forming galaxies (Table 1).
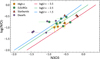 |
Fig. 2. Relation between the N3O3 parameter and the abundance ratio N/O for different models at a fixed 12 + log(O/H) = 8.9. The models are compared with the N/O abundances derived from the optical lines for a sample of local star-forming galaxies with IR spectroscopic observations, including dwarf galaxies (purple circles), nearby starbursts (red triangles), and local (U)LIRGs (green squares). Three galaxies at high-z with detected [N III] 57 μm and [O III] 52, 88 μm are also included (orange squares). |
3.1. N/O derivation
In a first iteration, the code calculates N/O taking advantage of the fact that this relative abundance is derived independently of the excitation of the gas. This is equivalent to the case of the optical emission lines, where certain emission-line ratios such as N2O2 or N2S2 do not show a dependence on U (Pérez-Montero & Contini 2009). In the case of the IR spectral range, a very similar situation is presented with [N III] and [O III] lines, defining the N3O3 parameter
![Mathematical equation: $$ \begin{aligned} \mathrm{N3O3} = \log \left( \frac{\mathrm{I}([{\text{ N}}{\small {{\text{ III}}}}]_{57\, \upmu \mathrm{m}})}{\mathrm{I}([{\text{ O}}{\small {{\text{ III}}}}]_{52\, \upmu \mathrm{m}}) + \mathrm{I} ([{\text{ O}}{\small {{\text{ III}}}}]_{88\, \upmu \mathrm{m}})} \right). \end{aligned} $$](/articles/aa/full_html/2021/08/aa39716-20/aa39716-20-eq1.gif) (1)
(1)
The latter has also been proposed by Nagao et al. (2011) and Pereira-Santaella et al. (2017) to provide a direct estimation of the total metallicity. As in the case of N2O2 in the optical (Kewley & Dopita 2002), this is based on the assumption that for oxygen abundances 12 + log(O/H) > 8.0, most of N has a secondary origin and thus N/O increases for increasing O/H. However, this assumption does not hold when hydro-dynamical processes (e.g., inflows or outflows; Edmunds 1990) or variations in the star formation efficiency (Mollá et al. 2006) take place. In this case the relative ratio of a secondary species to a primary one can therefore deviate from a closed box scenario, as in the so-called green-pea galaxies (Amorín et al. 2010).
As also suggested by Maiolino & Mannucci (2019), N3O3 presents a tight correlation with N/O, with very little dependence on U. This linear behaviour is shown in Fig. 2 for the model subgrid with a fixed 12 + log(O/H) = 8.9, and it is consistent with the observed trend in galaxies. We note that the N/O values shown in Fig. 2 for local star-forming galaxies are estimated using HCM from the optical line fluxes of these galaxies, and therefore are derived independently of the measured IR line ratio represented in the horizontal axis. Three galaxies at high-z with IR measurements are also included (orange squares), although the N/O values in these cases are derived with HCM-IR from the IR lines. We show in Fig. 2 some of the model sequences described above to illustrate the clear correlation between N3O3 and N/O and the weak dependence of this parameter on U. Overall, the N/O values derived from the optical lines for local star-forming galaxies are in agreement with the values of N3O3 measured from the IR lines for the expected range in U. An additional contribution to the dispersion not shown in Fig. 2 is the spread in metallicity because all the models we show correspond to 12 + log(O/H) = 8.9. The comparison between optical and IR estimates for the different diagnostics shown in this section are further discussed in Sect. 4.3.
3.2. O/H and U derivation
After N/O is derived, the code makes a second iteration within the uncertainties through the subgrid of models compatible with the adopted N/O solution. This ensures that nitrogen lines can be used to derive O/H without any specific assumption on the O/H–N/O relation. However, if N/O cannot be derived within the first iteration, the code assumes a certain relation between O/H and N/O. At low metalicities, that is, 12 + log(O/H) < 8.0, a constant N/O value is adopted because only the primary production of N is considered in star-forming galaxies. For higher metallicities, a linear relation between O/H and N/O is used, excluding models that do not follow this trend in the calculation.
In addition, as described in Pérez-Montero (2014), in absence of any auroral emission line such as [O III] λ4363 for the optical range, the code has to make additional assumptions on the relation between O/H and U in order to obtain results consistent with the Te method. In particular, because no auroral lines can be measured for our adapted version of HCM-IR, the code only considers in the calculations the models that follow the same relation between O/H and U, that was obtained empirically from the optical lines, as described in Pérez-Montero (2014), where objects with lower metallicity present a higher excitation. This also permits using emission-line ratios that are sensitive to excitation as tracers of the total chemical content in the gas.
The different emission-line ratios from the IR that the code uses include those depending on [Ne II] 12.8 μm and [Ne III] 15.6 μm, such as the Ne23 parameter. This is defined as
![Mathematical equation: $$ \begin{aligned} \mathrm{Ne}23 = \log \left( \frac{\mathrm{I}([{\text{ Ne}}{\small {{\text{ II}}}}]_{12.8\, \upmu \mathrm{m}}) + \mathrm{I}([{\text{ Ne}}{\small {{\text{ III}}}}]_{15.6 \,\upmu \mathrm{m}})}{\mathrm{I}(\mathrm{H_i})} \right), \end{aligned} $$](/articles/aa/full_html/2021/08/aa39716-20/aa39716-20-eq2.gif) (2)
(2)
where Hi represents any of the hydrogen recombination lines that can be measured in the mid-IR spectrum, specifically, Brα 4.05 μm, Pfα 7.46 μm, and Huα 12.37 μm are used in the code. In the left panel of Fig. 3 we present the relation between Ne23 and total oxygen abundance for several model sequences and the sample of objects. As in Fig. 2, the O/H values for the sample of galaxies were obtained from the optical emission lines using HCM, which are compared with the Ne23 parameter derived from the IR nebular lines. This relation is very tight and presents a very high value for the correlation coefficient ρ = 0.98, with a very low dependence on U that monotonically grows to over-solar metallicities. We can also provide a polynomial fit to the whole grid of models (black-dashed line in Fig. 3). This results in
 (3)
(3)
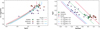 |
Fig. 3. Left: relation between the Ne23 parameter and the total oxygen abundance for the subset of models with log(N/O) = −0.625 dex. Right: relation between the Ne2Ne3 parameter and log U. O/H and log U shown in these figures for the local star-forming galaxies (purple circles: dwarf galaxies; red triangles: nearby starbursts; green squares: local LIRGs) are derived from the optical emission lines using HCM, and are compared with the IR parameters Ne23 and Ne2Ne3, respectively, that were measured in the IR spectra. A polynomial fit to the O/H values for the whole grid of models is also shown (dashed black line in the left panel; see Eq. (3)). |
where x = Ne23 is defined using the Huα 12.37 μm line. The standard deviation of the associated residuals is only 0.12 dex. Another combination of these lines used by the code to estimate both O/H and U through the space of models is Ne2Ne3, defined as
![Mathematical equation: $$ \begin{aligned} \mathrm{Ne2Ne3} = \log \left( \frac{\mathrm{I}([{\text{ Ne}}{\small {{\text{ II}}}}]_{12.8\, \upmu \mathrm{m}})}{\mathrm{I}([{\text{ Ne}}{\small {{\text{ III}}}}]_{15.6\, \upmu \mathrm{m}})} \right) ,\end{aligned} $$](/articles/aa/full_html/2021/08/aa39716-20/aa39716-20-eq4.gif) (4)
(4)
which is represented in the right panel of Fig. 3, also compared with the U values derived from the optical lines for the observed galaxies. An equivalent expression for this ratio was calibrated to derive U by Thornley et al. (2000) and Yeh & Matzner (2012), although Kewley et al. (2019) claimed that it also depends on O/H for high values of Z.
For the sulphur lines, the code uses as an observable the S34 parameter, which is defined as
![Mathematical equation: $$ \begin{aligned} \mathrm{S}34 = \log \left( \frac{\mathrm{I}([{\text{ S}}{\small {{\text{ III}}}}]_{18.7\, \upmu \mathrm{m}}) + \mathrm{I}([{\text{ S}}{\small {{\text{ III}}}}]_{33.5\, \upmu \mathrm{m}}) + \mathrm{I}([{\text{ S}}{\small {{\text{ IV}}}}]_{10.5\, \upmu \mathrm{m}})}{\mathrm{I(H_i)}} \right). \end{aligned} $$](/articles/aa/full_html/2021/08/aa39716-20/aa39716-20-eq5.gif) (5)
(5)
We show in the left panel of Fig. 4 the relation of this parameter with O/H for different sequences of models at different values of U. This dependence on the ionisation parameter U can be partially reduced by means of the S3S4 emission-line ratio. This is defined as
![Mathematical equation: $$ \begin{aligned} \mathrm{S3S4} = \log \left( \frac{\mathrm{I}([{\text{ S}}{\small {{\text{ III}}}}]_{18.7\, \upmu \mathrm{m}}) + \mathrm{I}([{\text{ S}}{\small {{\text{ III}}}}]_{33.5\, \upmu \mathrm{m}})}{\mathrm{I}([{\text{ S}}{\small {{\text{ IV}}}}]_{10.5 \,\upmu \mathrm{m}})} \right). \end{aligned} $$](/articles/aa/full_html/2021/08/aa39716-20/aa39716-20-eq6.gif) (6)
(6)
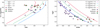 |
Fig. 4. Left: relation between the S34 parameter as calculated with H I 12.37 μm and the total oxygen abundance for the subset of models with log(N/O) = −0.625 dex. Right: relation between the S3S4 parameter and log U. O/H and log U derived with HCM for the optical lines in a sample of local star-forming galaxies are compared with the IR parameters S34 and S3S4, respectively (purple circles: dwarf galaxies; red triangles: nearby starbursts; green squares: local LIRGs). |
Its relation with U is also represented in the right panel of Fig. 4. A similar emission line ratio, although without the [S III] line at 33.5 μm, was proposed by Yeh & Matzner (2012) to trace the excitation in a way relatively independent of metallicity. The code is able to use these observables even if one of the two [S III] lines are absent, because the observables are defined as a function of the available observed information.
Finally, we also considered the code observables based on the nitrogen lines. This is the case of the N23 parameter, which is defined as
![Mathematical equation: $$ \begin{aligned} \mathrm{N}23 = \log \left( \frac{\mathrm{I}([{\text{ N}}{\small {{\text{ II}}}}]_{122 \,\upmu \mathrm{m}}) + \mathrm{I}([{\text{ N}}{\small {{\text{ III}}}}]_{57 \,\upmu \mathrm{m}})}{{\mathrm{I(H_i)}}} \right) ,\end{aligned} $$](/articles/aa/full_html/2021/08/aa39716-20/aa39716-20-eq7.gif) (7)
(7)
and is represented in the left panel of Fig. 5. Its dependence on N/O is reduced if a previous determination of N/O using N3O3 is possible. Regarding its dependence on U, it can be also minimised by means of the N2N3 parameter, which we can define as
![Mathematical equation: $$ \begin{aligned} \mathrm{N2N3} = \log \left( \frac{\mathrm{I}([{\text{ N}}{\small {{\text{ II}}}}]_{122 \,\upmu \mathrm{m}})}{\mathrm{I}([{\text{ N}}{\small {{\text{ III}}}}]_{57 \,\upmu \mathrm{m}})} \right). \end{aligned} $$](/articles/aa/full_html/2021/08/aa39716-20/aa39716-20-eq8.gif) (8)
(8)
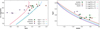 |
Fig. 5. Left: relation between the N23 parameter derived with H I 12.37 μm and the total oxygen abundance at a fixed N/O abundance of −0.625 dex. Right: relation between the N3N2 parameter and log U. O/H and log U derived with HCM for the optical lines in a sample of local star-forming galaxies are compared with the IR parameters N23 and N2N3, respectively (purple circles: dwarf galaxies; red triangles: nearby starbursts; green squares: local LIRGs). |
This ratio was also used by Nagao et al. (2011) and Kewley et al. (2019) as a tracer for U. Kewley and collaborators claimed that it is almost insensitive to O/H, as is also shown in Fig. 5 (right), although this can depend on gas pressure at high metallicities. We represent the relation of this parameter with log U in the right panel of Fig. 5.
Another observable based on nitrogen lines that can be useful for high-redshift objects observed in the sub-mm regime is O3N2. This is defined as
![Mathematical equation: $$ \begin{aligned} \mathrm{O3N2} = \log \left( \frac{\mathrm{I}([{\text{ O}}{\small {{\text{ III}}}}]_{88 \,\upmu \mathrm{m}})}{\mathrm{I}([{\text{ N}}{\small {{\text{ II}}}}]_{122 \,\upmu \mathrm{m}})} \right). \end{aligned} $$](/articles/aa/full_html/2021/08/aa39716-20/aa39716-20-eq9.gif) (9)
(9)
The relation between this ratio and the total oxygen abundance as derived from the models and from the optical lines is shown in Fig. 6. This relation is very similar to that observed between the O3N2 parameter defined using optical emission lines (Pettini & Pagel 2004), with an inverse relation with O/H for high metal contents, but a relatively flat behaviour for low values of O/H. At the same time, there is a strong dependence on U and N/O that can be reduced under certain hypotheses on the relation of these with O/H. Because of the similar critical densities of [O III]88 μm (510−3) and [N II]122 μm (310−3), the ratio of these lines is insensitive to the gas density.
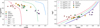 |
Fig. 6. Relation between the IR O3N2 parameter defined in this work and the total oxygen abundance (left panel) or log U (right panel) for the models at fixed log(N/O) = −0.625 dex. O/H and log U derived with HCM for the optical lines in our sample of local star-forming galaxies (purple circles: dwarf galaxies; red triangles: nearby starbursts; green squares: local LIRGs) and the sample of galaxies at high-z (orange squares) compiled for this work (see Table 1). |
The code will provide a solution when at least one of the above described emission-line ratios is available, but the accuracy and precision of the derived abundance ratios and log U depend on the number of line ratios used in the computation. To analyse the accuracy of the code in recovering these parameters when a reduced number of lines is available, we compared the known input model values with the code computations using different line combinations. The synthetic line fluxes we used are based on the same emission lines predicted by the models after applying a random 5% perturbation to simulate the typical observational uncertainties on the line fluxes. In Table 2 we provide the mean offset and the standard deviation for the ΔO/H, ΔN/O, and Δlog U residuals, obtained from the difference between the model input parameters and the estimated values using a restricted line set. This table can be also used as a reference to show which sets of lines lead to a solution when the complete set of valid emission lines is not available.
Mean offsets and standard deviation values for the ΔO/H, ΔN/O, and Δlog U residuals computed as the difference between the model input parameters and the resulting values derived with HCM-IR when a restricted set of emission lines, also predicted from the same POPSTAR models used as input, is used to calculate the abundance ratios and log U.
The results obtained for the different line combinations in Table 2 show minor offset deviations in the three parameters ΔO/H, ΔN/O, and Δlog U (≲ 0.04 dex). This is comparable to the typical line flux errors (∼10%), meaning that provided a line ratio that is sensitive to the ionisation parameter such as [Ne III]15.6 μm/[Ne II]12.8 μm, [S IV]10.5 μm/[S III]18.7, 33.5 μm or [N III]57 μm/[N II]122 μm, the code does not introduce any detectable systematics when the O/H and N/O relative abundances are derived using ionic species from different elements. The accuracy of the estimated abundances improves when the neon and/or the sulphur lines are available, as shown by the lower scatter measured in the corresponding line combinations in Table 2. However, including the [O III]52, 88 μm and [N III]57 μm lines is essential for providing an independent measurement of the N/O relative abundance, which is tightly constrained by this ratio given the similar ionisation potentials for the first ionisation stages of oxygen and nitrogen (e.g., Pereira-Santaella et al. 2017).
4. Results
In this section we use HCM-IR to derive chemical abundances based on fine-structure lines in the mid- to far-IR range for the three samples of star-forming galaxies described in Sect. 2. The values obtained are listed in Table 3. The systematics of the model-dependent abundances derived when the hydrogen recombination lines are not available are assessed by excluding the Huα and Brα lines from our abundance calculations in Sect. 4.1. When the nitrogen to oxygen line ratios necessary to estimate the relative N/O abundance are lacking, an additional uncertainty is introduced, as discussed in Sect. 4.2. Finally, these results are compared with the abundance ratios and log U values obtained from the optical emission lines in Sect. 4.3 to quantify the effect of dust obscuration and temperature for the different samples of galaxies.
HCM-IR abundances compared with optical line-based methods.
4.1. Dependence on hydrogen recombination lines
The weak dependence of IR nebular line emissivities on the gas temperature (Fig. 1) is one of the main arguments in favour of IR- over optical-based abundances tracers, but at the same time limits our ability to perform the same type of analysis described in Pérez-Montero (2014), who compared model-based abundances computed with HCM with those obtained using the direct method for the same set of optical emission lines. Comparing optical direct-method abundances with IR-based determinations is expected to introduce additional differences due to dust obscuration and temperature effects, the latter associated with the spatially unresolved temperature distribution and possible contributions from cold ionised gas components. Both obscuration and temperature affect the optical line fluxes and therefore the direct-method estimates (see Sect. 4.3).
Nevertheless, model-independent IR-based abundances can be derived when a hydrogen recombination line is measured. The main hydrogen recombination lines in the mid- to far-IR range are Brα at 4.05 μm, Pfα at 7.46 μm, and Huα at 12.37 μm. Brα is the brightest transition with ∼1/12th of the Hβ intensity (Case B, Te = 104 K, ne = 100 cm−3; Osterbrock & Ferland 2006; Luridiana et al. 2015), but this line is beyond the spectral range that is accessible to Spitzer in nearby galaxies, and thus Brα fluxes are only available for three sources in our sample observed by AKARI. Pfα (∼1/39th of Hβ) was observed by the IRS low-resolution module in Spitzer. Unfortunately, the line sits on the ridge of a strong PAH feature at 7.7 μm and a spectral resolution of R ∼ 50 is not enough to deblend the line contribution from the PAH. Thus, the most frequently observed recombination line in our sample is Huα, which is a relatively weak transition (1/102th of Hβ). It was detected in 29 out of 72 galaxies in our sample (40%), however.
Bearing in mind that hydrogen recombination lines are faint and hardly detected in the mid-IR range, we computed the IR abundances for our sample of galaxies including only the fine-structure lines to test the robustness of model-based abundances with HCM-IR. The comparison between the abundances obtained including the IR hydrogen recombination lines, (O/H)IR, and those based only on the fine-structure lines,  , for 26 galaxies are shown in Fig. 7 (left panel). The overall agreement is excellent, with a median difference of 0.00, a standard deviation of 0.03 dex, and only one galaxy showing 0.35 dex lower abundances when Huα was not included. The (O/H)IR values obtained using HCM-IR are virtually independent of the photo-ionisation models adopted when a hydrogen recombination line is measured because the abundances of the different ionic species relative to H are tightly constrained in this case (e.g., Bernard Salas et al. 2001; Wu et al. 2008; Bernard-Salas et al. 2009). Thus, Fig. 7 proves that metallicity determinations based on the mid-IR fine-structure lines alone are robust even in the absence of hydrogen recombination lines.
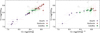 |
Fig. 7. Left: comparison of the O/H abundances obtained with HCM-IR including the hydrogen recombination lines, log(O/H)IR, with the values obtained when only the IR fine-structure lines are used in the analysis, |


4.2. Dependence on the N/O abundance
Measuring the [O III]52, 88 μm and [N III]57 μm lines is required to fix the relative N/O abundance in the photo-ionisation models. Otherwise, the code assumes a certain O/H–N/O relation (see Sect. 3.2). To test the robustness of our method, we removed both the nitrogen and the hydrogen recombination lines from the database and ran the code to determine a new set of abundances,  . In the right panel of Fig. 7 we compare the values obtained for the 16 galaxies in our sample with a detection of [N III]57 μm and at least one of the [O III]52, 88 μm lines. Both estimates are in agreement with a median difference of 0.18 dex in the abundances. For the dataset used in this work, the estimates that lack the nitrogen and hydrogen lines provide a broader range in metallicity. That is, assuming a local O/H–N/O relation tends to underestimate the dwarf galaxy metallicities by ∼0.3–0.4 dex except for one object, while those of solar-like starburst galaxies are overestimated by a similar factor. This is a caution on assuming a solar-like N/O ratio when chemical abundances are obtained using nitrogen-based tracers, for example as in the case of high-z galaxies because deviations from the solar values may likely introduce large systematics in the estimates. A similar situation is expected for carbon-based tracers.
4.3. IR versus optical abundances
To further assess the validity of the abundances derived with HCM-IR, we compared our results with those obtained from the optical lines using the direct method and the R and S strong-line calibrations from Pilyugin & Grebel (2016). The direct method relies on the temperature determination from the auroral lines and therefore provides the most reliable values in the optical range, while the two strong-line calibrations adopted are suitable for a wide range of metallicities and are consistent with the direct-method estimates within an average offset of ≲ 0.05 dex (Pilyugin & Grebel 2016). We note that the regions in which the IR and the optical nebular lines are formed in galaxies do not generally match because the IR emission also traces the obscured gas that is hidden by dust in the optical, while the optical line emission would be dominated by the hotter gas regions. Thus, an intrinsic scatter is always expected when optical and IR observables are compared, independently of the method adopted to derive the abundances.
In Fig. 8 and Tables 3–5 we compare the abundances obtained with HCM-IR with those derived from the optical lines using the direct method and the R and S strong-line calibrations. We note that direct-method abundances were only available for the sample of dwarf galaxies (Madden et al. 2013), in which the [O III] λ4363 auroral line is detected in sufficient numbers. Therefore the comparison between HCM-IR and the direct method (upper panels in Fig. 8) is limited to the dwarf galaxy sample. This should also mitigate the possible scatter due to dust obscuration, which is expected to be stronger in more metallic and dustier galaxies. For the strong-line calibrations (middle panels in Fig. 8), the comparison with HCM-IR could be extended to the starburst and (U)LIRG samples. To derive the optical-based abundances with HCM and the strong-line calibrations, we used the same line fluxes as were adopted by Madden et al. (2013) for the direct-method determinations.
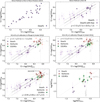 |
Fig. 8. Upper left: comparison between the direct-method abundances from Madden et al. (2013) and those obtained with HCM (Pérez-Montero 2014) using the same optical line flux measurements for the sample of dwarf galaxies (purple circles). Upper right: direct-method abundances against the values obtained with HCM-IR using the nebular lines in the IR range. Middle left: comparison of the optical strong-line estimates obtained with the R calibration from Pilyugin & Grebel (2016) and HCM-IR for dwarfs galaxies (purple circles), nearby starburst galaxies (red triangles), and local (U)LIRGs (green squares). Middle right: optical abundances obtained with the S calibration from Pilyugin & Grebel (2016) against the IR determinations with HCM-IR. Lower left: IR HCM-IR abundances compared to the optical abundances derived with HCM. Lower right: comparison of the N/O abundances obtained with HCM-IR and HCM using the IR and optical nebular lines, respectively, for the galaxies in our sample for which both estimates were possible. A linear regression fit between HCM-IR and the optical methods is represented by the solid black line and the associated 95% confidence interval (dotted black lines). In all cases the dashed grey line represents the bisector of the figure. Filled symbols correspond to galaxies for which the IR abundance was estimated using a hydrogen recombination line (mostly Huα), while for the galaxies with open symbols the abundances were obtained using the IR nebular lines alone. |
First of all, we compare the optical HCM and the direct-method abundances to show the accuracy of our model-based results using the same observables as in Madden et al. (2013). For the sample of dwarf galaxies, HCM is in excellent agreement with the direct method, showing a negligible offset of −0.02 dex and a standard deviation of 0.15 dex (upper left panel in Fig. 8). The overall consistency remains when the IR lines are used with HCM-IR, showing an offset of −0.08 dex with a larger scatter of 0.23 dex than for the direct method (upper right panel; see Table 4), mostly due to the apparent saturation of the IR estimates below one tenth of the solar metallicity (≲7.6). Above 7.6 the average offset decreases to −0.01 dex. Figure 8 also shows the linear regression fit in this range between the IR and the direct-method measurements (solid black line) with the associated 95% confidence interval (dotted black lines). Most of the values are consistent with the best-fit line within 2σ. A similar scatter between IR and optical abundances has recently been reported by Peng et al. (2021) from the N/O abundance measurements derived using the [N III]57 μm and [O III]52 μm lines compared to the optical estimates based on the [N II]λ6584 and [O II]λ3727 lines. The variations found in their study, up to 0.4 dex even for unobscured dwarf galaxies such as Haro 3, were ascribed to the gas stratification within the ISM of these galaxies because the IR lines are thought to probe a deeper and younger region as a result of their higher excitation conditions. This is also in line with the results from Polles et al. (2019) and Cormier et al. (2019) for the same dwarf galaxy sample as included in this work, where model-based estimates overpredict the Hα to [O III]88 μm ratio for nearly half of the sample. These results suggest that the different gas regions probed by IR and optical nebular lines may be a major source of dispersion when HCM-IR estimates are compared to the optical determinations. On the other hand, the higher IR estimates at low metallicities predicted by HCM-IR are likely caused by the large uncertainties that affect the empirical laws in this range, which are used to constrain the grid of photo-ionisation models in HCM-IR. A better observational characterisation of the IR spectrum in extremely low metallicity environments, which will be possible in the near future with the James Webb Space Telescope (Gardner et al. 2006), will definitely improve the empirical rules inside our code.
Mean offsets and standard deviation values for the samples of dwarf galaxies, starbursts and (U)LIRGs derived from the comparison (ΔO/H) between the IR abundances obtained with HCM-IR and the different optical-based methods, namely HCM, the direct method (DM), and the R and S strong-line calibrations from Pilyugin & Grebel (2016).
For the strong-line methods, the comparison could be extended to the whole sample of galaxies. The coloured filled symbols in Fig. 8 correspond to galaxies whose IR-based O/H abundances were derived using a hydrogen recombination line in the calculation, either Huα or Brα. This provides a more robust estimate. The R calibration in Pilyugin & Grebel (2016) shows an offset of −0.11 to +0.13 dex and a scatter of 0.22 dex with respect to HCM-IR (middle left panel in Fig. 8; Table 4). Above 12 + log(O/H) > 7.6 the maximum offset is seen at the highest metallicities for the sample of starburst galaxies, while the dwarf galaxies show a similar behaviour as in the previous case. A similar result was obtained for the S calibration (−0.12–0.13 dex offset, ≲ 0.24 dex standard deviation; middle right panel in Fig. 8), which also reveals the saturation of IR estimates at very low metallicities. As in the previous case, the best-fit line follows a slope close to unity, while most of the values are consistent within the 2σ interval.
A detailed comparison of HCM and HCM-IR allows us to further investigate the possible effect of dust obscuration and the temperature stratification effects on the optical estimates. The differences between the two methods are already shown by the Ne2Ne3 and S3S4 parameters in the right panels of Figs. 3–5. These IR-based parameters present a clear trend of increasing log U with decreasing optical-based O/H abundances in the star-forming galaxies, although the sulphur and nitrogen parameters appear to be slightly shifted towards lower and higher metallicities, respectively, when compared to the neon parameter. The O3N2 parameter in Fig. 6 depends on both U and the relative N/O abundance, although the dependence on the former saturates below 12 + log(O/H) ≲ 8.3–8.7. IR versus optical abundances derived with HCM are compared for the three samples of galaxies in the lower left panel of Fig. 8. Both methods show consistent results over the 12 + log(O/H) ∼ 7.6–8.9 range within an average offset of −0.03 dex and a standard deviation of ∼ 0.20 dex (a factor 1.6) around the bisector, indicated by the dashed grey line in the figure. These values are very similar to those found for the comparison with the strong-line calibrations (see Table 4), and are also in agreement with those obtained for the dwarf galaxy sample. In our sample, we do not find a significant systematic difference between the optical and IR metallicities as was previously reported by Herrera-Camus et al. (2018) using the N3O3 tracer from Nagao et al. (2011) for a ULIRG sample. The largest average offsets in our starburst and (U)LIRG samples against the Pilyugin & Grebel (2016) calibrations are still of the order of the overall scatter, and might be a consequence of the low statistics in those subsamples (∼10 objects). The individual abundance measurements for each galaxy using the different methods can be found in Table 3.
In Table 5 we present the average offset and scatter found between the abundances derived with HCM-IR using the different line combinations shown in Table 2 and the optical-based estimates. We note that the values for the direct method only correspond to the sample of dwarf galaxies. Because of the low number of galaxies with [N III]57 μm observations from Herschel/PACS (Fernández-Ontiveros et al. 2016), the statistics when this line is required are low (≲10), which increases the average offsets in some cases. Overall, when all the sulphur and neon lines are available, the average offset is typically ≲ 0.1 dex and the scatter is ∼ 0.2 dex with respect to any of the optical calibrations adopted here. Including one of the hydrogen recombination lines in the analysis tends to improve these values by slightly decreasing the scatter ≲ 0.16 dex. On the other hand, using only the two sulphur or the two neon lines to estimate the metallicity results in larger offsets (∼0.2–0.3 dex) and/or dispersion (∼ 0.25 dex) in all cases. Thus, O/H abundances are optimally derived with HCM-IR when all the sulphur and neon lines are detected, while including the significantly fainter hydrogen recombination lines results in a minor improvement in the scatter with regard to the optical calibrations.
Average offsets and standard deviation obtained for each galaxy subsample of size N where the chemical abundances could be compared (ΔO/H) between the various optical-based determinations and the HCM-IR estimates.
Nevertheless, the nitrogen and oxygen lines are still necessary to determine the N/O ratio. In the lower right panel of Fig. 8, we compare the N/O best-fit abundances obtained for the 16 galaxies where both IR and optical abundances were determined with HCM-IR and HCM. For 10 of them, the N/O abundances obtained are consistent within the errors, 3 lie still close to the bisector line (in grey), and the remaining 3 dwarf galaxies show 0.2–0.4 dex lower N/O abundances in the IR. This is in line with the results recently found by Peng et al. (2021). Still, this comparison suggests that the N/O abundances obtained using both methods based on the same photo-ionisation simulations but using a completely different set of lines are consistent for the majority of galaxies.
From the analysis performed in this section and considering the intrinsic differences between the optical and IR observables, we conclude that HCM-IR provides reliable O/H and N/O abundance estimates at metallicities above 12 + log(O/H) ≳ 7.6 with a negligible systematic offset above this limit (e.g., −0.01 dex against the direct method for the dwarf galaxies, in contrast to −0.08 dex for the whole sample), and a typical scatter of about ∼ 0.2 dex. This is a remarkable result considering that the strong-line calibrations by Pilyugin & Grebel (2016) show for the sample of dwarf galaxies used in this work a dispersion of ∼0.1–0.15 dex when compared to the results derived from the same observables using the direct method. Using the IR nebular lines, HCM-IR has demonstrated a slightly higher but comparable accuracy to these calibrations, with a scatter of 0.18 dex against the direct method when dwarf galaxies above 12 + log(O/H) ≳ 7.6 are considered.
5. Discussion
5.1. Dust obscuration
One of the main advantages of IR over optical diagnostics is their low response to dust extinction, which allows probing the chemical abundances including the dusty embedded star-forming regions that are hidden to optical wavelengths. Overall, the difference between IR and optical estimates in our sample of galaxies is small. This is expected in dwarf galaxies because their ISM is poor in heavy elements and dust. The median difference between IR and optical abundances above one tenth of the solar metallicity is indeed negligible (−0.01 dex). The scatter in the measurements is likely ascribed to dust obscuration and the different gas regions probed by IR and optical lines due to gas stratification (e.g., Dors et al. 2013; Cormier et al. 2019; Peng et al. 2021), and to the differences between the optical and IR slit apertures, which do not cover exactly the same area in most of these galaxies. In addition to the nebulae seen in the optical, the IR lines also probe the abundances in dust-embedded regions and the cold ionised gas component (∼ 1000 K) of the ISM, which are not traced by the optical nebular lines (see Fig. 1). On the other hand, the temperature dependence may enhance or lessen the contribution of spatially unresolved regions within galaxies to the optical line fluxes, increasing the scatter when optical and IR estimates are compared. Starburst galaxies show slightly higher IR abundances with a median difference of 0.06 dex above the optical values (Fig. 8, lower left panel), although the scatter is larger with a standard deviation of 0.2 dex, and therefore the difference is not significant. Still, this discrepancy can be important for individual galaxies. For instance, the IR metallicity in NGC 3198, 12 + log(O/H)IR = 8.96 ± 0.05 is a factor of two higher than the optical metallicity, 12 + log(O/H)opt = 8.65 ± 0.03 (see Fig. 8). This is likely caused by obscuration because NGC 3198 shows a bright IR nucleus that is not revealed in the UV and optical images (Gil de Paz et al. 2007; Brown et al. 2014; Kennicutt et al. 2011), while a relatively strong absorption is detected in the silicate band at 9.7 μm (Ssil = −1.9; Smith et al. 2007). Most of the starburst galaxies in our sample are not heavily absorbed. The obscuration in the nebular gas is expected to increase significantly above star formation rates of ≳ 20 M⊙ yr−1, however, especially at sub-solar metallicities, as has been observed in main-sequence galaxies at z ∼ 3 (Reddy et al. 2015; Shivaei et al. 2020).
A remarkable result is the similar oxygen abundance found with the optical and the IR methods for the sample of local (U)LIRGs. Both methods show sub-solar metallicities, with only slightly higher values in the IR (0.07 dex). (U)LIRGs are typically associated with significant amounts of dust. A difference between the IR and optical metallicities was therefore expected. This is not the case for the nine (U)LIRGs in our sample, as previously suggested by Pereira-Santaella et al. (2017) using a calibration of the N3O3 parameter. Our IR abundances are robust measurements because hydrogen recombination lines are detected for half of the (U)LIRG sample. This result suggests that the enriched gas in these local (U)LIRGs is well mixed within the ISM. This scenario may be supported by the merger-like morphology and interactions typically associated with these galaxies.
5.2. Comparison with N3O3-based tracers
Because of the twofold origin of nitrogen, which has a secondary production channel that increases with the overall metallicity, the N3O3 parameter has been proposed as a proxy of the oxygen abundance when a certain calibration of the N/O–O/H relation is assumed (Nagao et al. 2011). This diagnostic has been applied to the sample of (U)LIRGs analysed in this work by both Pereira-Santaella et al. (2017) and Herrera-Camus et al. (2018) with discrepant results. They obtained IR metallicities in the 0.7 ≲ Z/Z⊙ ≲ 1.5 and 1.5 ≲ Z/Z⊙ ≲ 2.5 ranges, respectively. This discrepancy is mainly caused by a different model calibration. For instance, adopting log(N/O)⊙ = −0.95 (Charlot & Longhetti 2001) results in log(N/O) ∼ −0.2 to 0 dex, which is a factor of 2 higher than the log(N/O)⊙ = −0.65 calibration Pilyugin et al. (2014). The N/O relative abundances derived with the former calibration are a factor 4 (0.6 dex) higher than our results for the same galaxies using HCM-IR. This is consistent with the N/O ratios derived with HCM using the optical line fluxes for seven (U)LIRGs in our sample (Fig. 8, lower right panel).
This result demonstrates the ability of HCM-IR of providing robust IR-based abundances without relying on a particular calibration of N/O with the overall metallicity. These calibrations can be significantly affected by several factors such as the star-forming efficiency, the IMF, and the particular history of gas accretion, star formation, and outflows in each galaxy (Mollá et al. 2006). These factors are typically not well constrained, and thus care must be taken when local calibrations are applied to galaxies with different star formation properties (e.g., Amorín et al. 2010).
5.3. Abundances in galaxies at high redshift
Redshifted far-IR emission lines have been used to probe the ISM of galaxies at high-z using ground-based telescopes in the sub-mm range (e.g., Maiolino et al. 2005). One of the most relevant aspects in this regard is the chemical composition of these galaxies, given the critical implications for our understanding of the build-up of heavy elements in the Universe predicted by current models of galaxy evolution (e.g., Torrey et al. 2019). So far, the most important metallicity diagnostics at high-z rely on the N3O3 (Eq. (1)) and O3N2 parameters (Eq. (9)), which are among the brightest nebular lines that can be observed from the ground. We have applied HCM-IR to a sample of eight sub-mm galaxies and Lyα systems at high redshift (1.8 ≲ z ≲ 7.5) with available measurements in the literature (Table 1). For three of these galaxies, the N3O3 parameter provides a measure of the N/O abundance (log(N/O) = −0.8 to −1.0 dex), which is in agreement with the values found in local star-forming galaxies (Fig. 2). For the remaining five galaxies, the [N III]57 μm line was not observed, therefore the O3N2 parameter was used to estimate the oxygen abundance. All the galaxies show solar-like values (8.6 ≲ 12 + log(O/H) ≲ 9.0; orange squares in Fig. 6), in agreement with previous works (Ferkinhoff et al. 2011, 2015; Uzgil et al. 2016; Rigopoulou et al. 2018; Tadaki et al. 2019; De Breuck et al. 2019; Novak et al. 2019). This suggests that a highly enriched ISM was already present in massive galaxies at high-z. Nevertheless, a measurement of the [N III]57 μm line for these galaxies is still necessary to avoid the uncertainties introduced when solar-like N/O ratios are adopted.
Current and future ALMA programmes dedicated to observing the rest-frame IR spectrum of high-z galaxies will soon increase the number of nebular line detections. This will allow us to provide independent N/O abundances and metalicities for these galaxies using HCM-IR.
6. Summary
We presented HII-CHI-MISTRY-IR (HCM-IR), a new method for deriving metallicities from nebular IR lines in star-forming environments. The main advantages of nebular lines in the mid- to far-IR range are their weak response to gas temperature and the negligible effect of dust extinction, which seriously affect the optical line intensities. The chemical abundances in the gas-phase are determined by applying Bayesian techniques on a grid of photo-ionisation models that cover a wide range in O/H, N/O, and U, using known empirical laws for the O/H abundance and the ionisation parameter (U) as priors to constrain the grid of models.
The code capabilities were probed using three different galaxy samples: low-metallicity dwarf galaxies, nearby starbursts, and luminous IR galaxies in the local Universe. HCM-IR provides robust IR-based abundances even in the absence of hydrogen recombination lines, with minor variations (0.03 dex) within the uncertainty range. When compared with different optical-based determinations using the direct method, photo-ionisation models, and two strong-line calibrations, HCM-IR estimates show a typical scatter of ∼ 0.2 dex and do not present systematic differences in the 7.6 < 12 + log(O/H) < 8.9 range. This accuracy is reached using only the sulphur and neon lines in the mid-IR, although independent N/O determinations rely on the oxygen and nitrogen lines in the far-IR. These values are slightly higher than but comparable to the typical offset and dispersion that affect optical strong-line calibration estimates when compared to the direct method for the sample of dwarf galaxies. When we bear in mind that optical and IR line-emitting regions would likely differ in galaxies because of dust extinction and temperature stratification in the unresolved ISM gas, these results support our claim that HCM-IR is a promising new method for exploiting the potential of IR spectroscopy with the aim to determine chemical abundances. We confirm that obscuration is one of the factors that contributes to the scatter between the IR and optical abundances, as shown by the case of NGC 3198. Below 12 + log(O/H) < 7.6, HCM-IR abundances tend to saturate because of the large uncertainties that affect the empirical laws in this range and that are used to link O/H and U and constrain the model grid. Additionally, an important aspect is the independent measurement of the N/O relative abundance that can be obtained when the oxygen and nitrogen lines are detected. The oxygen abundances determined in this case do not rely on the uncertain calibration of this ratio, which may seriously affect (∼ 0.4 dex) the metallicity estimates when solar-like N/O ratios are adopted.
We applied HCM-IR to a sample of eight high-z galaxies using nebular far-IR lines redshifted in the sub-millimetre range. The oxygen solar-like abundances obtained for these galaxies, which lie in the 8.6 ≲ 12 + log(O/H) ≲ 9.0 range, are in agreement with previous studies. Independent N/O measurements based on the N3O3 parameter are necessary to confirm these values, however.
Nebular IR transitions offer unique diagnostics, independent of temperature and extinction, to measure the abundances of heavy elements in an homogeneous way over a broad range of environments and physical conditions. The same tracers can be used from dusty regions in the centre of nearby galaxies to low-metallicity galaxies at high-z. IR metallicity tracers can currently be applied to galactic regions and bright galaxies using the SOFIA airborne observatory, and at very high-z when some of these transitions are redshifted into the range that is accessible to ground-based sub-mm telescopes (ALMA, APEX, and CSO). Nevertheless, these tools will mainly be exploited in the future by the new generation of space IR observatories, such as the James Webb Space Telescope (Gardner et al. 2006) in the local Universe. A preliminary research of the exploitation of chemical abundance tracers to study the galaxy evolution discussing possible observational strategies for a future mid- to far-IR spectroscopic observatory (SPICA; Roelfsema et al. 2018) was presented in Fernández-Ontiveros et al. (2017).
Combined Atlas of Sources with Spitzer IRS Spectra: https://cassis.sirtf.com
All versions of the HII-CHI-ChI-MISTRY code are publicly available at: http://www.iaa.csic.es/~epm/HII-CHI-mistry.html
Acknowledgments
The authors thank the reviewer for his/her comment and suggestions to improve the manuscript. J. A. F. O. and L. S. acknowledge financial support by the Agenzia Spaziale Italiana (ASI) under the research contract 2018-31-HH.0. We acknowledge financial support from the State Agency for Research of the Spanish MCIU through the “Center of Excellence Severo Ochoa” award to the Instituto de Astrofísica de Andalucía (SEV-2017-0709). This work has been partly funded by projects “Estallidos6” AYA2016-79724-C4 (Spanish Ministerio de Economía y Competitividad), “Estallidos7” PID2019-107408GB-C44 (Spanish Ministerio de Ciencia e Innovación), and from the Junta de Andalucía Excellence project EXC/2011 FQM-7058. R. A. acknowledges support from ANID FONDECYT Regular Grant 1202007. E. P. M. also acknowledges the assistance from his guide dog Rocko without whose daily help this work would have been much more difficult.
References
- Amorín, R. O., Pérez-Montero, E., & Vílchez, J. M. 2010, ApJ, 715, L128 [NASA ADS] [CrossRef] [Google Scholar]
- Asplund, M., Grevesse, N., Sauval, A. J., & Scott, P. 2009, ARA&A, 47, 481 [NASA ADS] [CrossRef] [Google Scholar]
- Bernard Salas, J., Pottasch, S. R., Beintema, D. A., & Wesselius, P. R. 2001, A&A, 367, 949 [NASA ADS] [CrossRef] [EDP Sciences] [Google Scholar]
- Bernard-Salas, J., Pottasch, S. R., Gutenkunst, S., Morris, P. W., & Houck, J. R. 2008, ApJ, 672, 274 [NASA ADS] [CrossRef] [Google Scholar]
- Bernard-Salas, J., Spoon, H. W. W., Charmandaris, V., et al. 2009, ApJS, 184, 230 [Google Scholar]
- Bresolin, F., Schaerer, D., González Delgado, R. M., & Stasińska, G. 2005, A&A, 441, 981 [NASA ADS] [CrossRef] [EDP Sciences] [Google Scholar]
- Brown, M. J. I., Moustakas, J., Smith, J. D. T., et al. 2014, ApJS, 212, 18 [Google Scholar]
- Carr, J. S., Sellgren, K., & Balachandran, S. C. 2000, ApJ, 530, 307 [NASA ADS] [CrossRef] [Google Scholar]
- Charlot, S., & Longhetti, M. 2001, MNRAS, 323, 887 [NASA ADS] [CrossRef] [Google Scholar]
- Cormier, D., Madden, S. C., Lebouteiller, V., et al. 2015, A&A, 578, A53 [NASA ADS] [CrossRef] [EDP Sciences] [Google Scholar]
- Cormier, D., Abel, N. P., Hony, S., et al. 2019, A&A, 626, A23 [NASA ADS] [CrossRef] [EDP Sciences] [Google Scholar]
- Croxall, K. V., Smith, J. D., Brandl, B. R., et al. 2013, ApJ, 777, 96 [Google Scholar]
- De Breuck, C., Weiß, A., Béthermin, M., et al. 2019, A&A, 631, A167 [NASA ADS] [CrossRef] [EDP Sciences] [Google Scholar]
- Dors, O. L., Hägele, G. F., Cardaci, M. V., et al. 2013, MNRAS, 432, 2512 [NASA ADS] [CrossRef] [Google Scholar]
- Edmunds, M. G. 1990, MNRAS, 246, 678 [NASA ADS] [Google Scholar]
- Ferkinhoff, C., Brisbin, D., Nikola, T., et al. 2011, ApJ, 740, L29 [NASA ADS] [CrossRef] [Google Scholar]
- Ferkinhoff, C., Brisbin, D., Nikola, T., et al. 2015, ApJ, 806, 260 [NASA ADS] [CrossRef] [Google Scholar]
- Ferland, G. J., Chatzikos, M., Guzmán, F., et al. 2017, Rev. Mex. Astron. Astrofis., 53, 385 [NASA ADS] [Google Scholar]
- Fernández-Martín, A., Pérez-Montero, E., Vílchez, J. M., & Mampaso, A. 2017, A&A, 597, A84 [NASA ADS] [CrossRef] [EDP Sciences] [Google Scholar]
- Fernández-Ontiveros, J. A., Spinoglio, L., Pereira-Santaella, M., et al. 2016, ApJS, 226, 19 [NASA ADS] [CrossRef] [Google Scholar]
- Fernández-Ontiveros, J. A., Armus, L., Baes, M., et al. 2017, PASA, 34 [CrossRef] [Google Scholar]
- Fischer, C., Beckmann, S., Bryant, A., et al. 2018, J. Astron. Instrum., 7, 1840003 [CrossRef] [Google Scholar]
- Gardner, J. P., Mather, J. C., Clampin, M., et al. 2006, Space Sci. Rev., 123, 485 [Google Scholar]
- Garnett, D. R. 1992, AJ, 103, 1330 [NASA ADS] [CrossRef] [Google Scholar]
- Gil de Paz, A., Boissier, S., Madore, B. F., et al. 2007, ApJS, 173, 185 [Google Scholar]
- Goulding, A. D., & Alexander, D. M. 2009, MNRAS, 398, 1165 [NASA ADS] [CrossRef] [Google Scholar]
- Hägele, G. F., Díaz, Á. I., Terlevich, E., et al. 2008, MNRAS, 383, 209 [NASA ADS] [CrossRef] [Google Scholar]
- Herrera-Camus, R., Sturm, E., Graciá-Carpio, J., et al. 2018, ApJ, 861, 95 [Google Scholar]
- Houck, J. R., Roellig, T. L., van Cleve, J., et al. 2004, ApJS, 154, 18 [NASA ADS] [CrossRef] [Google Scholar]
- Imanishi, M., Nakagawa, T., Shirahata, M., Ohyama, Y., & Onaka, T. 2010, ApJ, 721, 1233 [NASA ADS] [CrossRef] [Google Scholar]
- Inno, L., Urbaneja, M. A., Matsunaga, N., et al. 2019, MNRAS, 482, 83 [Google Scholar]
- Izotov, Y. I., & Thuan, T. X. 1999, ApJ, 511, 639 [NASA ADS] [CrossRef] [Google Scholar]
- Izotov, Y. I., Thuan, T. X., & Lipovetsky, V. A. 1994, ApJ, 435, 647 [NASA ADS] [CrossRef] [Google Scholar]
- Izotov, Y. I., Thuan, T. X., & Lipovetsky, V. A. 1997, ApJS, 108, 1 [NASA ADS] [CrossRef] [Google Scholar]
- Kennicutt, R. C., Jr, Bresolin, F., & Garnett, D. R. 2003, ApJ, 591, 801 [CrossRef] [Google Scholar]
- Kennicutt, R. C., Calzetti, D., Aniano, G., et al. 2011, PASP, 123, 1347 [Google Scholar]
- Kessler, M. F., Steinz, J. A., Anderegg, M. E., et al. 1996, A&A, 500, 493 [Google Scholar]
- Kewley, L. J., & Dopita, M. A. 2002, ApJS, 142, 35 [Google Scholar]
- Kewley, L. J., & Ellison, S. L. 2008, ApJ, 681, 1183 [Google Scholar]
- Kewley, L. J., Nicholls, D. C., & Sutherland, R. S. 2019, ARA&A, 57, 511 [Google Scholar]
- Lebouteiller, V., Barry, D. J., Goes, C., et al. 2015, ApJS, 218, 21 [NASA ADS] [CrossRef] [Google Scholar]
- Liu, X. W., Barlow, M. J., Zhang, Y., Bastin, R. J., & Storey, P. J. 2006, MNRAS, 368, 1959 [NASA ADS] [CrossRef] [Google Scholar]
- Luridiana, V., Morisset, C., & Shaw, R. A. 2015, A&A, 573, A42 [NASA ADS] [CrossRef] [EDP Sciences] [Google Scholar]
- Madau, P., & Dickinson, M. 2014, ARA&A, 52, 415 [NASA ADS] [CrossRef] [Google Scholar]
- Madden, S. C., Rémy-Ruyer, A., Galametz, M., et al. 2013, PASP, 125, 600 [NASA ADS] [CrossRef] [Google Scholar]
- Maiolino, R., & Mannucci, F. 2019, A&ARv, 27, 3 [NASA ADS] [CrossRef] [Google Scholar]
- Maiolino, R., Cox, P., Caselli, P., et al. 2005, A&A, 440, L51 [NASA ADS] [CrossRef] [EDP Sciences] [Google Scholar]
- McGaugh, S. S. 1991, ApJ, 380, 140 [NASA ADS] [CrossRef] [Google Scholar]
- Mollá, M., Vílchez, J. M., Gavilán, M., & Díaz, A. I. 2006, MNRAS, 372, 1069 [NASA ADS] [CrossRef] [Google Scholar]
- Mollá, M., García-Vargas, M. L., & Bressan, A. 2009, MNRAS, 398, 451 [NASA ADS] [CrossRef] [Google Scholar]
- Moustakas, J., Kennicutt, R. C., Jr, Tremonti, C. A., et al. 2010, ApJS, 190, 233 [NASA ADS] [CrossRef] [Google Scholar]
- Nagao, T., Maiolino, R., Marconi, A., & Matsuhara, H. 2011, A&A, 526, A149 [NASA ADS] [CrossRef] [EDP Sciences] [Google Scholar]
- Novak, M., Bañados, E., Decarli, R., et al. 2019, ApJ, 881, 63 [NASA ADS] [CrossRef] [Google Scholar]
- Osterbrock, D. E., & Ferland, G. J. 2006, Astrophysics of Gaseous Nebulae and Active Galactic Nuclei (University Science Books) [Google Scholar]
- Pagel, B. E. J., Edmunds, M. G., Blackwell, D. E., Chun, M. S., & Smith, G. 1979, MNRAS, 189, 95 [NASA ADS] [CrossRef] [Google Scholar]
- Peimbert, M. 1967, ApJ, 150, 825 [NASA ADS] [CrossRef] [Google Scholar]
- Peimbert, M., Peimbert, A., & Delgado-Inglada, G. 2017, PASP, 129, 082001 [NASA ADS] [CrossRef] [Google Scholar]
- Peng, B., Lamarche, C., Stacey, G. J., et al. 2021, ApJ, 908, 166 [CrossRef] [Google Scholar]
- Pereira-Santaella, M., Rigopoulou, D., Farrah, D., Lebouteiller, V., & Li, J. 2017, MNRAS, 470, 1218 [NASA ADS] [CrossRef] [Google Scholar]
- Pérez-Montero, E. 2014, MNRAS, 441, 2663 [NASA ADS] [CrossRef] [Google Scholar]
- Pérez-Montero, E., & Díaz, A. I. 2005, MNRAS, 361, 1063 [NASA ADS] [CrossRef] [Google Scholar]
- Pérez-Montero, E., & Contini, T. 2009, MNRAS, 398, 949 [NASA ADS] [CrossRef] [Google Scholar]
- Pérez-Montero, E., & Amorín, R. 2017, MNRAS, 467, 1287 [Google Scholar]
- Pérez-Montero, E., Dors, O. L., Vílchez, J. M., et al. 2019, MNRAS, 489, 2652 [CrossRef] [Google Scholar]
- Petrosian, A. R., & Burenkov, A. N. 1993, A&A, 279, 21 [NASA ADS] [Google Scholar]
- Pettini, M., & Pagel, B. E. J. 2004, MNRAS, 348, L59 [NASA ADS] [CrossRef] [Google Scholar]
- Pilbratt, G. L., Riedinger, J. R., Passvogel, T., et al. 2010, A&A, 518, L1 [CrossRef] [EDP Sciences] [Google Scholar]
- Pilyugin, L. S. 2001, A&A, 369, 594 [NASA ADS] [CrossRef] [EDP Sciences] [Google Scholar]
- Pilyugin, L. S., & Thuan, T. X. 2005, ApJ, 631, 231 [NASA ADS] [CrossRef] [MathSciNet] [Google Scholar]
- Pilyugin, L. S., & Grebel, E. K. 2016, MNRAS, 457, 3678 [NASA ADS] [CrossRef] [Google Scholar]
- Pilyugin, L. S., Grebel, E. K., Zinchenko, I. A., & Kniazev, A. Y. 2014, AJ, 148, 134 [NASA ADS] [CrossRef] [Google Scholar]
- Poglitsch, A., Waelkens, C., Geis, N., et al. 2010, A&A, 518, L2 [NASA ADS] [CrossRef] [EDP Sciences] [Google Scholar]
- Polles, F. L., Madden, S. C., Lebouteiller, V., et al. 2019, A&A, 622, A119 [NASA ADS] [CrossRef] [EDP Sciences] [Google Scholar]
- Pottasch, S. R., & Beintema, D. A. 1999, A&A, 347, 975 [Google Scholar]
- Reddy, N. A., Kriek, M., Shapley, A. E., et al. 2015, ApJ, 806, 259 [NASA ADS] [CrossRef] [Google Scholar]
- Rigopoulou, D., Pereira-Santaella, M., Magdis, G. E., et al. 2018, MNRAS, 473, 20 [NASA ADS] [CrossRef] [Google Scholar]
- Roelfsema, P. R., Shibai, H., Armus, L., et al. 2018, PASA, 35 [CrossRef] [Google Scholar]
- Rowlands, K., Gomez, H. L., Dunne, L., et al. 2014, MNRAS, 441, 1040 [Google Scholar]
- Santini, P., Maiolino, R., Magnelli, B., et al. 2010, A&A, 518, L154 [NASA ADS] [CrossRef] [EDP Sciences] [Google Scholar]
- Shivaei, I., Reddy, N., Rieke, G., et al. 2020, ApJ, 899, 117 [CrossRef] [Google Scholar]
- Smith, J. D. T., Draine, B. T., Dale, D. A., et al. 2007, ApJ, 656, 770 [Google Scholar]
- Spinoglio, L., & Malkan, M. A. 1992, ApJ, 399, 504 [CrossRef] [Google Scholar]
- Tadaki, K.-I., Iono, D., Hatsukade, B., et al. 2019, ApJ, 876, 1 [NASA ADS] [CrossRef] [Google Scholar]
- Temi, P., Hoffman, D., Ennico, K., & Le, J. 2018, J. Astron. Instrum., 7, 1840011 [CrossRef] [Google Scholar]
- Thornley, M. D., Schreiber, N. M. F., Lutz, D., et al. 2000, ApJ, 539, 641 [NASA ADS] [CrossRef] [Google Scholar]
- Torrey, P., Vogelsberger, M., Marinacci, F., et al. 2019, MNRAS, 484, 5587 [NASA ADS] [Google Scholar]
- Tsamis, Y. G., Walsh, J. R., Péquignot, D., et al. 2008, MNRAS, 386, 22 [NASA ADS] [CrossRef] [Google Scholar]
- Uzgil, B. D., Bradford, C. M., Hailey-Dunsheath, S., Maloney, P. R., & Aguirre, J. E. 2016, ApJ, 832, 209 [NASA ADS] [CrossRef] [Google Scholar]
- Veilleux, S., Rupke, D. S. N., Kim, D. C., et al. 2009, ApJS, 182, 628 [NASA ADS] [CrossRef] [Google Scholar]
- Verma, A., Lutz, D., Sturm, E., et al. 2003, A&A, 403, 829 [NASA ADS] [CrossRef] [EDP Sciences] [Google Scholar]
- Vermeij, R., & van der Hulst, J. M. 2002, A&A, 391, 1081 [NASA ADS] [CrossRef] [EDP Sciences] [Google Scholar]
- Werner, M. W., Roellig, T. L., Low, F. J., et al. 2004, ApJS, 154, 1 [NASA ADS] [CrossRef] [Google Scholar]
- Wu, Y., Bernard-Salas, J., Charmandaris, V., et al. 2008, ApJ, 673, 193 [NASA ADS] [CrossRef] [Google Scholar]
- Yeh, S. C. C., & Matzner, C. D. 2012, ApJ, 757, 108 [CrossRef] [Google Scholar]
All Tables
Mean offsets and standard deviation values for the ΔO/H, ΔN/O, and Δlog U residuals computed as the difference between the model input parameters and the resulting values derived with HCM-IR when a restricted set of emission lines, also predicted from the same POPSTAR models used as input, is used to calculate the abundance ratios and log U.
Mean offsets and standard deviation values for the samples of dwarf galaxies, starbursts and (U)LIRGs derived from the comparison (ΔO/H) between the IR abundances obtained with HCM-IR and the different optical-based methods, namely HCM, the direct method (DM), and the R and S strong-line calibrations from Pilyugin & Grebel (2016).
Average offsets and standard deviation obtained for each galaxy subsample of size N where the chemical abundances could be compared (ΔO/H) between the various optical-based determinations and the HCM-IR estimates.
All Figures
|
Fig. 1. Emissivity (jline) of the fine-structure lines in the optical range (solid blue line: [O III] λ5007; solid green: [N II] λ6584) is a strong function of the electron temperature Te in the 2000–30 000 K range, in contrast to the IR lines (solid pink: [Ne II]12.8 μm; dot-dashed orange: [Ne III]15.6 μm; dashed blue: [O III]88 μm; dashed green: [N II]122 μm). The emissivities are computed using PYNEB (Luridiana et al. 2015) for a fixed ne = 100 cm−3. For comparison, the emissivity of the Hα recombination line is also shown (dashed black line). |
| In the text | |
|
Fig. 2. Relation between the N3O3 parameter and the abundance ratio N/O for different models at a fixed 12 + log(O/H) = 8.9. The models are compared with the N/O abundances derived from the optical lines for a sample of local star-forming galaxies with IR spectroscopic observations, including dwarf galaxies (purple circles), nearby starbursts (red triangles), and local (U)LIRGs (green squares). Three galaxies at high-z with detected [N III] 57 μm and [O III] 52, 88 μm are also included (orange squares). |
| In the text | |
|
Fig. 3. Left: relation between the Ne23 parameter and the total oxygen abundance for the subset of models with log(N/O) = −0.625 dex. Right: relation between the Ne2Ne3 parameter and log U. O/H and log U shown in these figures for the local star-forming galaxies (purple circles: dwarf galaxies; red triangles: nearby starbursts; green squares: local LIRGs) are derived from the optical emission lines using HCM, and are compared with the IR parameters Ne23 and Ne2Ne3, respectively, that were measured in the IR spectra. A polynomial fit to the O/H values for the whole grid of models is also shown (dashed black line in the left panel; see Eq. (3)). |
| In the text | |
|
Fig. 4. Left: relation between the S34 parameter as calculated with H I 12.37 μm and the total oxygen abundance for the subset of models with log(N/O) = −0.625 dex. Right: relation between the S3S4 parameter and log U. O/H and log U derived with HCM for the optical lines in a sample of local star-forming galaxies are compared with the IR parameters S34 and S3S4, respectively (purple circles: dwarf galaxies; red triangles: nearby starbursts; green squares: local LIRGs). |
| In the text | |
|
Fig. 5. Left: relation between the N23 parameter derived with H I 12.37 μm and the total oxygen abundance at a fixed N/O abundance of −0.625 dex. Right: relation between the N3N2 parameter and log U. O/H and log U derived with HCM for the optical lines in a sample of local star-forming galaxies are compared with the IR parameters N23 and N2N3, respectively (purple circles: dwarf galaxies; red triangles: nearby starbursts; green squares: local LIRGs). |
| In the text | |
|
Fig. 6. Relation between the IR O3N2 parameter defined in this work and the total oxygen abundance (left panel) or log U (right panel) for the models at fixed log(N/O) = −0.625 dex. O/H and log U derived with HCM for the optical lines in our sample of local star-forming galaxies (purple circles: dwarf galaxies; red triangles: nearby starbursts; green squares: local LIRGs) and the sample of galaxies at high-z (orange squares) compiled for this work (see Table 1). |
| In the text | |
|
Fig. 7. Left: comparison of the O/H abundances obtained with HCM-IR including the hydrogen recombination lines, log(O/H)IR, with the values obtained when only the IR fine-structure lines are used in the analysis, |
| In the text | |
|
Fig. 8. Upper left: comparison between the direct-method abundances from Madden et al. (2013) and those obtained with HCM (Pérez-Montero 2014) using the same optical line flux measurements for the sample of dwarf galaxies (purple circles). Upper right: direct-method abundances against the values obtained with HCM-IR using the nebular lines in the IR range. Middle left: comparison of the optical strong-line estimates obtained with the R calibration from Pilyugin & Grebel (2016) and HCM-IR for dwarfs galaxies (purple circles), nearby starburst galaxies (red triangles), and local (U)LIRGs (green squares). Middle right: optical abundances obtained with the S calibration from Pilyugin & Grebel (2016) against the IR determinations with HCM-IR. Lower left: IR HCM-IR abundances compared to the optical abundances derived with HCM. Lower right: comparison of the N/O abundances obtained with HCM-IR and HCM using the IR and optical nebular lines, respectively, for the galaxies in our sample for which both estimates were possible. A linear regression fit between HCM-IR and the optical methods is represented by the solid black line and the associated 95% confidence interval (dotted black lines). In all cases the dashed grey line represents the bisector of the figure. Filled symbols correspond to galaxies for which the IR abundance was estimated using a hydrogen recombination line (mostly Huα), while for the galaxies with open symbols the abundances were obtained using the IR nebular lines alone. |
| In the text | |
Current usage metrics show cumulative count of Article Views (full-text article views including HTML views, PDF and ePub downloads, according to the available data) and Abstracts Views on Vision4Press platform.
Data correspond to usage on the plateform after 2015. The current usage metrics is available 48-96 hours after online publication and is updated daily on week days.
Initial download of the metrics may take a while.