Fig. 7.
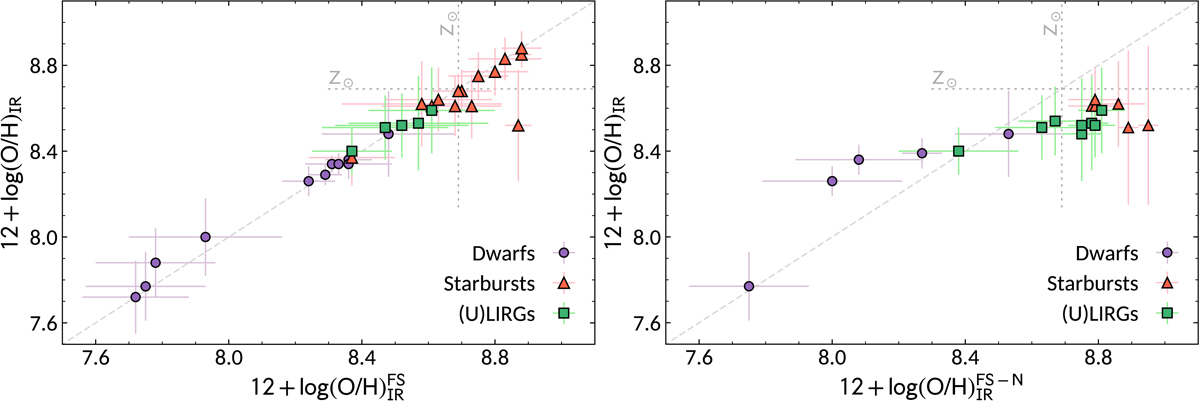
Left: comparison of the O/H abundances obtained with HCM-IR including the hydrogen recombination lines, log(O/H)IR, with the values obtained when only the IR fine-structure lines are used in the analysis, ![]() . The sample includes dwarf galaxies (purple circles), nearby starbursts (red triangles), and local (U)LIRGs (green squares). Right: comparison of the O/H abundances obtained with HCM-IR including hydrogen and nitrogen lines with the values obtained with the IR fine-structure lines excluding the nitrogen lines,
. The sample includes dwarf galaxies (purple circles), nearby starbursts (red triangles), and local (U)LIRGs (green squares). Right: comparison of the O/H abundances obtained with HCM-IR including hydrogen and nitrogen lines with the values obtained with the IR fine-structure lines excluding the nitrogen lines, ![]() . The sample includes dwarf galaxies (purple circles), nearby starbursts (red triangles), and local (U)LIRGs (green squares). In both panels the bisector of the diagram is indicated by the dashed grey line, while the solar metallicity values are marked in both axes as dotted grey lines.
. The sample includes dwarf galaxies (purple circles), nearby starbursts (red triangles), and local (U)LIRGs (green squares). In both panels the bisector of the diagram is indicated by the dashed grey line, while the solar metallicity values are marked in both axes as dotted grey lines.
Current usage metrics show cumulative count of Article Views (full-text article views including HTML views, PDF and ePub downloads, according to the available data) and Abstracts Views on Vision4Press platform.
Data correspond to usage on the plateform after 2015. The current usage metrics is available 48-96 hours after online publication and is updated daily on week days.
Initial download of the metrics may take a while.