Fig. 6.
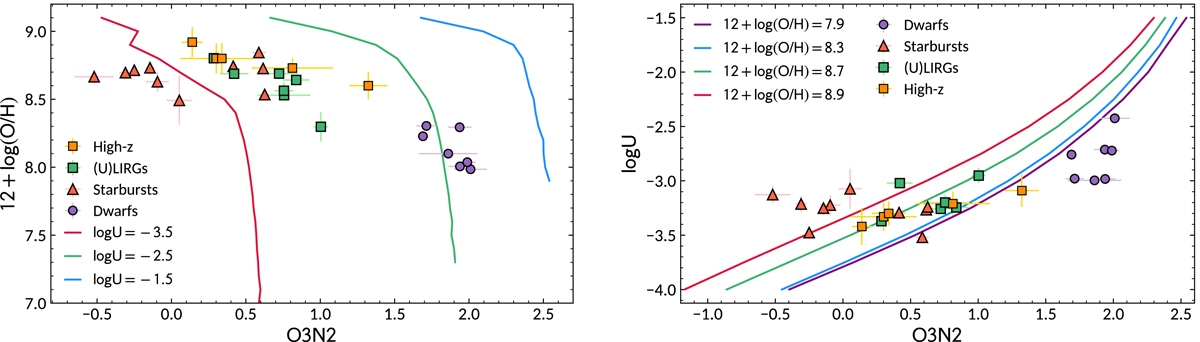
Relation between the IR O3N2 parameter defined in this work and the total oxygen abundance (left panel) or log U (right panel) for the models at fixed log(N/O) = −0.625 dex. O/H and log U derived with HCM for the optical lines in our sample of local star-forming galaxies (purple circles: dwarf galaxies; red triangles: nearby starbursts; green squares: local LIRGs) and the sample of galaxies at high-z (orange squares) compiled for this work (see Table 1).
Current usage metrics show cumulative count of Article Views (full-text article views including HTML views, PDF and ePub downloads, according to the available data) and Abstracts Views on Vision4Press platform.
Data correspond to usage on the plateform after 2015. The current usage metrics is available 48-96 hours after online publication and is updated daily on week days.
Initial download of the metrics may take a while.