Fig. 3.
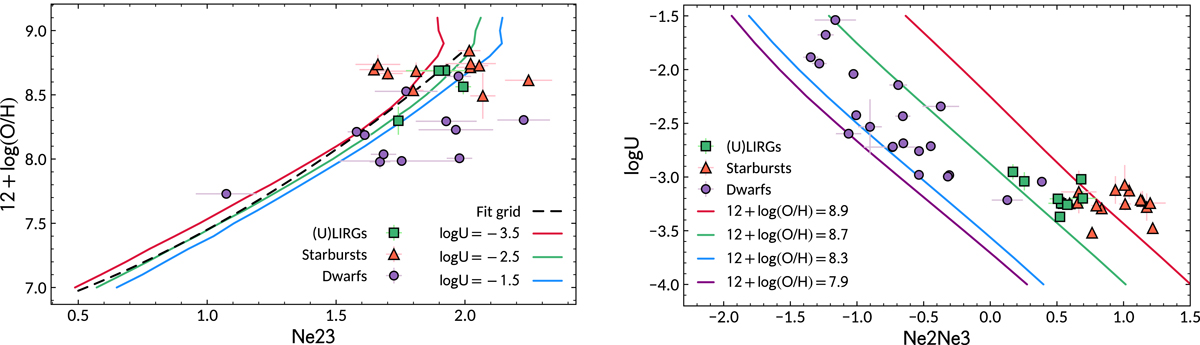
Left: relation between the Ne23 parameter and the total oxygen abundance for the subset of models with log(N/O) = −0.625 dex. Right: relation between the Ne2Ne3 parameter and log U. O/H and log U shown in these figures for the local star-forming galaxies (purple circles: dwarf galaxies; red triangles: nearby starbursts; green squares: local LIRGs) are derived from the optical emission lines using HCM, and are compared with the IR parameters Ne23 and Ne2Ne3, respectively, that were measured in the IR spectra. A polynomial fit to the O/H values for the whole grid of models is also shown (dashed black line in the left panel; see Eq. (3)).
Current usage metrics show cumulative count of Article Views (full-text article views including HTML views, PDF and ePub downloads, according to the available data) and Abstracts Views on Vision4Press platform.
Data correspond to usage on the plateform after 2015. The current usage metrics is available 48-96 hours after online publication and is updated daily on week days.
Initial download of the metrics may take a while.