Fig. 2.
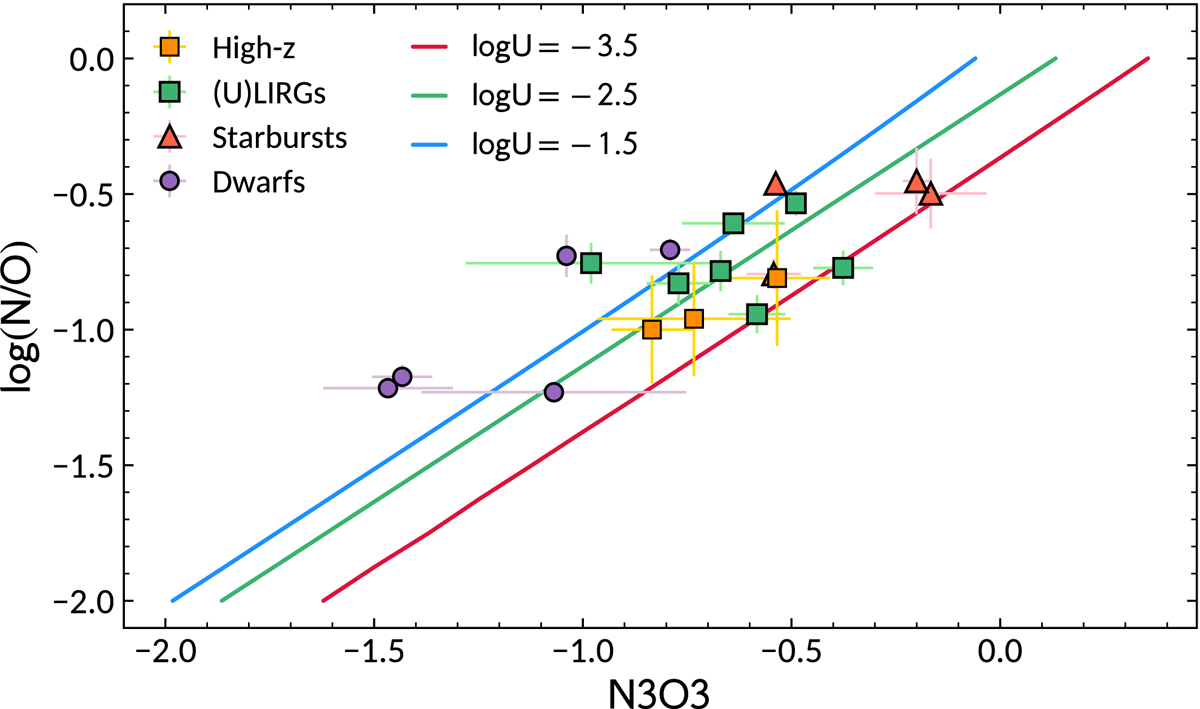
Relation between the N3O3 parameter and the abundance ratio N/O for different models at a fixed 12 + log(O/H) = 8.9. The models are compared with the N/O abundances derived from the optical lines for a sample of local star-forming galaxies with IR spectroscopic observations, including dwarf galaxies (purple circles), nearby starbursts (red triangles), and local (U)LIRGs (green squares). Three galaxies at high-z with detected [N III] 57 μm and [O III] 52, 88 μm are also included (orange squares).
Current usage metrics show cumulative count of Article Views (full-text article views including HTML views, PDF and ePub downloads, according to the available data) and Abstracts Views on Vision4Press platform.
Data correspond to usage on the plateform after 2015. The current usage metrics is available 48-96 hours after online publication and is updated daily on week days.
Initial download of the metrics may take a while.