Fig. 8.
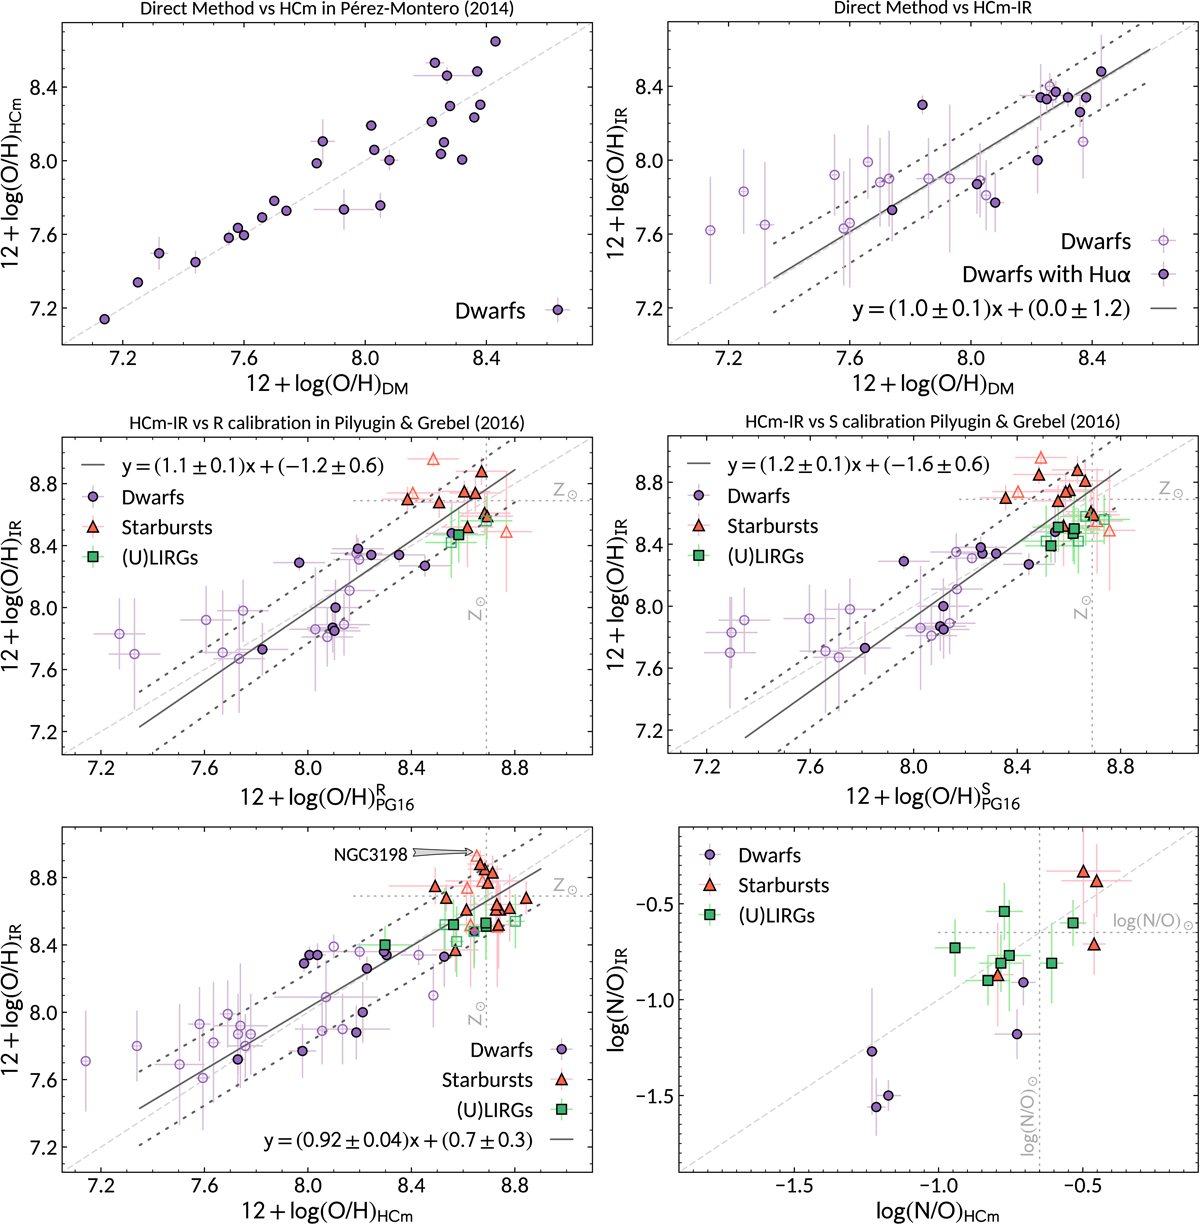
Upper left: comparison between the direct-method abundances from Madden et al. (2013) and those obtained with HCM (Pérez-Montero 2014) using the same optical line flux measurements for the sample of dwarf galaxies (purple circles). Upper right: direct-method abundances against the values obtained with HCM-IR using the nebular lines in the IR range. Middle left: comparison of the optical strong-line estimates obtained with the R calibration from Pilyugin & Grebel (2016) and HCM-IR for dwarfs galaxies (purple circles), nearby starburst galaxies (red triangles), and local (U)LIRGs (green squares). Middle right: optical abundances obtained with the S calibration from Pilyugin & Grebel (2016) against the IR determinations with HCM-IR. Lower left: IR HCM-IR abundances compared to the optical abundances derived with HCM. Lower right: comparison of the N/O abundances obtained with HCM-IR and HCM using the IR and optical nebular lines, respectively, for the galaxies in our sample for which both estimates were possible. A linear regression fit between HCM-IR and the optical methods is represented by the solid black line and the associated 95% confidence interval (dotted black lines). In all cases the dashed grey line represents the bisector of the figure. Filled symbols correspond to galaxies for which the IR abundance was estimated using a hydrogen recombination line (mostly Huα), while for the galaxies with open symbols the abundances were obtained using the IR nebular lines alone.
Current usage metrics show cumulative count of Article Views (full-text article views including HTML views, PDF and ePub downloads, according to the available data) and Abstracts Views on Vision4Press platform.
Data correspond to usage on the plateform after 2015. The current usage metrics is available 48-96 hours after online publication and is updated daily on week days.
Initial download of the metrics may take a while.