| Issue |
A&A
Volume 649, May 2021
|
|
|---|---|---|
| Article Number | A78 | |
| Number of page(s) | 19 | |
| Section | Extragalactic astronomy | |
| DOI | https://doi.org/10.1051/0004-6361/202038700 | |
| Published online | 13 May 2021 | |
Three Lyman-α-emitting filaments converging to a massive galaxy group at z = 2.91: discussing the case for cold gas infall
1
CEA, Irfu, DAp, AIM, Université Paris-Saclay, Université de Paris, CNRS, 91191 Gif-sur-Yvette, France
e-mail: This email address is being protected from spambots. You need JavaScript enabled to view it.
2
Cosmic Dawn Center (DAWN), Copenhagen, Denmark
3
Niels Bohr Institute, University of Copenhagen, Jagtvej 128, 2200 Copenhagen N, Denmark
4
Department of Physics & Astronomy, University of California Los Angeles, 430 Portola Plaza, Los Angeles, CA 90095, USA
5
California Institute of Technology, 1216 East California Boulevard, Pasadena, CA, 91125
USA
6
Department of Physics & Astronomy, Johns Hopkins University, Baltimore, MD, 21218, USA
7
Department of Physics, University of Helsinki, Gustaf Hällströmin katu 2, 00014 Helsinki, Finland
8
Canadian Institute for Theoretical Astrophysics, University of Toronto, 60 St. George Street, Toronto, ON M5S 3H8,
Canada
9
INAF – Osservatorio Astronomico di Brera, Via Brera 28, 20121 Milano; Via E. Bianchi 46, 23807 Merate, Italy
10
Instituto de Astrofísica de Canarias (IAC), 38205 La Laguna, Tenerife, Spain
11
Universidad de La Laguna, Dpto. Astrofísica, 38206 La Laguna, Tenerife, Spain
12
Max Planck Institute for Astronomy, Konigstuhl 17, 69117 Heidelberg, Germany
13
Faculty of Physics, Ludwig-Maximilians-Universität, Scheinerstr. 1, 81679 Munich, Germany
14
Dipartimento di Fisica, Universitá di Trieste, Via Tiepolo 11, 34143 Trieste, Italy
15
INAF-Osservatorio Astronomico di Brera, Via Brera 28, 20121 Milano, Italy
16
INAF, Osservatorio Astronomico di Roma, Via Frascati 33, 00078 Monteporzio Catone, Italy
17
Max-Planck-Institut fur Extraterrestrische Physik (MPE), Giessenbachstr. 1, 85748 Garching, Germany
18
Instituto de Fisica, Pontificia Universidad Catolica de Valparaiso, Casilla, 4059 Valparaiso, Chile
19
Institute of Theoretical Astrophysics, University of Oslo, PO Box 1029 Blindern, 0315 Oslo, Norway
20
Centre for Extragalactic Astronomy, Durham University, South Road, Durham, DH1 3LE, UK
21
Institute of Astronomy, The University of Tokyo, 2-21-1 Osawa, Mitaka, Tokyo 181-0015, Japan
Received:
19
June
2020
Accepted:
22
February
2021
Abstract
We have discovered a 300 kpc-wide giant Lyman-α (Lyα) nebula centered on the massive galaxy group RO-1001 at z = 2.91 in the Cosmic Evolution Survey field. Keck Cosmic Web Imager observations reveal three cold gas filaments converging into the center of the potential well of its ∼4 × 10¹³ M⊙ dark matter halo, hosting 1200 M⊙ yr−1 of star formation as probed by Atacama Large Millimeter Array and NOrthern Extended Millimeter Array observations. The nebula morphological and kinematics properties and the prevalence of blueshifted components in the Lyα spectra are consistent with a scenario of gas accretion. The upper limits on active galactic nuclei activity and overall energetics favor gravity as the primary Lyα powering source and infall as the main source of gas flows to the system. Although interpretational difficulties remain, with outflows and likely also photoionization with ensuing recombination still playing a role, this finding provides arguably an ideal environment to quantitatively test models of cold gas accretion and galaxy feeding inside an actively star-forming massive halo at high redshift.
Key words: galaxies: evolution / Galaxy: formation / galaxies: groups: individual: RO-1001 / large-scale structure of Universe / galaxies: clusters: intracluster medium
Hubble fellow.
© E. Daddi et al. 2021
 Open Access article, published by EDP Sciences, under the terms of the Creative Commons Attribution License (https://creativecommons.org/licenses/by/4.0), which permits unrestricted use, distribution, and reproduction in any medium, provided the original work is properly cited.
1. Introduction
A fundamental phenomenon required to explain the evolution of massive galaxies at high redshifts is the efficient accretion of cold gas streaming along filaments, surviving the shocks at the virial radii of their massive halos and delivering the required fuel to galaxies (Dekel et al. 2009; Kereš et al. 2005). This scenario is intimately connected to our current understanding of the star formation and growth of galaxies at cosmic noon 1 < z < 3 (and earlier), whose key observational features might be summarized with two basic tenets: the existence of tight correlations between the stellar mass and star formation rates (SFRs) in galaxies (the so-called main sequence of star formation; e.g., Noeske et al. 2007; Elbaz et al. 2007; Daddi et al. 2007) and the systematic increase of gas fractions along with specific SFRs as a function of redshift for typical main sequence galaxies (e.g., Daddi et al. 2008, 2010; Tacconi et al. 2010; Magdis et al. 2012; Genzel et al. 2015). The finding that star-forming galaxies at these redshifts are much more common than quiescent systems (e.g., Ilbert et al. 2010) coupled to the tight main sequence correlations imply that star formation in galaxies occurs and is persistent over timescales much longer than their typical stellar doubling times and gas consumption timescales, meaning that constant replenishment of their gas reservoirs is required (e.g., Lilly et al. 2013; Walter et al. 2020).
Cold accretion models quite satisfactorily account for this observational evidence, as they predict that cold material that is nearly ready to form stars accretes at rates proportional to the hosting halo mass (Neistein & Dekel 2008; Dekel et al. 2013), thus naturally resulting in main-sequence-like behavior (as recognized by theory even before observational confirmation; see e.g., Finlator et al. 2006). Also, accretion rates at fixed mass are predicted to evolve rapidly with redshift, with trends (scaling as (1 + z)α with α ≈ 2 − 3) that correspond well to the evolving behavior of the main sequence normalization (e.g., Sargent et al. 2012) and gas fractions (Magdis et al. 2012; Genzel et al. 2015). Nevertheless, it is crucial that accreting gas be cold –hot accretion occurs on overly long timescales and at overly low rates to be effective (Kereš et al. 2005; Katz et al. 2003; Birnboim & Dekel 2003). Still, even under the assumption of cold accretion, not everything is fully reconciled. For example, tension between predicted and observed star formation rates in typical galaxies at cosmic noon has persisted for over a decade (e.g., Daddi et al. 2007) but it is generally understood as being due to limitations in the modeling of feedback and the subsequent implications for gas consumption and the baryon cycle (Somerville & Davé 2015; Popping et al. 2019).
Despite more than a decade of effort, definitive observational confirmation of the existence of such cold gas accretion from the intergalactic medium is still lacking, bringing the theory into question. On the observational side, it appears that outflows are actually widespread in absorption in the galactic gas surrounding galaxies (Steidel et al. 2010), making it harder to study inflowing gas in this way. A number of studies at moderate redshifts report evidence of enriched gas inflows from redshifted components of metal lines in absorption (Giavalisco et al. 2011; Rubin et al. 2012; Martin et al. 2012; Bouché et al. 2013, 2016; Turner et al. 2017; Zabl et al. 2019; Chen et al. 2020; Fu et al. 2021). However, it often remains unclear if this is cold accretion rather than gas recycling or infall connected with mergers. From the theoretical side, the latest generation of high-resolution simulations now call into question whether streams can survive the interaction with the hot baryons in halos and remain stable (Nelson et al. 2015; Mandelker et al. 2019). Also, numerical simulations of cold streams have been questioned for not having the required resolution to capture the small-scale gas physics (Cornuault et al. 2018), making it unclear whether predictions can offer quantitative information. This uncertainty on the feeding of galaxy activity also limits our understanding of feedback processes (e.g., Gabor & Bournaud 2014; Dekel & Mandelker 2014).
It is widely recognized that the most promising avenue for revealing these cold gas streams is through their collisionally excited Lyman-α (Lyα) emission (Dijkstra & Loeb 2009; Goerdt et al. 2010; Rosdahl & Blaizot 2012), possibly enhanced by hydrodynamical instabilities (e.g., Mandelker et al. 2020a). It is much more difficult to ascertain whether any observed extended Lyα emission is due to collisional excitation rather than recombinations following photoionization from star formation and/or active galactic nuclei (AGN) activity. Even more fundamental is the difficulty in properly distinguishing between Lyα emission arising from outflowing versus infalling gas, given that broadly either mass motion would give rise to similar instability-driven phenomenology (e.g., Cornuault et al. 2018; Qiu et al. 2020).
Giant Lyα nebulae are now routinely discovered around quasi-stellar objects (QSOs) at redshifts 2 < z < 4 (e.g., Borisova et al. 2016; Arrigoni et al. 2018, 2019; Cai et al. 2019; O’Sullivan et al. 2020) with detections as high as z ∼ 6.6 (Farina et al. 2019) and could potentially provide large samples to statistically search for the role of infall. Filamentary structures sometimes found in QSO Lyα nebulae (Cantalupo et al. 2014; Hennawi et al. 2015) might be consistent with gas infall (e.g., Martin et al. 2015a, 2019). However, it is not easy to rule out alternative interpretations: outflows (Fiore et al. 2017; Guo et al. 2020; Veilleux et al. 2020) overshadow expected infall in luminous QSO-hosting halos by orders of magnitude for both energy and gas flows (see quantitative discussion later in this work; Fu et al. 2021). Also, the Lyα emission in those environments is almost certainly photoionized by the QSO hard-UV emerging photons, making it difficult not only to gauge whether or not any gravitation-driven Lyα is at all present in QSO nebulae but also whether or not any infall is actually taking place.
A remarkable filament of megaparsec (Mpc) length shining in Lyα was also recently found in the SSA22a-LAB1 proto-cluster environment at z = 3.1 (Umehata et al. 2019). However, that relatively giant Lyα nebula does not appear to be consistent with arising from infall alone, as there is a large shearing velocity field orthogonal to the main axis of the nebula (Herenz et al. 2020). There is no direct kinematic evidence of gas accretion or convergence onto the deep potential well of any particular massive dark matter (DM) halo in the Mpc-scale filaments reported in SSA22, likely because of the sparsity and extension of this young proto-cluster region encompassing a number of active galaxies. However, evidence of this nature could still be found for individual subregions and smaller blobs. The filamentary structures around individual QSOs and in the SSA22 proto-cluster were suggested to be signatures of the connection with the cosmic web, where each individual star-forming galaxy or QSO locally illuminates the surrounding gas via photoionization, enabling the detection. However, such filaments are extended over much greater scales than the virial radius or any meaningful size metrics of their putative hosting DM halos, which is where theoretical works have predicted the possible detection of Lya emission from cold flows owing to sufficient gas density and confinement from hot gas (Dekel et al. 2009; Dijkstra & Loeb 2009). The nature and origin of these filaments is therefore still an interesting and open problem.
A critical test for models would therefore be the search for cold accreting gas in distant and massive halos and in environments where the contrast with competing mechanisms for gas flows and for powering the detectable Lya emission is maximal. The first requirement follows from the fact that the dark and baryonic matter accretion rates increase with both the halo mass and redshift (Neistein & Dekel 2008; Dekel et al. 2009), and is not trivial to address when considering that massive halos become more rare in the distant Universe because of their hierarchical assembly. Moreover, the necessity for excluding alternative mechanisms suggests a move away from extreme sources such as QSOs, focusing on structures where the black hole and star formation activities proceed at a standard pace. Both lines of argument point to high-redshift clusters or groups as ideal testbeds for comparing theory to observations and searching for evidence of cold accreting gas, as already seminally suggested by Valentino et al. (2015; see their Fig. 17 and related discussion) and Overzier (2016; see their Fig. 11 and related discussion). This is because such clusters and/or groups would provide the opportunity to search for nonphotoionized Lyα in an environment where the role of outflows could be minimal and where filaments could be studied in connection to the halo they are streaming into, thus enabling quantitative comparison to cold accretion theory. This work presents one such plausible candidate. A more complete discussion of prospects for detecting cold accretion in lower mass halos is postponed to the concluding section, as this discussion will benefit from the presentation of our observational results.
Following the serendipitous discovery (Valentino et al. 2016) of a giant Lyα halo centered on the X-ray-detected cluster CL 1449 at z = 1.99, we pursued this avenue and started systematic observations of several structures at 2 < z < 3.5 with the Keck Cosmic Web Imager (KCWI), searching for redshifted Lyα. This is reversing the standard strategy of discovering Lyα nebulae from blind (e.g., narrow-band) surveys and following them up to find that they are typically hosted in moderately dense environments, by starting with a systematic investigation of the prevalence of Lyα emission inside massive halos at high redshifts. Among the great advantages of integral field spectroscopy, as now provided routinely by the multi-unit spectroscopic explorer (MUSE; Bacon et al. 2010) and KCWI (Morrissey et al. 2018), and as opposed to earlier narrow-band imaging attempts, is the potential to unveil the kinematics and spectral properties of the Lyα emission that, keeping in mind the uncertainties linked to resonant scattering effects, can provide valuable diagnostics on the presence of accretion (see, e.g., Ao et al. 2020). As part of these efforts, we used KCWI to search for redshifted Lyα in RO-1001, a massive group of galaxies at z = 2.91 that is currently our best-studied target with the deepest and widest observations, which we present in this work. Results for our full KCWI survey of distant structures will be presented elsewhere (Daddi et al., in prep.).
This paper is organized as follows: we present in Sect. 2 the observational characterization of the RO-1001 structure, starting from observations of the giant Lyα halo which motivates a detailed look into the overall properties of the galaxies hosted therein. Section 3 presents the spectral properties of the Lyα emission including moments (velocity and dispersion fields). We interpret these with the aid of simplified resonant scattering modeling and multi-Gaussian decomposition, and compare these to cold accretion theory predictions informed by the estimated DM halo. Section 4 discusses the overall energetics and gas flows that characterize the system, particularly in comparison with Lyα nebulae observed around QSOs. Conclusions and a summary are provided in Sect. 5. In this work, we adopt a standard cosmology and a Chabrier initial mass function (IMF).
2. Observational characterization of RO-1001
RO-1001 was selected in the Cosmic Evolution Survey (COSMOS) two-square-degree field as a 12σ overdensity of optically faint radio sources centered at RA 10:01:23.064 and Dec 2:20:04.86, following a recently proposed technique (Daddi et al. 2017): it was found to contain three Very Large Array (VLA) detections with S3 GHz > 30 μJy and zphot > 2.5 within a radius of 10″ (80 kpc; proper scales are used throughout the paper), which is the size of a massive halo core (Strazzullo et al. 2013; Wang et al. 2016). These three VLA galaxies are also bright in Atacama Large Millimeter Array (ALMA) submillimeter (submm) imaging (200 μm rest-frame), that is, they are highly star-forming galaxies (not AGNs), as discussed in the following. NOrthern Extended Millimeter Array (NOEMA) CO[3−2] line observations confirm their zspec ∼ 2.91. In this section, we first present the observations and reduction of KCWI data, with the discovery of a Lyα nebula in this structure. We then discuss the stellar mass of its member galaxies, and constrain the hosting halo mass. Finally, we present the exploration of their star formation and AGN content and the derivation of redshifts from CO observations.
2.1. KCWI observations and analysis
We observed RO-1001 with KCWI on January 16 2018 for 1 h using the BM grism (R = 2000 with the adopted large field of view), and on February 3 and 4 2019 for 3.5 h and 4 h, respectively, using the lower resolution BL grism (R = 900), giving a total of 8.5 h on-source when combining all observations. Conditions were excellent with dark sky and seeing typically in the range of 0.4−0.7″. We used integration times of 900 s in 2018 and of 1800 s in 2019, with dithering and large offsets to eventually cover a region corresponding to 2 × 2 KCWI fields of view of 40″ × 60″ (i.e., 300 × 500 kpc2). In reality, within the first hour of integration obtained in 2018 it was clear that the nebula extends well beyond the usable KCWI field of view of about 18″ × 31″ for the adopted configuration with large slices (1.35″). The low-resolution BL data cover the full 3500−5500 Å range (corresponding to 900−1400 Å rest-frame at the redshift of RO-1001), while the BM observations cover a shorter range across the Lyα emission. We used the standard KCWI pipeline Kderp (Morrissey et al. 2018; Neill & Matuszewski 2018) for the data reduction, including twilight flats to obtain accurate illumination corrections. We further used CubEx tools (Cantalupo et al. 2019) to refine the flat-fielding slice by slice, thus allowing us to improve the sky subtraction by removing a median sky value at each wavelength layer, after masking sources detected in the stacked (continuum) cubes. This step was first performed over the whole frame and subsequently iterated by masking regions where Lyα emission had been detected to avoid self-subtraction of the Lyα signal. Further reduction and analysis steps were performed with the CWItools scripts (O’Sullivan et al. 2020; Martin et al. 2019). We estimate variance cubes from the original, nonresampled cubes and propagate the uncertainties through the combination to obtain a final variance cube. We combined the dithered and offset observations based on the astrometry of each frame that was derived by cross-correlating to B-band Suprime-CAM imaging of the area publicly available from the COSMOS survey, and resampling into a final pixel scale of 0.29″, corresponding to the finer grid in the original slices. We then subtracted any continuum emission from objects in the combined cubes by fitting a seventh-order polynomial as a function of wavelength at each spatial pixel, avoiding the wavelength range where Lyα emission is present. From compact objects in the final cube we estimate an average image quality of 0.6″ (full width at half maximum; FWHM). The Lyα nebula is very clearly detected (Figs. 1 and 2). We produced a low-resolution cube containing all 8.5 h observations, which is used for most of the analysis in this paper, and a higher spectral resolution cube using only 2018 BM data, which is used to obtain higher quality Lyα spectra in the core (Sect. 3). We used adaptive smoothing (O’Sullivan et al. 2020; Martin et al. 2019) to recover the full extent of the nebula in the low-resolution cube, thresholding at the 3σ level. We started by smoothing with a spatial kernel equal to the seeing and averaging three (1 Å wide) spectral layers (roughly corresponding to the spectral resolution). This already selects 93% of the pixels eventually detected in the Lyα nebula when allowing for larger spatial and spectral smoothing scales. The signal-to-noise ratio (S/N) of the Lyα emission in the original, unsmoothed data is shown in Fig. A.1.
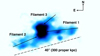 |
Fig. 1. Lyα image from KCWI observations of the RO-1001 group. The three extended filaments that are clearly traced by Lyα are labeled. The corresponding Lyα surface brightness levels can be gauged from Fig. 2. |
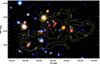 |
Fig. 2. Deep optical-NIR imaging of the RO-1001 group from UltraVISTA Ks and J (red and green) and Subaru Suprime-CAM (combined VRI bands; blue), over a 30″ × 40″ field of view. The green contours show the Lyα surface brightness from Fig. 1 in steps of 0.5 dex, from a few 10−17 s−1 erg cm−2 arcsec−2 (center) to ×30 lower surface brightness (filaments). The three ALMA/VLA sources are labeled (ABC; white contours), together with a fourth massive galaxy (D) which is a candidate quiescent object in the structure. We note that further luminous objects aligned with the Lyα emission are in the foreground; see e.g., the Lyα depression coincident with the two sources in the East filament, which we interpret as being due to dust absorption. |
The observations revealed faint, low-surface brightness, large-area Lyα filamentary structures that converge onto a bright Lyα nebula at the center of the potential well of the group (Figs. 1 and 2), with a total of LLya = 1.3 ± 0.2 × 1044 erg s−1 (the uncertainty includes the effect of S/N thresholding on flux detection and accounting for possible absorption1 from z = 2.91). Three filaments can be readily recognized from the surface brightness profile of the nebula (Figs. 1 and 2). The two most prominent, extending southeast and west of the nebula, respectively, appear to be traceable over a projected distance of 200 kpc from the core, at the current 3σ surface brightness limit of 10−19 erg s−1 cm−2 arcsec−2, reconstructed from adaptive smoothing. A third structure that we can identify with a filament extends towards the northwest (Figs. 1 and 2), and is likely affected by projection effects.
Moment-1 (velocity) and -2 (dispersion) maps are built using pixels flagged to be part of the nebula’s detected signal by the adaptive smoothing procedure (as discussed above), but using original (unsmoothed) pixel values. Uncertainties in the moment maps are obtained by error propagation.
2.2. Stellar masses and hosting halo mass
There are four massive (M > 1011 M⊙) galaxies within 13″ (∼100 kpc proper at z = 2.91) of RO-1001, with an estimated (Muzzin et al. 2013; Laigle et al. 2016) photometric redshift in the range 2.5 < z < 3.5; see Table 1. One source (D in Fig. 2) is blended with a close neighbor. We obtained a revised stellar mass estimate, empirically calibrated on sources at similar redshift from the COSMOS2015 catalog (Laigle et al. 2016), and based on J, H, and K photometry from the DR4 UltraVISTA imaging and 3.6, 4.5 μm Spitzer/IRAC imaging. We estimate a stellar mass completeness limit of log(M/M⊙) = 10.8.
Massive galaxies in the RO-1001 group.
Three of the massive galaxies are shown to be at z = 2.91 from CO[3−2] spectroscopy, as discussed later in this section, but source D remains unidentified as it is likely passive (Sect. 2.3). Given the similarity in the optical rest-frame colors and spectral energy distribution (SED) to other group members, and the negligible probability of such a red and massive galaxy being there by chance (recall galaxy D was not detected in the radio), we assume in the following that it also resides in the RO-1001 group.
There are no additional z ∼ 3 massive ∼1011 M⊙ galaxies to a distance of 1′ from RO-1001. The total stellar mass of log(M/M⊙) > 10.8 galaxies in the structure therefore adds up to  , where we assume that the uncertainty on individual stellar mass estimates is at least factor ∼50%; (see e.g., Muzzin et al. 2013). We extrapolate a total stellar mass down to 107 M⊙ of 1.0
 assuming the stellar mass function of field galaxies, again from Muzzin et al. (2013), at 2.5 < z < 3. Adopting the scaling between total stellar and halo mass derived from z ∼ 1 clusters with masses in the range 0.6 − 16 × 1014 M⊙ (van der Burg et al. 2014) would yield a halo mass of M200 ∼ 6 × 10¹³ M⊙. We note that if scaling by the difference between the cluster and field galaxy stellar mass function at z ∼ 1 as in van der Burg et al. (2013), we obtain a lower estimate for the total stellar mass of
  , and therefore a lower estimate for the total halo mass of M200 ∼ 4 × 10¹³ M⊙. However, the environmental dependence of stellar mass functions at z ∼ 1 and z ∼ 3 may be significantly different, so a range of M200 ∼ 4 − 6 × 10¹³ M⊙ brackets plausible estimates. We note that the stellar-mass-to-DM mass scaling that we obtain is similar to what is estimated for Cl-1001 and for Cl-1449, which are supported by X-ray detections (Gobat et al. 2011; Wang et al. 2016) and SZ for Cl-1449 (Gobat et al. 2019).
2.3. ALMA dust continuum observations
We recovered publicly available ALMA band 7 data covering RO-1001, which consist of three pointings from projects 2015.1.00137.S (PI: N. Scoville) and 2016.1.00478.S (PI: O. Miettinen). These are imaged with a common restoring beam of 0.15 arcsec with natural weighting (given the maximum baseline of 1107 m), and are then corrected for primary beam attenuation and combined. The continuum rms reaches about 50 μJy beam−1 in the central region at the restored resolution (and about two times higher if tapered to a beam of 0.6″). Three galaxies are very clearly detected (Fig. 3; Table 1). No other significant detection is present in the ALMA imaging.
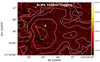 |
Fig. 3. ALMA 343 GHz continuum mosaic image with primary beam attenuation correction (the color bar shows Jy beam−1). The image reaches an rms of ∼50 μJy beam−1 at the center, at the resolution of 0.15″. Contours show the Lyα emission. |
In order to measure the size of the dust emission, we modeled the ALMA observations in the uv space, combining all datasets. We fitted circular Gaussian sources for simplicity: sizes for individual objects are reported in Table 1.
2.4. NOEMA CO observations: constraining the redshift of ALMA-detected galaxies
We observed the RO-1001 field with the IRAM NOEMA interferometer covering the CO[3−2] line emission redshifted to 88.3 GHz for z = 2.91, with the main aims being to confirm the redshift of cluster galaxies and to accurately measure their systemic velocities. The field was observed from November 2018 to March 2019. A total of seven tracks were obtained. The data were calibrated in a standard way using GILDAS clic software packages, and analyzed with mapping. The data have an rms sensitivity of 5 μJy beam−1 in the continuum and of 24 mJy km s−1 over 300 km s−1 for emission lines. The primary beam is about 1 arcmin, covering a large area around the nebula. The resulting synthesized beam at 88.3 GHz is rather elongated at 4.0 × 1.8″, with a position angle of 15°. None of the ALMA detected sources are resolved at this resolution. We therefore extracted their spectra by fitting PSFs in the uv space at the known spatial positions from ALMA. We simultaneously fit all galaxies in the field, namely the three ALMA galaxies and a bright interloper falling by chance in the large NOEMA field, in order to avoid being affected by sidelobes. The continuum is strongly detected in all three ALMA sources in the RO-1001 structure. We searched for emission lines in the spectra by identifying channel ranges with excess positive emission and identified the strongest line in each galaxy spectrum as the one with the lowest chance significance (Jin et al. 2019; Coogan et al. 2018). Sources B and C have very strong CO[3−2] detections with S/N ∼ 14 at z = 2.91 and very broad emission lines with full width zero intensity (FWZI) of ∼1000 km s−1, significantly broader than the Lyα spectra at their positions (Fig. 4), reflecting the fact that they are massive galaxies with fairly compact sizes. In the case of source C, the CO[3−2] emission is offset in velocity from the emission of the Lyα nebula at its position. A weaker, additional Lyα emission is observed at the same position at −2000 km s−1 offset velocity, outside of the range defined by the integrated Lyα spectrum of the RO-1001 nebula. At the same velocity, another individual Lyα emitter is observed at the southern edge of the probed KCWI field, suggesting that it could be an unrelated galaxy on the line of sight. Alternatively, the Lyα spectrum of galaxy C could be due to jet-like emission from the weak radio AGN possibly present there (see following sections). This would explain both Lyα peaks in the spectrum at this position on opposite velocity sides with respect to the CO[3−2] emission from source C. For source A, the strongest feature in its spectrum is a fairly weak, 3.5σ emission with 380 km s−1 of FWZI. While in itself its reality could be questionable, it turns out that this feature is offset by only 460 km s−1 from the average Lyα velocity from the whole system (z = 2.9154), when we cover CO[3−2] over about 50 000 km s−1 in total. The probability of finding a line with such S/N by chance so close to the structure redshift is about 1%. If we also take into account that the weak line falls almost exactly on top of the Lyα velocity at the position of the galaxy (Fig. 4, center-bottom panel; see also Fig. 10a), we conclude that the identification of this weak feature as CO[3−2] is quite certain, as is the redshift of the galaxy from the simultaneous detection of CO[3−2] and Lyα. A summary of the properties of the three detections by ALMA and NOEMA is given in Table 1.
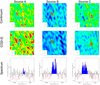 |
Fig. 4. NOEMA observations. The top row shows continuum images, the second row integrated CO[3−2] line emission, and the third row shows the spectra. Different columns correspond to sources A, B, and C, as labeled. The NOEMA spectrum of source A, extracted at the well-determined continuum position (S/N = 8) shows a faint 3.5σ line, at the velocity of the Lyα line at the same position. The Lyα spectra extracted over a PSF at the same location as the galaxies are shown as red dashed histograms, shifted in the plots to lower zero-level for easier comparison. The Lyα spectra are from the lower resolution, higher S/N KCWI cube. The cross in each map is ±2″ and marks the position of the phase center of the NOEMA observations. |
We note that there are large variations in the CO[3−2] flux to underlying continuum ratio (Table 1). This could be due to several factors, including variations in the dust temperature and/or CO excitation ratio. These variations might also be connected to rapid SFR variations given that the dust continuum timescale is 50−100 Myr while the CO[3−2] line is sensitive to the instantaneous dense gas content. However, we note that galaxy A has the lowest CO[3−2]-to-dust-continuum ratio, and is also the most compact: a factor of two smaller in radius than the other two (which are also extremely compact already). We speculate that the lack of CO[3−2] might be due to high optical depths as recently claimed for high-z, dusty galaxies (Jin et al. 2019; Cortzen et al. 2020).
The fourth-most massive galaxy in the system (object D) remains undetected in ALMA and NOEMA continuum and has no CO[3−2] detection. Assuming the average spectral energy distribution temperature as seen in the group to convert the ALMA upper limits into SFR, we place an upper limit of SFR < 30 M⊙ yr−1 (sSFR < 0.3 Gyr−1), which locates this galaxy 1 dex below the main sequence. It is thus a candidate quiescent system in the group.
2.5. Integrated star formation activity
The total infrared (IR) luminosity of the group is derived by fitting (Jin et al. 2018) Herschel, SCUBA2, and ALMA, and NOEMA continuum fluxes. The Herschel/SPIRE images are fitted using two PSF components on the images on the position of sources C and the average position of A and B, respectively. Due to the higher spatial resolution, we fit at the position of all three ALMA sources in the SCUBA2 image (Figs. 5 and 6). We fit the SED of the group, including the summed photometry from Spitzer, Herschel, SCUBA2, ALMA, and NOEMA, and obtain a best-fitting SFR = 1200 M⊙ yr−1 for a SED with an average intensity of the radiation field of ⟨U⟩ = 45 (Fig. 5). Both the dust temperature and average specific star formation rate (sSFR; 3 Gyr−1 on average over the three ALMA galaxies) are in agreement with those of typical main sequence galaxies at z ∼ 3 (Béthermin et al. 2015; Schreiber et al. 2018). Assuming that individual SFRs of the ALMA-detected galaxies scale like the ALMA/NOEMA continuum fluxes, we conclude that also the sSFRs of the individual galaxies place them within the main sequence. This does not imply that they are normal galaxies, as the very compact ALMA sizes betray some ongoing/past starbursting activity (Puglisi et al. 2019).
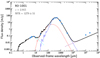 |
Fig. 5. Integrated SED over the RO-1001 field (see Table 2 for the photometric points). The cyan, purple, and red lines are BC03 stellar template, DL07 cold (ambient) dust, and DL07 warm (PDR) dust, respectively. The radio excess is within a factor of two of the average radio–IR correlation, and is therefore not very significant, but may be associated with galaxy ‘C’, which shows a somewhat elongated radio morphology suggestive of a weak jet. Instead, the SED leaves no room for the presence of AGN torus emission in the mid-IR, with an upper limit on its bolometric luminosity of LAGN < 2 × 1045 erg s−1. |
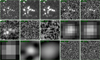 |
Fig. 6. Multiband imaging of the RO-1001 field from Ks, Spitzer IRAC, Herschel PACS and SPIRE, SCUBA2, AzTEC, ALMA, and radio (as labeled). Each cutout is 50″ wide. |
The ALMA 870 μm emission from the three detected galaxies is consistent within the uncertainties with the SCUBA2 signal (Fig. 5), implying that the bulk of the IR emission and SFR in the RO-1001 group comes from the three ALMA detections.
We identified additional star-forming galaxies in the structure at z = 2.91 via their Lyα emission, or in two cases via possible UV absorption lines (Fig. 7). These are not detected in the near-IR to current depths, implying that they are lower mass, star-forming galaxies. Their contribution to the integrated SFR in the RO-1001 group, derived from the Lyα emission, is negligible.
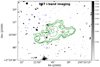 |
Fig. 7. HST imaging of the field in the F814W filter, single orbit (Scoville et al. 2007). The image is smoothed with a Gaussian with the same FWHM as the PSF (0.1″) to enhance visibility of faint features; the color bar shows relative pixel fluxes. Green contours show the Lyα emission. Blue circles are Lyα emitters identified inside the nebula from the KCWI data (within 2000 km s−1): the small offsets with respect to the HST positions are a combined effect of the noise in the Lyα cube affecting their recovery and the accuracy of the astrometric solution of the KCWI cube. Cyan circles mark two galaxies in the structure identified from UV absorption, and red circles show the positions of the ALMA galaxy detections. |
2.6. AGN limits
A cross-match between RO 1001 and the deepest Chandra COSMOS+Legacy images (Civano et al. 2016) yields no X-ray point-source detection. We stacked the observed soft (0.5−2 keV) and hard (2−10 keV) bands at the position of the three ALMA sources using CSTACK2. We estimate an average LX < 3.5 × 1043 erg s−1 (3σ upper limit) in the rest-frame 2−10 keV directly from the soft X-ray fluxes (0.5−2 keV observed). The observed hard X-ray emission maps directly into 8−40 keV rest-frame and is much less affected by obscuration. This provides a limit of LX < 5.4 × 1043 erg s−1 in the rest-frame 2−10 keV, K-corrected assuming a power-law X-ray spectrum with photon index Γ = 1.4 (Gilli et al. 2007). When spread over the three sources, this gives an integrated limit of LX < 1.5 × 1044 erg s−1 in the rest-frame 2−10 keV. We further estimated 3σLX upper limits of LX < 7 × 1042 erg s−1 (rest-frame 0.5−2 keV) corresponding to an AGN bolometric luminosity of LAGN < 2 × 1045 erg s−1, fairly independent of obscuration. This is corroborated by analysis of the individual broad-band SEDs (Jin et al. 2018), in which the mid-IR AGN component is always negligible relative to the host galaxy, providing similar limits on any possible AGN bolometric luminosity.
We calculated the typical AGN luminosity expected from the integrated SFR of the group/cluster, assuming empirical M⋆-dependent black-hole accretion rate (BHAR) to SFR relations (Mullaney et al. 2012; Rodighiero et al. 2015; Delvecchio et al. 2020) for star-forming galaxies. At the high-mass end, the average black hole accretion rates scale as BHAR ∼ 6 × 10⁻⁴ × SFR (see Fig. 4 in Delvecchio et al. 2020). Estimating in this way the BHAR using the integrated SFR in the group, and converting it into a bolometric AGN luminosity, we would expect from this structure an average AGN activity at the level of LAGN ∼ 2 × 1045 erg s−1, comparable to the upper limits inferred from the direct estimates in the X-rays. We use this bolometric luminosity for estimates of energetics.
Using modeling that reproduces the evolution of the X-ray luminosity function through cosmic time on the basis of the mass function and SFR distributions statistically observed in galaxies (Delvecchio et al. 2020), we infer that, given the massive galaxies in the RO-1001 structure and their SFRs, the probability of observing one of them with QSO luminosities as high as those in Borisova et al. (2016) is ∼10−4. This argues in favor of their being only a very brief interval, at best, during which our RO-1001 group could have plausibly been selected in one of the QSO nebula surveys.
The RO-1001 structure was selected due to the presence of three (VLA) detected sources at 3 GHz. All have moderate radio power L3 GHz ∼ 1024.2 − 24.6 W Hz−1. Given the integrated SFR of the group/cluster (∼1200 M⊙ yr−1) and a redshift-dependent IR–radio correlation, radio emission can be broadly explained by consistent levels of star formation within less than a factor of two (Fig. 5). Careful inspection of the shape of the image of source C (see insert in Fig. 8) shows that this source appears to be elongated along the E-W direction in the radio at 3 GHz. This suggests that some extra emission (e.g., from jets) might be present, which may trace (past or relatively weak) AGN activity in this source. This is consistent with the weak Lyα (Figs. 1 and 2) and HST i-band continuum (Fig. 7) detections of this galaxy and, potentially, with the double peak spectrum in Fig. 4.
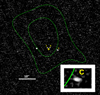 |
Fig. 8. X-ray contours (1 and 2σ) from Chandra+XMM overlayed over the VLA 3 GHz image of the RO-1001 field. The offset between the X-ray peak and the Lyα peak (yellow cross) is entirely consistent with arising from noise. The 3.1σ signal measurement is obtained integrating the emission over a region centered at the RO-1001 centroid and with 24″ radius (set to avoid a bright, unrelated point X-ray source that is increasing the noise substantially). The insert in the bottom-right corner shows a zoom onto source C, allowing a clear view of its elongated shape. The bright, left-most radio source is a low-redshift interloper. |
2.7. X-ray constraint and halo masses
In order to further constrain the hosting halo mass, we searched for extended X-ray bremsstrahlung emission from the hot gas at the position of RO-1001 (lacking any detectable point source X-ray emission; see previous section). We used an X-ray image in the 0.5−2 keV range produced by combining the Chandra and XMM-Newton images after background and point-source removal (Fig. 8). We used a 24″ radius aperture to place the flux estimates on the source, obtaining a value of 5.8 × 10⁻¹⁶ erg s−1 cm−2, which is a 3.1σ excess over the background. The source has a 230 ks Chandra exposure, with a corresponding upper limit on the point source contamination of 1 × 10⁻¹⁶ erg s−1 cm−2 (using the same count-rate-to-flux conversion rate as for the source). At a redshift of z = 2.9 this corresponds (Leauthaud et al. 2010) to rest-frame 0.1−2.4 keV LX of 1.1 × 1044 erg s−1 and a mass of MDM ∼ 4 × 10¹³ M⊙. The temperature of the intracluster medium (ICM) implied by the same correlations is ∼2 keV.
3. Results: general and spectral properties of the Lyα emission nebula in RO-1001 and comparison to cold accretion predictions
The RO-1001 structure appears to be a group hosted in a single, fairly massive dark matter halo. The halo mass of RO-1001 is estimated using three methods returning consistent results:
-
The integrated stellar mass of 5.4 × 10¹¹ M⊙ of its four most massive galaxies (Fig. 2; Sect. 2.2) above a mass completeness limit of log(M/M⊙) > 10.8 and scaled based on stellar to DM ratios corresponds to MDM ∼ 4 − 6 × 10¹³ M⊙.
-
Herschel+ALMA reveal a total IR luminosity LIR = 1.2 × 10¹³ L⊙ from star formation (Sect. 2.5): scaling from the z = 2.5 cluster CL-1001 (Wang et al. 2016) this returns MDM ∼ 4 × 10¹³ M⊙ (accounting for the expected cosmic increase of the SFR over z = 2.5 − 2.9).
-
A blind (no free parameters) X-ray measurement centered at the barycenter of the four massive galaxies returns a 3.1σ excess over the background corresponding to MDM ∼ 4 × 10¹³ M⊙ (Sect. 2.7; contamination by X-rays from star formation is negligible, while no individual point-like X-ray sources are present).
RO-1001 thus appears roughly half as massive as Cl-1001 at z = 2.51 (Wang et al. 2016), the previously most distant X-ray structure known, but more distant, at z = 2.91. This is 400 Myr earlier (15% of Hubble time), which is substantial because at these epochs the halo mass function is rapidly evolving (see e.g., Mo & White 2002).
This mass estimate is important to quantitatively compare our observations and overall properties of its Lyα nebula (Sect. 2.1) to predictions from cold accretion theory. In fact, RO-1001 falls close to the z − MDM regime where cosmological cold flows might penetrate the hot halo, as inferred from simulations and models (Dekel et al. 2009; Behroozi & Silk 2018; cold gas would not penetrate at lower redshifts). Substantial accretion of cold gas in this structure would not be surprising given the ongoing SFR = 1200 M⊙ yr−1 of the group galaxies. Theory predicts gas accretion from the intragroup medium (IGM) scaling as  (Dekel et al. 2013; Neistein & Dekel 2008), or about 10 000 M⊙ yr−1 in RO-1001. This would be sufficient to feed the ongoing SFR, provided that a non-negligible fraction of the likely multi-phase inflow (Cornuault et al. 2018) remains cold. Additionally, local cooling due to the interactions and shocks between the infalling gas and the hot cluster gas might also provide the required cold gas fuel for star formation (Mandelker et al. 2019, 2020b; Zinger et al. 2018).
In light of these findings, below we present an investigation of Lyα emission observables in RO-1001, with a comparison to expectations of cold accretion models informed by the DM halo constraints, but also discuss whether the observations could be explained by an alternative outflow scenario.
3.1. Lyα geometry
The Lyα emission does not appear to be accurately centered on individual galaxies (Fig. 2): the luminous core peaks in an empty region located at the center of the halo potential well (defined as the barycenter of the stellar mass distribution; Fig. 9), about 2″ (15 kpc) away from galaxies A and B. This is similar to the median offset observed in local clusters between the X-ray centers and brightest cluster galaxies (BCG; Lauer et al. 2014; 15% of the BCGs are offset by more than 100 kpc). However, it is worth noting that RO-1001 does not contain a dominant, massive galaxy in which we could obviously recognize a BCG: the four massive galaxies that we identify have all quite comparable stellar masses within less than a factor of two. This is similar to what was found previously for well-studied high-redshift clusters like CL-J1449 –where nevertheless some evidence exists that a proto-BCG might be in the process of assembling at z = 2 (Strazzullo et al. 2016)–, and even more in CL-J1001, where a dozen similarly massive galaxies are packed into a 100 kpc core at z = 2.51 (Wang et al. 2016). This highlights a shortcoming of current cluster/group formation simulations, where BCGs are assembled much earlier (e.g., Saro et al. 2009; Tremmel et al. 2019). This is evident also in the Rosdahl & Blaizot (2012) simulations, where their most massive 1013 M⊙ halo already displays a prominent BCG at z = 3.
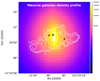 |
Fig. 9. Fourth-nearest neighbor projected density map of massive galaxies in RO-1001. Black contours are from ALMA detections. We note the excellent coincidence of the Lyα emission (contours) with the potential well of the RO-1001 halo as traced by its massive galaxies. The color scale is in units of the number of galaxies per square degree. |
The core of the nebula, where the filaments are less collimated and merge losing their identity, and where the emission is strongest, extends over a radius of about 40−50 kpc. This corresponds to 15−20% of the virial radius of its hosting DM halo (RV ∼ 280 kpc). This is quantitatively consistent with the behavior predicted for cold streams (Danovich et al. 2015) where a ‘messy’ interface region is expected to gradually form within 0.3 RV. The 150−200 kpc radius traced by filaments corresponds to 50−70% of the virial radius of its hosting DM halo, not including possible projection effects. The disappearance of the filaments beyond the virial radius is predicted by cold accretion models to be due to the lack of hot gas compressing the cold material outside of RV (Dekel et al. 2009; Dijkstra & Loeb 2009; Rosdahl & Blaizot 2012). The filaments in RO-1001 have substantial transverse diameters (50−70 kpc; ∼20% of the virial radius). This is predicted by cold accretion models for flows into the most massive halos, which are broadened due to their initially higher pressure and instabilities (Cornuault et al. 2018; Rosdahl & Blaizot 2012). The average surface brightness in the filaments is of order 1 × 10⁻¹⁸ erg s−1 cm−2 arcsec−2, with a total area above this surface brightness limit of 210 arcsec2 (1.3 × 10⁴ kpc2), quite comparable to theoretical expectations from cold accretion models given the hosting halo mass (e.g., see Fig. 11 of Rosdahl & Blaizot 2012). The circularly averaged surface brightness profile follows r−2.1 at large distances, consistent with the same predictions.
It is interesting to consider whether the Lyα nebula geometry, within a hypothesis where substantial cold accretion is lacking, could instead be produced by the outflow activity, and subsequent gas returning to the halo center in the form of galactic fountains (Tumlinson et al. 2017). In this scenario, the filaments would have to be interpreted as extreme AGN-driven outflows originating from (possibly different) individual galaxies (star-formation-driven outflows would presumably trace multiple directions from each individual galaxy). The core could instead be interpreted as a region of filament overlap as well as the place towards which gas ejected with velocities lower than the escape velocity would fall back.
3.2. Lyα moment maps
We can search for further diagnostics of the ongoing physical processes from the Lyα spectral properties. The moment 1 (velocity) map of the Lyα emission in RO-1001 is shown in Fig. 10a. Zero velocity corresponds to the average, flux-weighted redshift of the Lyα emission (z = 2.9154), which as a result coincides with the velocity of most of the core of the nebula, where Lyα intensity is higher. The velocity relative to the core increases in absolute value towards the outer region of the filaments reaching 400−500 km s−1 (and possibly up to 600−700 km s−1 when statistically correcting for the unknown inclinations), similar to the virial velocity and as predicted by theory within cold accretion models (Rosdahl & Blaizot 2012; Cornuault et al. 2018), given the estimated DM halo mass. In the case of infall along the filaments, our observations would suggest that the initial (virial) velocity is progressively reduced as the flows proceed into the hot medium with which they interact, or betray the changing direction of the gas filaments while inspiraling towards the center of the potential well. Indeed, inflow models (Danovich et al. 2015; Mandelker et al. 2020a) do not predict a reduction in the absolute speed of the filaments while moving from the outskirts to the core but do predict projection effects where the gradient arises from the bending of the filaments inside the halo. This also appears to be more consistent with the kinematics of the SE filament, which shows evidence for a local velocity gradient from the velocity map (Fig. 10a). If due to rotation, this might also represent a lower-mass DM halo in the process of merging into the larger system. Intriguingly, we currently find no obvious individual galaxy associated with this putative sub-halo.
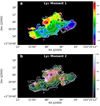 |
Fig. 10. Lyα velocity map (top; moment 1) and velocity dispersion map (bottom; moment 2; de-convolved by instrumental resolution). Color bar levels of both maps (right scale) are expressed in km s−1. We only show pixels where moment errors are below 50 km s−1. ALMA continuum sources are shown as black contours in both panels. White contours show the Lyα surface brightness levels from Fig. 2. |
The moment-2 (velocity dispersion; Fig. 10b) map shows typical local velocity dispersions in the range of 200−300 km s−1 (de-convolved by the instrumental resolution), about half of the virial velocity (classifying RO-1001 as a dynamically cold nebula) but higher than the expected thermal broadening of the cold ∼104 K gas (few tens km s−1), as expected for multiphased, cloudy accretion flows in which streams do not remain highly collimated (McCourt et al. 2018; Cornuault et al. 2018). The observed velocity gradient between the edge of the filaments and the core, together with the velocity dispersion increasing towards the core, allows us to obtain a rough estimate of the cold gas mass flow within a scenario where we are indeed observing cold accretion, assuming that the initial kinetic energy of the cold gas ( ) is partly transformed into turbulence (
 ) and partly radiated away (mainly via Lyα). Such calculations suggest that 10−30% of the initial energy is converted into turbulence (Cornuault et al. 2018), with a cold mass flow rate of 1000−2000 M⊙ yr−1. This corresponds to a penetration efficiency (as defined by Dekel et al. 2013) of the order of 10−20%. This infall rate approximates the ongoing SFR, but only a fraction of this would reach the galaxies, consistent with the requirement that the system must be heading to a downfall of the activity in a few dynamical timescales (a few Gyr), and eventually quenching (e.g., by z < 2).
Quantitative comparison of these kinematic features to expectations from an outflow scenario is hampered by the fact that we are not aware of detailed modeling of Lyα emission filaments produced by outflows from AGNs or star formation in galaxies. However, qualitatively it appears that any attempt to reproduce these features, and in particular the filaments, with AGN outflows would require substantial fine-tuning. Those AGN outflows would be expected to be observed with of order 1000−2000 km s−1 velocities (e.g., Kakkad et al. 2020), and there should be at least three prominent outflows currently visible with presumably different launching directions. All of this seems hard to reconcile with the moderate velocity dispersion of the Lyα nebula, whose full velocity range at zero intensity hardly reaches 1000 km s−1. In terms of velocities, the velocity gradient observed from the core to the outer edges of the two most prominent filaments, at the level of 400−500 km s−1 would also be difficult to explain.
3.3. Lyα radiative transfer modeling
The spectrum of the Lyα emission in the core of the nebula is reported in Fig. 11d, showing a double-peaked shape, with the blue component stronger than the red one. This is an inversion of what is observed in most Lyα-emitting galaxies at both low- (Kunth et al. 1998; Henry et al. 2015; Yang et al. 2016; Rivera-Thorsen et al. 2015) and high redshift (Erb et al. 2014; Orlitová et al. 2018; Matthee et al. 2017; Herenz et al. 2017) where the observation of a stronger red peak is associated with outflows (Kulas et al. 2012), hence here suggesting infall (see Ao et al. 2020 for a Lyα blob showing similar spectral properties).
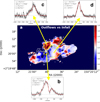 |
Fig. 11. Ratio between the integrated flux of the redshifted and blueshifted components (panel a) – shown by color coding in the image (right scale) – from a ROHSA analysis of the deeper low-spectral-resolution data. Blue (red) colors correspond to infall-(outflow-)dominated regions. ALMA continuum sources are shown as black contours. White contours show the Lyα surface brightness levels from Fig. 2. Yellow-dotted contours show the regions where spectra were extracted using the higher spectral resolution data, as shown in panels b–d. Observed spectra are shown as black continuous lines, while best fitting modeling from the shell models in Sect. 3.3 are shown in red for the observed spectrum and dotted black for the intrinsic spectrum. Resulting constraints on physical quantities are labeled (vexp is the bulk velocity of the shell; Δ is the systemic velocity). The spectrum in panel d shows a prominent blue peak and is integrated over most of the core of the nebula, with the exception of the NE corner whose spectrum is shown in panel c and is characterized by a prominent red peak. Panel b: region with the largest velocity dispersion from Fig. 10b. |
We modeled the spectra accounting for radiative transfer effects, that is, we take into account scattering, frequency redistribution, and scattering out and back into the line-of-sight. To do so, we employ radiative transfer models computed using the Monte-Carlo radiative transfer code tlac (Gronke & Dijkstra 2014) which follows the trajectories of individual ‘photon packages’ through frequency- and real-space. We assume the hydrogen and dust to be located in a shell surrounding the emission site. This ‘shell model’ (Ahn et al. 2003; Verhamme et al. 2006) consists of a moving concentric shell of neutral hydrogen and dust which surrounds a central Lyα-(and continuum-)emitting source. The appropriate HI absorption cross-sections (depending on relative velocity and also temperature) are implemented. This setup introduces at least five parameters: the neutral hydrogen column density NHI, the dust optical depth τd, the velocity of the shell vexp (defined to be positive when outflowing), the (effective) temperature of the shell T (incorporating any small-scale turbulence), and the width of the intrinsic Gaussian line σi. This is admittedly simplistic but provides qualitatively similar results to spherical clouds, with either an illuminating central point source or a uniform distribution over the volume (Verhamme et al. 2006), and even a multiphase medium with high clumping factor as discussed above (Gronke et al. 2017). Specifically, we fitted the observed (continuum-subtracted) Lyα spectrum using an improved pipeline originally described in Gronke et al. (2015). This pipeline consists of 12 960 models covering the (NHI, vexp, T) parameter space, and the other parameters are modeled in post-processing. To the five parameters above, we also added the systemic redshift which we allowed to vary within [ − 700, 400] km s−1 of z = 2.9154 (corresponding to the velocity range spanned by individual CO[3−2] detections in the group). Furthermore, we modeled the effect of the spectral resolution by smoothing the synthetic spectra with a Gaussian with FWHM of 150 km s−1, equal to the resolution of the BM dataset. In order to sample the posterior distribution sufficiently, we used the tempered affine invariant Monte Carlo sampler of the Python package emcee (Goodman & Weare 2010) We chose to employ ten temperatures, 200 walkers, and 2000 steps that we found to be sufficient to sample the posterior.
For all fitted spectra (panels b–d in Fig. 11) the fitting returns moderately low column densities of neutral hydrogen, at the level of 1017 − 18.5 cm−2, suggesting fairly reduced radiative transfer effects that cause the observed Lyα profile to be weakly distorted with respect to the intrinsic profiles (dotted black lines in panels b–d in Fig. 11). This would support the conclusion that the inferred systemic velocities and dispersions previously measured from the Lyα moments are reliable (meaning that moments computed on the observed and on the intrinsic Lyα profiles are very close), as is often observed in Lyα blobs (Herenz et al. 2020).
The blueshift-dominated spectral shape requires an overall average infalling velocity of vinfall ∼ 150 km s−1. The systemic velocity is close to our zero-velocity scale, which is defined as the Lyα flux-weighted velocity of the full nebula, and is consistent with the average CO[3−2] redshifts of the three ALMA galaxies. This is consistent with such emission originating from gas at rest with respect to the center of the potential well, on average. Observations of nonresonant lines would allow us to confirm this feature, and all results from shell modeling in general.
Several hotter regions with 400−500 km s−1 dispersion are evident (red spots in Fig. 10b): it is tempting to interpret them as possible shock fronts from the incoming material surrounding the core regions where gas density is highest. Modeling the spectra supports this idea, recovering higher HI column densities at one of the most conspicuous locations (Fig. 11b).
For a region around galaxy ‘A’, the spectral shape is reversed (Fig. 11c), with the red component being stronger. This red-dominated spectrum is fitted as originating at a systemic velocity of 326 km s−1; shifted in the direction of the CO[3−2] velocity inferred for the underlying galaxy ‘A’ (460 km s−1). It is currently difficult to decipher whether such a velocity offset is due to relative motion with respect to the center of the system, or to a Hubble flow effect that would require a physical separation of about 1 Mpc along the line of sight. The prevalence of the red peak suggests, in any case, an overall outflowing velocity of voutflow ∼ 200 km s−1. The red-core emission is thus best understood as coming from outflows likely originating from galaxy ‘A’. If this is the case, the modest velocity offsets and flow-velocities suggest star-formation-driven outflows (consistent with our estimates in Table 3), given that for AGN-driven outflows some 1000−2000 km s−1 velocity offsets would be expected.
Gas flows, energetics, and Lyα production.
3.4. Lyα double Gaussian decomposition
It would be very instructive to also be able to carry out a detailed spectral analysis along the filaments, evaluating whether or not the spectral shapes are mostly blueshifted there as well. However, these filaments are detected at high S/N only in the lower spectral resolution data. We therefore decompose pixel-by-pixel with double Gaussians the lower-resolution Lyα spectra over the whole nebula using ROHSA (Marchal et al. 2019), a multi-Gaussian decomposition algorithm based on a regularized nonlinear least-square criterion that takes into account the spatial coherence of the emission. Here we choose to decompose the signal into a sum of N = 2 Gaussians in order to capture the basic effects of resonant scattering, producing blueshifted and redshifted components (Fig. 11). The model of the emission is then
 (1)
(1)
with θ(r) = (θ1(r),…,θn(r)) and where
 (2)
(2)
is parametrized by θn = (an, μn, σn) with an ≥ 0 being the amplitude, μn the position, and σn the standard deviation 2D maps of the nth Gaussian profile. The estimated parameters  are obtained by minimizing the cost function as described in Marchal et al. (2019). The latter includes a Laplacian filtering to penalize the small-scale fluctuation of each 2D map of parameters. We note that in order to perform this minimization, the whole emission cube is fitted at once. The strength of this filtering is controlled by three hyper-parameters λa = 10, λμ = 4000, and λσ = 4000. These parameters have been empirically chosen to obtain a spatially coherent solution of
  with the smallest residual
  . We find a median absolute residual of 2.3%, showing that N = 2 provides a good spatially coherent description of the signal.
We obtain spatially resolved maps of the ratio of redshifted to blueshifted components (Fig. 11a), which can be used to gain insight into where either infall or outflow might prevail. The result of this analysis is that infall could also dominate along the two main filaments, except for a few regions that instead appear to be dominated by outflows, similarly to the core (including possibly the whole Northern filament). These spectral profiles suggest that the filaments are globally infalling. However, definitive confirmation will only come with higher spatial and spectral resolution spectroscopy of the same regions.
4. Discussion and interpretation
As is typically the case with giant Lyα nebulae, there are two fundamental questions that arise concerning their nature: (1) What is the origin of the cold Lyα-emitting gas? (2) What is the energy source of the emission? In order to gain physical insight into these questions for the RO-1001 nebula, it is relevant to compare with nebulae found in QSO/radio-galaxy fields (Borisova et al. 2016) that are known to reach similar luminosities and maximum spatial extent. However, in RO-1001 there is no evidence of ongoing (obscured or not) AGN activity from ultra-deep Chandra and mid-IR constraints (see Sect. 2.6). A summary of relevant physical quantities and energetics comparing the RO-1001 nebula and QSO nebulae is reported in Table 3. We would like to reiterate that a key ingredient in this comparison is the assessment of the hosting DM halo mass, which is presented in this paper for RO-1001 and available statistically for the average QSO. The lack of this crucial information for Lyman Alpha Blobs from the literature prevents us from extending the same comparison to those objects.
4.1. Origin of the cold gas: inflow and outflow rates
Regarding question (1) on the origin of the cold, diffuse, intra-group gas shining in Lyα, there are two main primary channels that need to be evaluated and, ideally, distinguished: cosmological inflows, mainly expected to be a function of the DM halo mass and redshift, and outflows from AGNs/galaxies, which depend on the AGN bolometric luminosity and galaxy SFRs. It is also important to evaluate secondary channels, namely the returning gas from outflows in the form of galactic fountains, and the cold gas that results from cooling due to hydrodynamic instabilities in the IGM arising from the interaction between rapidly moving outflows/inflows and the hot gas. However, they are directly related to the primary channels, given that for example the amount of hydrodynamic cooling that results from outflows (e.g., Qiu et al. 2020) largely depends on the outflow rates and the same is true for inflows. Similarly, we would ascribe the galactic fountains as mainly related to outflows (even if the gas is infalling). We therefore focus our discussion on the primary channels.
For the case of the QSO nebulae, outflow rates driven by AGNs (derived using the scaling relations in Fiore et al. (2017) based on the average bolometric luminosity of 1047 erg s−1) are expected to exceed inflow rates by at least two orders of magnitude (Table 3). This makes efforts to reveal infalling gas in those systems particularly challenging: the putative observational features of any infalling gas would have to be distinguished from those of the vastly larger amount of gas originating from outflows (and at least in part returning in the form of fountains). The QSO-field inflow rates are conservatively (over-)estimated using a maximally large hosting DM halo for QSOs of 3 × 10¹² M⊙, where the best estimate from clustering is instead 1 × 10¹² M⊙ (see Pezzulli & Cantalupo 2019).
The situation is reversed for the case of RO-1001: given the AGN luminosity upper limits and ongoing SFRs, infalling gas rates are expected to exceed outflow rates by one order of magnitude. Most of the outflowing gas mass is expected to be SFR-driven rather than AGN-driven; see Table 3. For SFR-driven outflows we assume a loading factor of 1, with outflow rates from star formation equal to SFRs, which is plausible given the large stellar masses (Hopkins et al. 2012; Newman et al. 2012; Gabor & Bournaud 2014; Hayward & Smith 2015).
Hence, in relative terms, for the RO-1001 group with respect to QSO fields, we estimate a ratio of gas mass inflow to outflow rate that is three orders of magnitude (a factor of 1000) higher (roughly speaking, in QSOs the ratio of inflow/outflow rate is expected to be of order 10−2, while in RO-1001 it is of order 10). On the other hand, the larger hosting DM halo of RO-1001 will result in a higher proportion of the outflowing gas being retained in the system’s deeper potential well and being recycled onto the galaxies via galactic fountains. This likely somewhat reduces the expected order of magnitude contrast between nearly pristine cosmological inflowing gas and material ejected from member galaxies via outflows (see, e.g., Valentino et al. 2016)3. Similarly, it is possible that not all the predicted cosmological inflows remain cold while penetrating the halo, as discussed in the previous section, although instabilities from the flowing gas will generate secondary cold gas within the halo. Finally, when considering that the gas might be accumulating over longer timescales, the impact of AGN outflows in QSO fields might be somewhat reduced, noting that the survival time of the cold gas (Klein et al. 1994; Valentino et al. 2016; Schneider & Robertson 2017) is not necessarily much longer than QSO variation timescales (both of the order of 10 Myr). This point is still debated, and longer gas survival times might be possible (Gronke & Oh 2018; Mandelker et al. 2019). Nonetheless, the higher impact of accretion relative to outflows in RO-1001 over QSO fields is likely to remain significant.
4.2. Energetics
Regarding question (2) concerning the powering source, relevant channels are: ionization from AGNs or star formation, or dissipation of kinetic energy carried out either by outflows from the same AGN/SFR or from inflows from the cosmic web, ultimately due to gravitational energy.
4.2.1. AGN photoionization
For the case of photoionization, the observed Lyα luminosity in RO-1001 corresponds to ∼1.5 × 1055 hydrogen ionizing photons. Scaling from CL 1449 calculations (Valentino et al. 2016), this ionizing photon rate requires an AGN with a bolometric luminosity of LAGN ∼ 3.5 × 1045 erg s−1. In the RO-1001 nebula, our limit on AGN activity (or equivalently assuming ongoing AGN activity at the cosmic average given the stellar mass and SFR present; Delvecchio et al. 2020), implies that < 60% of the required photons are produced. When considering that the typical Lyman continuum escape for moderate AGNs is ∼30% (reducing the effective energy to 20% of that needed to ionize the nebula), and that not all photons will likely power the Lyα nebula due to geometry constraints, covering factors, and so on, we conclude that AGN ionization cannot produce the observed Lyα. As discussed in Sect. 2.6, the possibility that a bright QSO just switched off seems very unlikely: the probability of finding a luminous QSO associated with our massive galaxies is < 10−4. Finally, a skeleton with three filaments onto a giant Lyα nebula is hardly compatible with a spherical or conical geometry generally associated with QSO illumination.
For the QSO nebulae, Lyα emission is generally assumed to be powered by QSO ionization and subsequent recombination, which indeed is the most energetic source (Table 3) given the average QSO luminosity of 1047 erg s−1, providing 40 times more ionizing photons than required to account for the typical Lyα nebulae in these environments.
4.2.2. Energy injected from AGNs and SF outflows
We compute luminosity rates that can be induced by outflows as their mass flow multiplied by their typical velocity squared. Calculations of gas mass outflow rates for QSOs and for the RO-1001 nebula are reported in Sect. 4.1 and Table 3. We assume typical velocities of 500 km s−1 (1000 km s−1) for SF (AGN) outflows.
For the RO-1001 group, the SF-driven outflows (with a smaller possible contribution from AGN outflows) would carry out of the galaxies just as much energy as that observed in Lyα. However, most of it would be dissipated via thermal instabilities and only a (small) fraction of this energy would emerge reprocessed by Lyα (Valentino et al. 2016; effective energies lower by an order of magnitude with respect to total; see also Table 3). Also, their modest velocities might prevent them from reaching large distances from the ALMA galaxies (which contain most of the SFR in the RO-1001 structure). We therefore expect that outflows could contribute locally, but likely not dominate.
For QSOs, outflows carry 20 times the energy required to power the typical observed Lyα luminosities and with much higher velocities than star-formation-driven outflows, and are therefore possibly far reaching. They might thus contribute a sizeable amount of the observed Lyα energy when dissipating in the circumgalactic medium (see also Ji et al. 2019; Gronke & Oh 2020a; Fielding et al. 2020). Even accounting for substantial inefficiencies in Lyα production (as discussed previously for RO-1001), their role in contributing to the powering of QSO nebulae might have been underestimated so far (Table 3).
4.2.3. Ionization from star forming galaxies
While this channel is negligible for QSOs Lyα nebulae (when compared to the QSO ionization), for RO-1001 the output from the ongoing SFR from the three ALMA galaxies is potentially capable of producing ten times more ionizing photons than are needed to ionize the Lyα nebula. This channel must therefore be carefully investigated for the RO-1001 group.
The ALMA galaxies are highly obscured. Even assuming typical attenuation properties of normal main sequence galaxies of the same stellar mass (Pannella et al. 2015) would imply that only a small fraction of ionizing photons and Lyα photons can actually escape such galaxies on average. This number could be even smaller if these sources are obscured, as in typical submillimeter galaxies (SMGs; Simpson et al. 2017; Jin et al. 2019; Calabrò et al. 2018, 2019), as IR-luminous massive galaxies at high z tend to be (Elbaz et al. 2018; Puglisi et al. 2019). We emphasize that, unlike AGN obscurations, dust attenuation in star-forming galaxies is not expected to be highly anisotropic in the ultraviolet (UV; it is not driven by a torus), as demonstrated for example by the tight relation between dust extinction and stellar mass (Garn & Best 2010; Kashino et al. 2013). Hence we estimate what fraction of the ionizing photons (or Lyα photons) can escape the SF galaxies in RO-1001 by first evaluating the UV rest-frame output of these sources towards our direction. The brightest object in the UV is galaxy ‘C’ (Fig. 7), which also has some weak Lyα enhancement at its position (Fig. 2). We estimated its UV SFR from the observed flux at 1500 Å rest-frame derived from the photometry in the V and R-bands, and using the conversion from Daddi et al. (2004). This returns an estimate of 2.5 M⊙ yr−1 at the level of 1% of the IR SFR for this galaxy (which contains 20% of the total IR from the group). Galaxies A and B have much less than 1% of the intrinsic UV radiation (as inferred from the IR) being emitted in the UV after escaping dust extinction. Therefore, in total, the emerging, unattenuated UV SFR corresponds to < 3 × 10⁻³ of the SFR = 1200 M⊙ yr−1 seen in the IR, corresponding already to a negligible < 3% fraction of the photons required to power the observed Lyα nebula. The overall effective output from SF galaxies would hardly change when considering additional UV-selected galaxies in the RO-1001 overdensity (Fig. 7; we note that additional UV-bright sources aligned with the nebula as visible in Figs. 2 and 7 are in the foreground).
Still, further reductions have to be considered. For example, to predict the emerging Lyα flux from the ongoing SFR, additional differential attenuation between the UV rest frame and Lyα must be included. It has been shown locally that in ultra-luminous IR galaxies (ULIRGs) the relative escape fraction of Lyα with respect to far-UV unattenuated regions is typically at the level of 0.1%, albeit reaching 10% in one peculiar case (Martin et al. 2015b). Hence, we can expect Lyα directly produced by the SFR in RO-1001 to be entirely negligible, including Lyα photons directly produced at the sites of the ALMA galaxies and any contribution from scattering out of these sources. In terms of computing the Lyman continuum escape from the SFR in RO-1001, required to ionize hydrogen and produce Lyα by recombination, one has to further account for additional extinction between Lyα and wavelengths below the Lyman break, including absorption by the HI gas within the galaxies.
Finally, it is intriguing to consider whether or not a large, additional population of faint low-mass star forming galaxies, unseen to current limits and potentially attenuation-free, could produce the observed Lyα. Using deep Subaru Suprime-CAM imaging in VRI bands places a 5σ lower limit of EW > 500 Å (rest-frame) on the diffuse Lyα equivalent width, using regions where no detectable continuum is present in the current UV rest-frame imaging. This is high enough to exclude diffuse in-situ star formation (e.g., Lyα originating in large numbers of low-mass, star-forming galaxies). The consistency between the integrated flux from ALMA sources with the SCUBA2 total flux also supports this conclusion, leaving little room for any further diffuse SFR component.
4.2.4. Gravitational energy
For the DM halo estimated for RO-1001, the energy associated (Faucher-Giguère et al. 2010) with cosmological gas accretion is 160 times what is required to power the nebula. This exceeds all other sources of energy by about two orders of magnitude (Table 3). In the case of QSOs, the same calculations show that gravitational energy connected with gas accretion is barely comparable to the energy required to power the nebulae, and is 100 times smaller than the energy that can be produced in Lyα by QSO photoionization. This energy therefore clearly plays a negligible role given the overall poor efficiency of converting such energy into Lyα photons.
In a RO-1001-like halo, the emerging Lyα radiation powered by gravitational energy has been predicted by existing models (Dijkstra & Loeb 2009; Goerdt et al. 2010; Rosdahl & Blaizot 2012; Laursen et al. 2019) to be of the order of 1044 erg s−1, fully consistent with what is observed here, and at the level of a few percent of the total available gravitational energy. On the other hand, predictions for the much smaller QSO halos from the same studies return average Lyα luminosities that are approximately ten times smaller than what is observed on average.
It is worth noting that giant radio-galaxies are typically hosted in much more massive halos than luminous QSOs (see, e.g., Nusser & Tiwari 2015), and therefore they might behave more similarly to RO-1001 in terms of energetics, with proportionally larger contributions from gravitational energy associated to accreting gas. Although the presence of the bright radio AGNs complicates the observational interpretation of those systems, evidence for Lyα powered by streams was discussed by Vernet et al. (2017) for MRC 0316−257 at z = 3.12, and a remarkable case of accretion of molecular gas was presented by Emonts et al. (2021) for 4C 41.17 at z = 3.792.
4.2.5. Cooling from the X-ray gas
Localized runaway cooling might occur in the densest regions of the hot X-ray halo due to the onset of thermal instabilities (Gaspari et al. 2012; Sharma et al. 2012). The thermal cascade would then result in the emission of Lya photons which might contribute on scales smaller than our resolution. This mechanism is the basis for the self-regulated feedback that is able to successfully explain several observed features of the ionized filaments in local cool-core clusters (Voit & Donahue 2015). However, this mechanism is unlikely to explain the extreme Lyα/X-ray luminosity ratio of the giant nebula in RO1001 and similar objects, considering both a classical stationary cooling flow (Geach et al. 2009) or empirically comparing to the observed values of Lyα/X-ray ratios of cool-core clusters, which are orders of magnitude lower than what we observe in RO-1001 (see also discussions on this topic in Valentino et al. 2016, for Cl1449 at z = 1.99).
4.2.6. Conclusions on the energetics
In conclusion, energetic arguments strongly favor cooling via radiation-dissipated gravitational energy as the most plausible channel for the (collisional or shock) excitation of Lyα emission in RO-1001 nebula. This channel is providing two orders of magnitude more energy than any other plausible channel for RO-1001. This is in contrast to QSO nebulae, where the combined effect of QSO photoionization and outflows provides two orders of magnitude more energy than gravitation. Hence this results in a contrast of four orders of magnitude (factor of 104) in relative terms between the RO-1001 and QSO fields in terms of the likelihood of revealing Lyα powered ultimately by gravitational energy release.
4.3. The origin of Lyα in RO-1001
In light of these results, it is relevant to re-evaluate which process might be responsible for the Lyα emission. The classic expectation would be collisionally excited Lyα from the cold gas dissipating kinetic energy acquired via the gravitational energy. In order to be viable this would require a non-negligible neutral fraction in the gas. The formal HI column density inferred from Lyα modeling (Sect. 3.1; Fig. 11) is fairly low, and its sufficiency for this purpose is uncertain. For example, assuming the rough calculation of flowing gas mass reported in Sect. 3.1 and using the virial velocity and virial radius to compute the timescale corresponds to a fraction of neutral hydrogen mass over total gas mass of order 10−3. This is still compatible with collisional excitation without the need to advocate photoionization from currently unknown sources, if the cold gas temperature is a few 104 K (e.g., see Fig. 1 in Cantalupo et al. 2008). Moreover, it should be emphasized that the HI column density and infall/outflow velocities inferred from the shell modeling reported in Sect. 3.1 and Fig. 11 must be considered as strict lower limits. This is because the emerging spectrum is strongly weighted by sightlines with the lowest column densities, given that Lyα escapes through the paths of least resistance (e.g., Eide et al. 2018), generally orthogonal to the stream velocities in case of infall (Gronke et al. 2017).
Nevertheless, we note that an alternative scenario suggested by recent modeling is that radiation is emitted through the cooling of mixed gas occurring at the boundary between the phases (Mandelker et al. 2019; Cornuault et al. 2018). In that case, Lyα radiation would originate from the combined dissipation of the kinetic energy of the stream and the thermal energy from the mixed gas that cools down (Gronke & Oh 2020a).
This scenario, and our calculations of gas mass flows in Sect. 3.1, also imply a total cold gas mass present at each moment in the diffuse streams of the order of 1011 M⊙ (to be compared to the lower limit of ≈108 M⊙ of neutral hydrogen). Is that a reasonable gas mass to be diffused into the intra-group gas? On the one hand, this is comparable to or smaller than the ISM mass of all group galaxies combined, and less than 10% of all baryons expected to be in the group given its DM estimate and assuming a universal baryon fraction. Assuming pressure equilibrium, the flowing gas would need to be confined in clouds with quite a small volume filling factor, of order 10−3 to 10−5, which is qualitatively similar to what is discussed in theoretical works (e.g., Cornuault et al. 2018; McCourt et al. 2018; Gronke & Oh 2020b). This is required to reach a high-enough density to compensate for the much larger temperature of the hot medium. Such dense gas clouds would produce copious recombination Lyα photons following photoionization, if a source emitting enough ionizing photons towards this medium were to be present. This does not appear to be the case for RO-1001, at least given the evidence presented here.
5. Summary and conclusions
The main findings of this work can be summarized as follows:
-
RO-1001 is a group at z = 2.91 defined by four galaxies with stellar masses above 1011 M⊙, originally selected as an overdensity of faint radio sources (12σ excess) over a small, 10″ region.
-
The group contains an ongoing SFR of 1200 M⊙ yr−1 mostly spread among three ALMA-detected, IR-luminous sources characterized by very compact IR sizes, for which we reported CO[3−2] detections with NOEMA.
-
RO-1001 does not contain any detectable evidence of ongoing AGN activity, down to limits that are consistent with a cosmic average co-existence of an AGN and SFR at typical levels.
-
The hosting DM halo mass is estimated to be typical for a group, with ∼4 × 10¹³ M⊙ consistently derived using three methods, including a blind X-ray measurement with significance of 3.1σ.
-
RO-1001 hosts a giant Lyα halo with a luminosity of 1.3 × 1044 erg s−1 as revealed by KCWI observations. Three Lyα filaments are observed extending over an overall area of 300 kpc (comparable to the virial diameter of RO-1001) and converging into the bright Lyα core whose luminosity peak is well aligned with the center of mass of the group.
-
The Lyα emission is fairly ‘cold’, with a velocity dispersion of about 250 km s−1. The absolute velocity at the edge of the filaments is of ‘the order of 400−500 km s−1 higher than in the core, and comparable to the virial velocity.
-
The Lyα spectral profile in most of the core appears to be dominated by blueshifted components, as well as in the two main filaments as derived by multi-Gaussian decompositions. Evidence for regions dominated by redshifted components in Lyα exists as well.
-
Shell modeling of the blueshifted emission in the core suggests the presence of inflowing gas with moderate velocity (150 km s−1) and column densities of neutral gas (a few 1017 cm−2) arising from a rest-frame velocity consistent with the average one as traced by CO in the ALMA galaxies. This supports the Lyα moments analysis as being relatively unaffected by resonant scattering.
-
From the point of view of expected rates of gas flows given the hosting DM halo masses and ongoing SF and AGN activity, cold gas inflows from the cosmic web are expected to dominate over outflows by up to an order of magnitude in RO-1001. This corresponds to a relative contrast of three orders of magnitude with respect to Lyα nebulae hosted by luminous QSOs (where inflows from the cosmic web are expected to be two orders of magnitude smaller than outflows).
-
From the point of view of Lyα powering and energetics, the gravitational energy associated with the gas infall can provide two orders of magnitude more energy than required to power the observed Lyα nebula in RO-1001, and over two orders of magnitude more energy than any other plausible source. Again, this corresponds to a relative contrast of four orders of magnitude with respect to QSO fields (where the Lyα is powered by photoionization and subsequent recombinations, with a possible contribution from outflows).
-
A large range of observational properties of the RO-1001 Lyα nebula are consistent with predictions from cold accretion models for halos of the same DM halo mass. This includes the overall luminosity, surface brightness levels, area, velocity and velocity dispersion, linear and transverse sizes of the filaments, and of course the canonical number of three filaments (Danovich et al. 2012).
In conclusion, RO-1001 at z = 2.91 provides a plausible observation of gas accretion towards a massive potential well (Fig. 9), with its filaments possibly identifiable with cold accretion streams, but where the effects of phase mixing, dissipation, and local cooling also seem important. Knowledge of the mass and position of the center of mass of the RO-1001 group is crucial information that was not available for other known filamentary nebulae and sets a clear new precedent for future research on this topic.
Of course, several uncertainties remain. We do see evidence that, even in RO-1001, outflowing gas is still playing some non-negligible role, and it is extremely difficult to definitely rule out photoionization as the dominant mechanism for Lyα emission. Further insight could be obtained if we were able to obtain measurements of nonresonant lines that, as discussed in Sect. 3.2, would allow a more solid modeling of the Lyα emission in terms of unveiling the supposed prevalence of inflows while at the same time providing more robust kinematics and velocity dispersion fields. Observations of Hα with JWST could be illuminating, also keeping in mind that fairly weak Hα emission would be expected if Lyα is predominantly collisionally excited. Similarly, UV metal line observations would provide constraints on ionization and enrichment, potentially clarifying whether or not we are seeing fairly pristine gas being accreted, for example at least at the edge of the filaments. All of this will have to wait for future follow-up studies of RO-1001 and other structures in coming years.
It is not certain that trying to observe Lyα around other (nonQSO) structures hosted in lower mass halos would provide an advantage in terms of finding more convincing probes of infalling gas than what we can gather so far in RO-1001. In relative terms, the higher fraction of the inflowing gas that could remain cold after entering lower mass halos would be counterbalanced by the lower contrast between infall and outflows owing to the different scaling of these terms with mass and to the increased loading factor of outflows from lower mass galaxies. In absolute terms, the Lyα luminosities of infalling gas would be suppressed, roughly proportionally to the hosting halo mass, according to model predictions. Furthermore, it is also not certain that model predictions are –even roughly– correct. We emphasize here how predictions of Lyα emission from cold streams for a RO-1001-like halo are very close to the observed Lyα luminosity. On the other hand, models might be simplistic. We mention above that BCG assembly happens early in the models compared to observations, affecting in some way how gas is fueled to galaxies in the inner halos. Given that cold streams are driven by gravity, which in turn are mostly affected by the total DM distribution rather than the location of individual galaxies, this discrepancy would likely have little effect on the reliability of cold accretion predictions –at least on relatively large scales. However, it might signal problems in the models rendition of how the accreting gas is reaching galaxies at the center of massive halos at high redshifts. More specifically in terms of Lyα, Faucher-Giguère et al. (2010) suggested that accounting for self-shielding and properly treating subresolution effects might easily lead to reduced forecasts of the Lyα emission by one or more orders of magnitude. Rosdahl & Blaizot (2012) predict a substantially higher neutral fraction than is inferred from our shell modeling of the emerging spectrum. If these latter predictions are accurate (but beware that column density from shell modeling provides strict lower limits to real average column densities; see comments in Sect. 4.3), then their calculations of emerging Lyα emission might also be overestimated, given that collisional excitation luminosity scales with neutral gas density. Needless to say, if models are optimistic by large factors then it might become prohibitive to ever detect any signature of cold accretion from Lyα emission. Ultimately, future generations of models capturing physical effects that currently remain subresolution will be crucial for interpreting this and future observations in terms of cold gas accretion.
The environments of QSOs have provided a remarkable and diverse population of giant Lyα nebulae, but due to the presence of the photoionizing quasar, it will be prohibitively difficult to use those to securely argue for the detection of a cold cosmological flow. In the present paper, we show that follow-up of massive, high-redshift groups and/or clusters (e.g., as in this case from radio-based selection of overdensities) can lead to the discovery of a new class of giant Lyα nebulae, whose emission is plausibly powered by the collisional ionization of a cosmological cold flow. Additional studies of giant Lyα nebulae centered on massive high-redshift DM halos will provide new constraints on this process, which may be important in fueling the rise of giant clusters and massive galaxies.
CSTACK is publicly available at: http://lambic.astrosen.unam.mx/cstack/
This is equivalent to saying that the outflowing gas would be seen when outflowing, and when part of it is recycled back to the galaxies, implying that the outflowing contributions listed in Table 3 would have to be counted with a factor slightly above 1 (but well less than 2).
Acknowledgments
We are indebted to Sebastiano Cantalupo for use of his CubeEx software and for enlightening discussions. We also thank Matt Lehnert, Avishai Dekel, Nir Mandelker, Anne Verhamme, and Mauro Giavalisco for discussions. This work includes observations carried out with the IRAM NOEMA Interferometer. F.V. acknowledges support from the Carlsberg Foundation Research Grant CF18-0388 “Galaxies: Rise And Death” and the Cosmic Dawn Center of Excellence funded by the Danish National Research Foundation under then Grant No. 140. RMR acknowledges financial support from HST-GO-15910. MG was supported by NASA through the NASA Hubble Fellowship grant HST-HF2-51409 and acknowledges support from HST grants HST-GO-15643.017-A, HST-AR-15039.003-A, and XSEDE grant TG-AST180036. AP acknowledges financial support from STFC through grants ST/T000244/1 and ST/P000541/1. S.J. acknowledges financial support from the Spanish Ministry of Science, Innovation and Universities (MICIU) under AYA2017-84061-P, co-financed by FEDER (European Regional Development Funds). VS acknowledges support from the ERC-StG ClustersXCosmo grant agreement 716762. IRAM is supported by INSU/CNRS (France), MPG (Germany) and IGN (Spain). This paper makes use of data from ALMA: a partnership of ESO (representing its member states), NSF (USA) and NINS (Japan), together with NRC (Canada), MOST and ASIAA (Taiwan), and KASI (Republic of Korea), in cooperation with the Republic of Chile. The Joint ALMA Observatory is operated by ESO, AUI/NRAO and NAOJ. The National Radio Astronomy Observatory is a facility of the National Science Foundation operated under cooperative agreement by Associated Universities, Inc. This work was supported by the Programme National Cosmology et Galaxies (PNCG) of CNRS/INSU with INP and IN2P3, co-funded by CEA and CNES.
References
- Ahn, S.-H., Lee, H.-W., & Lee, H. M. 2003, MNRAS, 340, 863 [Google Scholar]
- Ao, Y., Zheng, Z., Henkel, C., et al. 2020, Nat. Astron., 4, 670 [CrossRef] [Google Scholar]
- Arrigoni, Battaia F., Prochaska, J. X., Hennawi, J. F., et al. 2018, MNRAS, 473, 3907 [NASA ADS] [CrossRef] [Google Scholar]
- Arrigoni, Battaia F., Hennawi, J. F., Prochaska, J. X., et al. 2019, MNRAS, 482, 3162 [NASA ADS] [CrossRef] [Google Scholar]
- Bacon, R., Accardo, M., Adjali, L., et al. 2010, Proc. SPIE, 7735, 773508 [Google Scholar]
- Behroozi, P., & Silk, J. 2018, MNRAS, 477, 5382 [NASA ADS] [CrossRef] [Google Scholar]
- Béthermin, M., Daddi, E., Magdis, G., et al. 2015, A&A, 573, A113 [NASA ADS] [CrossRef] [EDP Sciences] [Google Scholar]
- Birnboim, Y., & Dekel, A. 2003, MNRAS, 345, 349 [NASA ADS] [CrossRef] [Google Scholar]
- Borisova, E., Cantalupo, S., Lilly, S. J., et al. 2016, ApJ, 831, 39 [NASA ADS] [CrossRef] [Google Scholar]
- Bouché, N., Murphy, M. T., Kacprzak, G. G., et al. 2013, Science, 341, 50 [Google Scholar]
- Bouché, N., Finley, H., Schroetter, I., et al. 2016, ApJ, 820, 121 [NASA ADS] [CrossRef] [Google Scholar]
- Cai, Z., Cantalupo, S., Prochaska, J. X., et al. 2019, ApJS, 245, 23 [NASA ADS] [CrossRef] [Google Scholar]
- Calabrò, A., Daddi, E., Cassata, P., et al. 2018, ApJ, 862, L22 [NASA ADS] [CrossRef] [Google Scholar]
- Calabrò, A., Daddi, E., Puglisi, A., et al. 2019, A&A, 623, A64 [NASA ADS] [CrossRef] [EDP Sciences] [Google Scholar]
- Cantalupo, S., Porciani, C., & Lilly, S. J. 2008, ApJ, 672, 48 [Google Scholar]
- Cantalupo, S., Arrigoni-Battaia, F., Prochaska, J. X., Hennawi, J. F., & Madau, P. 2014, Nature, 506, 63 [NASA ADS] [CrossRef] [Google Scholar]
- Cantalupo, S., Pezzulli, G., Lilly, S. J., et al. 2019, MNRAS, 483, 5188 [NASA ADS] [CrossRef] [Google Scholar]
- Chen, Y., Steidel, C. C., Hummels, C. B., et al. 2020, MNRAS, 499, 1721 [Google Scholar]
- Civano, F., Marchesi, S., Comastri, A., et al. 2016, ApJ, 819, 62 [Google Scholar]
- Coogan, R. T., Daddi, E., Sargent, M. T., et al. 2018, MNRAS, 479, 703 [NASA ADS] [Google Scholar]
- Cornuault, N., Lehnert, M. D., Boulanger, F., & Guillard, P. 2018, A&A, 610, A75 [NASA ADS] [CrossRef] [EDP Sciences] [Google Scholar]
- Cortzen, I., Magdis, G. E., Valentino, F., et al. 2020, A&A, 634, L14 [EDP Sciences] [Google Scholar]
- Daddi, E., Cimatti, A., Renzini, A., et al. 2004, ApJ, 617, 746 [Google Scholar]
- Daddi, E., Dickinson, M., Morrison, G., et al. 2007, ApJ, 670, 156 [Google Scholar]
- Daddi, E., Dannerbauer, H., Elbaz, D., et al. 2008, ApJ, 673, L21 [Google Scholar]
- Daddi, E., Bournaud, F., Walter, F., et al. 2010, ApJ, 713, 686 [Google Scholar]
- Daddi, E., Jin, S., Strazzullo, V., et al. 2017, ApJ, 846, L31 [Google Scholar]
- Danovich, M., Dekel, A., Hahn, O., & Teyssier, R. 2012, MNRAS, 422, 1732 [NASA ADS] [CrossRef] [Google Scholar]
- Danovich, M., Dekel, A., Hahn, O., Ceverino, D., & Primack, J. 2015, MNRAS, 449, 2087 [NASA ADS] [CrossRef] [Google Scholar]
- Dekel, A., & Mandelker, N. 2014, MNRAS, 444, 2071 [NASA ADS] [CrossRef] [Google Scholar]
- Dekel, A., Birnboim, Y., Engel, G., et al. 2009, Nature, 457, 451 [Google Scholar]
- Dekel, A., Zolotov, A., Tweed, D., et al. 2013, MNRAS, 435, 999 [NASA ADS] [CrossRef] [Google Scholar]
- Delvecchio, I., Daddi, E., Aird, J., et al. 2020, ApJ, 892, 17 [Google Scholar]
- Dijkstra, M., & Loeb, A. 2009, MNRAS, 400, 1109 [NASA ADS] [CrossRef] [Google Scholar]
- Eide, M. B., Gronke, M., Dijkstra, M., & Hayes, M. 2018, ApJ, 856, 156 [NASA ADS] [CrossRef] [Google Scholar]
- Elbaz, D., Daddi, E., Le Borgne, D., et al. 2007, A&A, 468, 33 [NASA ADS] [CrossRef] [EDP Sciences] [Google Scholar]
- Elbaz, D., Leiton, R., Nagar, N., et al. 2018, A&A, 616, A110 [NASA ADS] [CrossRef] [EDP Sciences] [Google Scholar]
- Emonts, B. H. C., et al. 2021, Science, submitted [Google Scholar]
- Erb, D. K., Steidel, C. C., Trainor, R. F., et al. 2014, ApJ, 795, 33 [NASA ADS] [CrossRef] [Google Scholar]
- Farina, E. P., Arrigoni-Battaia, F., Costa, T., et al. 2019, ApJ, 887, 196 [NASA ADS] [CrossRef] [Google Scholar]
- Faucher-Giguère, C.-A., Kereš, D., Dijkstra, M., Hernquist, L., & Zaldarriaga, M. 2010, ApJ, 725, 633 [NASA ADS] [CrossRef] [Google Scholar]
- Fielding, D. B., Ostriker, E. C., Bryan, G. L., & Jermyn, A. S. 2020, ApJ, 894, L24 [Google Scholar]
- Fiore, F., Feruglio, C., Shankar, F., et al. 2017, A&A, 601, A143 [NASA ADS] [CrossRef] [EDP Sciences] [Google Scholar]
- Finlator, K., Davé, R., Papovich, C., & Hernquist, L. 2006, ApJ, 639, 672 [NASA ADS] [CrossRef] [Google Scholar]
- Fu, H., Xue, R., Prochaska, J. X., et al. 2021, ApJ, 908, 188 [Google Scholar]
- Gabor, J. M., & Bournaud, F. 2014, MNRAS, 437, L56 [NASA ADS] [CrossRef] [Google Scholar]
- Garn, T., & Best, P. N. 2010, MNRAS, 409, 421 [NASA ADS] [CrossRef] [Google Scholar]
- Gaspari, M., Ruszkowski, M., & Sharma, P. 2012, ApJ, 746, 94 [Google Scholar]
- Geach, J. E., Alexander, D. M., Lehmer, B. D., et al. 2009, ApJ, 700, 1 [NASA ADS] [CrossRef] [Google Scholar]
- Genzel, R., Tacconi, L. J., Lutz, D., et al. 2015, ApJ, 800, A20 [Google Scholar]
- Giavalisco, M., Vanzella, E., Salimbeni, S., et al. 2011, ApJ, 743, 95 [NASA ADS] [CrossRef] [Google Scholar]
- Gilli, R., Comastri, A., & Hasinger, G. 2007, A&A, 463, 79 [NASA ADS] [CrossRef] [EDP Sciences] [Google Scholar]
- Gobat, R., Daddi, E., Onodera, M., et al. 2011, ApJ, 526, A133 [Google Scholar]
- Gobat, R., Daddi, E., Coogan, R. T., et al. 2019, ApJ, 629, A104 [Google Scholar]
- Goerdt, T., Dekel, A., Sternberg, A., et al. 2010, MNRAS, 407, 613 [Google Scholar]
- Goodman, J., & Weare, J. 2010, Commun. Appl. Math. Comput. Sci., 5, 65 [Google Scholar]
- Gronke, M., & Dijkstra, M. 2014, MNRAS, 444, 1095 [NASA ADS] [CrossRef] [Google Scholar]
- Gronke, M., & Oh, S. P. 2018, MNRAS, 480, L111 [NASA ADS] [CrossRef] [Google Scholar]
- Gronke, M., & Oh, S. P. 2020a, MNRAS, 492, 1970 [CrossRef] [Google Scholar]
- Gronke, M., & Oh, S. P. 2020b, MNRAS, 494, L27 [CrossRef] [Google Scholar]
- Gronke, M., Bull, P., & Dijkstra, M. 2015, ApJ, 812, 123 [Google Scholar]
- Gronke, M., Dijkstra, M., McCourt, M., & Oh, S. P. 2017, A&A, 607, A71 [NASA ADS] [CrossRef] [EDP Sciences] [Google Scholar]
- Guo, Y., Maiolino, R., Jiang, L., et al. 2020, ApJ, 898, 26 [Google Scholar]
- Hayward, C. C., & Smith, D. J. B. 2015, MNRAS, 446, 1512 [NASA ADS] [CrossRef] [Google Scholar]
- Hennawi, J. F., Prochaska, J. X., Cantalupo, S., & Arrigoni-Battaia, F. 2015, Science, 348, 779 [NASA ADS] [CrossRef] [PubMed] [Google Scholar]
- Henry, A., Scarlata, C., Martin, C. L., & Erb, D. 2015, ApJ, 809, 19 [NASA ADS] [CrossRef] [Google Scholar]
- Herenz, E. C., Urrutia, T., Wisotzki, L., et al. 2017, A&A, 606, A12 [NASA ADS] [CrossRef] [EDP Sciences] [Google Scholar]
- Herenz, E. C., Hayes, M., & Scarlata, C. 2020, A&A, 642, A55 [CrossRef] [EDP Sciences] [Google Scholar]
- Hopkins, P. F., Quataert, E., & Murray, N. 2012, MNRAS, 421, 3522 [Google Scholar]
- Ilbert, O., Salvato, M., Le Floc’h, E., et al. 2010, ApJ, 709, 644 [NASA ADS] [CrossRef] [Google Scholar]
- Ji, S., Oh, S. P., & Masterson, P. 2019, MNRAS, 487, 737 [Google Scholar]
- Jin, S., Daddi, E., Liu, D., et al. 2018, ApJ, 864, 56 [Google Scholar]
- Jin, S., Daddi, E., Magdis, G. E., et al. 2019, ApJ, 887, 144 [Google Scholar]
- Kakkad, D., Mainieri, V., Vietri, G., et al. 2020, A&A, 642, A147 [CrossRef] [EDP Sciences] [Google Scholar]
- Kashino, D., Silverman, J. D., Rodighiero, G., et al. 2013, ApJ, 777, L8 [NASA ADS] [CrossRef] [Google Scholar]
- Katz, N., Keres, D., Dave, R., & Weinberg, D. H. 2003, Astrophys. Space Sci. Lib., 281, 185 [Google Scholar]
- Kereš, D., Katz, N., Weinberg, D. H., & Davé, R. 2005, MNRAS, 363, 2 [Google Scholar]
- Klein, R. I., McKee, C. F., & Colella, P. 1994, ApJ, 420, 213 [NASA ADS] [CrossRef] [Google Scholar]
- Kulas, K. R., Shapley, A. E., Kollmeier, J. A., et al. 2012, ApJ, 745, 33 [NASA ADS] [CrossRef] [Google Scholar]
- Kunth, D., Mas-Hesse, J. M., Terlevich, E., et al. 1998, A&A, 334, 11 [NASA ADS] [Google Scholar]
- Laigle, C., McCracken, H. J., Ilbert, O., et al. 2016, ApJS, 224, 24 [NASA ADS] [CrossRef] [Google Scholar]
- Lauer, T. R., Postman, M., Strauss, M. A., Graves, G. J., & Chisari, N. E. 2014, ApJ, 797, 82 [Google Scholar]
- Laursen, P., Sommer-Larsen, J., & Razoumov, A. O. 2011, ApJ, 728, 52 [NASA ADS] [CrossRef] [Google Scholar]
- Laursen, P., Sommer-Larsen, J., Milvang-Jensen, B., Fynbo, J. P. U., & Razoumov, A. O. 2019, A&A, 627, A84 [NASA ADS] [CrossRef] [EDP Sciences] [Google Scholar]
- Leauthaud, A., Finoguenov, A., Kneib, J.-P., et al. 2010, ApJ, 709, 97 [NASA ADS] [CrossRef] [Google Scholar]
- Lilly, S. J., Carollo, C. M., Pipino, A., Renzini, A., & Peng, Y. 2013, ApJ, 772, 119 [NASA ADS] [CrossRef] [Google Scholar]
- Magdis, G. E., Daddi, E., Béthermin, M., et al. 2012, ApJ, 760, 6 [NASA ADS] [CrossRef] [Google Scholar]
- Mandelker, N., Nagai, D., Aung, H., et al. 2019, MNRAS, 484, 1100 [Google Scholar]
- Mandelker, N., van den Bosch, F. C., Nagai, D., et al. 2020a, MNRAS, 498, 2415 [CrossRef] [Google Scholar]
- Mandelker, N., Nagai, D., Aung, H., et al. 2020b, MNRAS, 494, 2641 [CrossRef] [Google Scholar]
- Marchal, A., Miville-Deschênes, M.-A., Orieux, F., et al. 2019, A&A, 626, A101 [NASA ADS] [CrossRef] [EDP Sciences] [Google Scholar]
- Martin, C. L., Shapley, A. E., Coil, A. L., et al. 2012, ApJ, 760, 127 [NASA ADS] [CrossRef] [Google Scholar]
- Martin, D. C., Matuszewski, M., Morrissey, P., et al. 2015a, Nature, 524, 192 [NASA ADS] [CrossRef] [Google Scholar]
- Martin, C. L., Dijkstra, M., Henry, A., et al. 2015b, ApJ, 803, 6 [NASA ADS] [CrossRef] [Google Scholar]
- Martin, D. C., O’Sullivan, D., Matuszweski, M., et al. 2019, Nat. Astron., 3, 822 [CrossRef] [Google Scholar]
- Matthee, J., Sobral, D., Darvish, B., et al. 2017, MNRAS, 472, 772 [NASA ADS] [CrossRef] [Google Scholar]
- McCourt, M., Oh, S. P., O’Leary, R., & Madigan, A.-M. 2018, MNRAS, 473, 5407 [NASA ADS] [CrossRef] [Google Scholar]
- Mo, H. J., & White, S. D. M. 2002, MNRAS, 336, 112 [NASA ADS] [CrossRef] [Google Scholar]
- Morrissey, P., Matuszewski, M., Martin, D. C., et al. 2018, ApJ, 864, 93 [NASA ADS] [CrossRef] [Google Scholar]
- Mullaney, J. R., Daddi, E., Béthermin, M., et al. 2012, ApJ, 753, L30 [NASA ADS] [CrossRef] [Google Scholar]
- Muzzin, A., Marchesini, D., Stefanon, M., et al. 2013, ApJS, 206, 8 [Google Scholar]
- Neill, J. D., & Matuszewski, M. 2018, https://doi.org/10.5281/zenodo.1287322 [Google Scholar]
- Neistein, E., & Dekel, A. 2008, MNRAS, 388, 1792 [NASA ADS] [CrossRef] [Google Scholar]
- Nelson, D., Genel, S., Vogelsberger, M., et al. 2015, MNRAS, 448, 59 [NASA ADS] [CrossRef] [Google Scholar]
- Newman, S. F., Genzel, R., Förster-Schreiber, N. M., et al. 2012, ApJ, 761, 43 [NASA ADS] [CrossRef] [Google Scholar]
- Noeske, K. G., Weiner, B. J., Faber, S. M., et al. 2007, ApJ, 660, L43 [Google Scholar]
- Nusser, A., & Tiwari, P. 2015, ApJ, 812, 85 [NASA ADS] [CrossRef] [Google Scholar]
- Orlitová, I., Verhamme, A., Henry, A., et al. 2018, A&A, 616, A60 [NASA ADS] [CrossRef] [EDP Sciences] [Google Scholar]
- O’Sullivan, D. B., Martin, C., Matuszewski, M., et al. 2020, ApJ, 894, 3 [Google Scholar]
- Overzier, R. A. 2016, A&ARv, 24, 14 [NASA ADS] [CrossRef] [Google Scholar]
- Pannella, M., Elbaz, D., Daddi, E., et al. 2015, ApJ, 807, 141 [NASA ADS] [CrossRef] [Google Scholar]
- Pezzulli, G., & Cantalupo, S. 2019, MNRAS, 486, 1489 [NASA ADS] [CrossRef] [Google Scholar]
- Popping, G., Pillepich, A., Somerville, R. S., et al. 2019, ApJ, 882, 137 [NASA ADS] [CrossRef] [Google Scholar]
- Puglisi, A., Daddi, E., Liu, D., et al. 2019, ApJ, 877, L23 [Google Scholar]
- Qiu, Y., Bogdanović, T., Li, Y., McDonald, M., & McNamara, B. R. 2020, Nat. Astron., 4, 900 [CrossRef] [Google Scholar]
- Rivera-Thorsen, T. E., Hayes, M., Östlin, G., et al. 2015, ApJ, 805, A14 [NASA ADS] [CrossRef] [Google Scholar]
- Rodighiero, G., Brusa, M., Daddi, E., et al. 2015, ApJ, 800, L10 [CrossRef] [Google Scholar]
- Rosdahl, J., & Blaizot, J. 2012, MNRAS, 423, 344 [NASA ADS] [CrossRef] [Google Scholar]
- Rubin, K. H. R., Prochaska, J. X., Koo, D. C., & Phillips, A. C. 2012, ApJ, 747, L26 [NASA ADS] [CrossRef] [Google Scholar]
- Sargent, M. T., Béthermin, M., Daddi, E., & Elbaz, D. 2012, ApJ, 747, L31 [NASA ADS] [CrossRef] [Google Scholar]
- Saro, A., Borgani, S., Tornatore, L., et al. 2009, MNRAS, 392, 795 [CrossRef] [Google Scholar]
- Schneider, E. E., & Robertson, B. E. 2017, ApJ, 834, 144 [CrossRef] [Google Scholar]
- Schreiber, C., Elbaz, D., Pannella, M., et al. 2018, A&A, 609, A30 [NASA ADS] [CrossRef] [EDP Sciences] [Google Scholar]
- Scoville, N., Abraham, R. G., Aussel, H., et al. 2007, ApJS, 172, 38 [NASA ADS] [CrossRef] [Google Scholar]
- Schulze, A., Silverman, J. D., Daddi, E., et al. 2019, MNRAS, 488, 1180 [NASA ADS] [CrossRef] [Google Scholar]
- Sharma, P., McCourt, M., Quataert, E., & Parrish, I. J. 2012, MNRAS, 420, 3174 [NASA ADS] [CrossRef] [Google Scholar]
- Simpson, J. M., Smail, I., Swinbank, A., et al. 2017, ApJ, 839, 58 [NASA ADS] [CrossRef] [Google Scholar]
- Somerville, R. S., & Davé, R. 2015, ARA&A, 53, 51 [Google Scholar]
- Steidel, C. C., Erb, D. K., Shapley, A. E., et al. 2010, ApJ, 717, 289 [NASA ADS] [CrossRef] [Google Scholar]
- Strazzullo, V., Gobat, R., Daddi, E., et al. 2013, ApJ, 772, 118 [NASA ADS] [CrossRef] [Google Scholar]
- Strazzullo, V., Daddi, E., Gobat, R., et al. 2016, ApJ, 833, L20 [NASA ADS] [CrossRef] [Google Scholar]
- Tacconi, L. J., Genzel, R., Neri, R., et al. 2010, Nature, 463, 781 [Google Scholar]
- Tremmel, M., Quinn, T. R., Ricarte, A., et al. 2019, MNRAS, 483, 3336 [NASA ADS] [CrossRef] [Google Scholar]
- Tumlinson, J., Peeples, M. S., & Werk, J. K. 2017, ARA&A, 55, 389 [NASA ADS] [CrossRef] [Google Scholar]
- Turner, M. L., Schaye, J., Crain, R. A., et al. 2017, MNRAS, 471, 690 [NASA ADS] [CrossRef] [Google Scholar]
- Umehata, H., Fumagalli, M., Smail, I., et al. 2019, Science, 366, 97 [Google Scholar]
- Valentino, F., Daddi, E., Strazzullo, V., et al. 2015, ApJ, 801, 132 [NASA ADS] [CrossRef] [Google Scholar]
- Valentino, F., Daddi, E., Finoguenov, A., et al. 2016, ApJ, 829, 53 [NASA ADS] [CrossRef] [Google Scholar]
- van der Burg, R. F. J., Muzzin, A., Hoekstra, H., et al. 2013, A&A, 557, A15 [NASA ADS] [CrossRef] [EDP Sciences] [Google Scholar]
- van der Burg, R. F. J., Muzzin, A., Hoekstra, H., et al. 2014, A&A, 561, A79 [NASA ADS] [CrossRef] [EDP Sciences] [Google Scholar]
- Veilleux, S., Maiolino, R., Bolatto, A. D., & Aalto, S. 2020, A&ARv, 28, 2 [NASA ADS] [CrossRef] [Google Scholar]
- Verhamme, A., Schaerer, D., & Maselli, A. 2006, A&A, 460, 397 [NASA ADS] [CrossRef] [EDP Sciences] [Google Scholar]
- Vernet, J., Lehnert, M. D., De Breuck, C., et al. 2017, A&A, 602, L6 [NASA ADS] [CrossRef] [EDP Sciences] [Google Scholar]
- Voit, G. M., & Donahue, M. 2015, ApJ, 799, L1 [Google Scholar]
- Walter, F., Carilli, C., Neeleman, M., et al. 2020, ApJ, 902, 111 [Google Scholar]
- Wang, T., Elbaz, D., Daddi, E., et al. 2016, ApJ, 828, 56 [NASA ADS] [CrossRef] [Google Scholar]
- Yang, H., Malhotra, S., Gronke, M., et al. 2016, ApJ, 820, 130 [NASA ADS] [CrossRef] [Google Scholar]
- Zabl, J., Bouché, N. F., Schroetter, I., et al. 2019, MNRAS, 485, 1961 [NASA ADS] [CrossRef] [Google Scholar]
- Zinger, E., Dekel, A., Birnboim, Y., et al. 2018, MNRAS, 476, 56 [NASA ADS] [CrossRef] [Google Scholar]
Appendix A: Signal-to-noise ratio per pixel
We show in Fig. A.1 the S/N of the Lyα detection in the original, unsmoothed map.
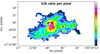 |
Fig. A.1. Signal-to-noise ratio per pixel in the original, unsmoothed data, over the region of the RO-1001 nebula within the area where a detection is found in the adaptively smoothing map, shown by color coding in the image (right scale). The flux error in each pixel is already enlarged to account for correlated noise (see Sect. 2). ALMA continuum sources are shown as black contours. White contours show the Lyα surface brightness levels from Fig. 2. |
All Tables
All Figures
|
Fig. 1. Lyα image from KCWI observations of the RO-1001 group. The three extended filaments that are clearly traced by Lyα are labeled. The corresponding Lyα surface brightness levels can be gauged from Fig. 2. |
| In the text | |
|
Fig. 2. Deep optical-NIR imaging of the RO-1001 group from UltraVISTA Ks and J (red and green) and Subaru Suprime-CAM (combined VRI bands; blue), over a 30″ × 40″ field of view. The green contours show the Lyα surface brightness from Fig. 1 in steps of 0.5 dex, from a few 10−17 s−1 erg cm−2 arcsec−2 (center) to ×30 lower surface brightness (filaments). The three ALMA/VLA sources are labeled (ABC; white contours), together with a fourth massive galaxy (D) which is a candidate quiescent object in the structure. We note that further luminous objects aligned with the Lyα emission are in the foreground; see e.g., the Lyα depression coincident with the two sources in the East filament, which we interpret as being due to dust absorption. |
| In the text | |
|
Fig. 3. ALMA 343 GHz continuum mosaic image with primary beam attenuation correction (the color bar shows Jy beam−1). The image reaches an rms of ∼50 μJy beam−1 at the center, at the resolution of 0.15″. Contours show the Lyα emission. |
| In the text | |
|
Fig. 4. NOEMA observations. The top row shows continuum images, the second row integrated CO[3−2] line emission, and the third row shows the spectra. Different columns correspond to sources A, B, and C, as labeled. The NOEMA spectrum of source A, extracted at the well-determined continuum position (S/N = 8) shows a faint 3.5σ line, at the velocity of the Lyα line at the same position. The Lyα spectra extracted over a PSF at the same location as the galaxies are shown as red dashed histograms, shifted in the plots to lower zero-level for easier comparison. The Lyα spectra are from the lower resolution, higher S/N KCWI cube. The cross in each map is ±2″ and marks the position of the phase center of the NOEMA observations. |
| In the text | |
|
Fig. 5. Integrated SED over the RO-1001 field (see Table 2 for the photometric points). The cyan, purple, and red lines are BC03 stellar template, DL07 cold (ambient) dust, and DL07 warm (PDR) dust, respectively. The radio excess is within a factor of two of the average radio–IR correlation, and is therefore not very significant, but may be associated with galaxy ‘C’, which shows a somewhat elongated radio morphology suggestive of a weak jet. Instead, the SED leaves no room for the presence of AGN torus emission in the mid-IR, with an upper limit on its bolometric luminosity of LAGN < 2 × 1045 erg s−1. |
| In the text | |
|
Fig. 6. Multiband imaging of the RO-1001 field from Ks, Spitzer IRAC, Herschel PACS and SPIRE, SCUBA2, AzTEC, ALMA, and radio (as labeled). Each cutout is 50″ wide. |
| In the text | |
|
Fig. 7. HST imaging of the field in the F814W filter, single orbit (Scoville et al. 2007). The image is smoothed with a Gaussian with the same FWHM as the PSF (0.1″) to enhance visibility of faint features; the color bar shows relative pixel fluxes. Green contours show the Lyα emission. Blue circles are Lyα emitters identified inside the nebula from the KCWI data (within 2000 km s−1): the small offsets with respect to the HST positions are a combined effect of the noise in the Lyα cube affecting their recovery and the accuracy of the astrometric solution of the KCWI cube. Cyan circles mark two galaxies in the structure identified from UV absorption, and red circles show the positions of the ALMA galaxy detections. |
| In the text | |
|
Fig. 8. X-ray contours (1 and 2σ) from Chandra+XMM overlayed over the VLA 3 GHz image of the RO-1001 field. The offset between the X-ray peak and the Lyα peak (yellow cross) is entirely consistent with arising from noise. The 3.1σ signal measurement is obtained integrating the emission over a region centered at the RO-1001 centroid and with 24″ radius (set to avoid a bright, unrelated point X-ray source that is increasing the noise substantially). The insert in the bottom-right corner shows a zoom onto source C, allowing a clear view of its elongated shape. The bright, left-most radio source is a low-redshift interloper. |
| In the text | |
|
Fig. 9. Fourth-nearest neighbor projected density map of massive galaxies in RO-1001. Black contours are from ALMA detections. We note the excellent coincidence of the Lyα emission (contours) with the potential well of the RO-1001 halo as traced by its massive galaxies. The color scale is in units of the number of galaxies per square degree. |
| In the text | |
|
Fig. 10. Lyα velocity map (top; moment 1) and velocity dispersion map (bottom; moment 2; de-convolved by instrumental resolution). Color bar levels of both maps (right scale) are expressed in km s−1. We only show pixels where moment errors are below 50 km s−1. ALMA continuum sources are shown as black contours in both panels. White contours show the Lyα surface brightness levels from Fig. 2. |
| In the text | |
|
Fig. 11. Ratio between the integrated flux of the redshifted and blueshifted components (panel a) – shown by color coding in the image (right scale) – from a ROHSA analysis of the deeper low-spectral-resolution data. Blue (red) colors correspond to infall-(outflow-)dominated regions. ALMA continuum sources are shown as black contours. White contours show the Lyα surface brightness levels from Fig. 2. Yellow-dotted contours show the regions where spectra were extracted using the higher spectral resolution data, as shown in panels b–d. Observed spectra are shown as black continuous lines, while best fitting modeling from the shell models in Sect. 3.3 are shown in red for the observed spectrum and dotted black for the intrinsic spectrum. Resulting constraints on physical quantities are labeled (vexp is the bulk velocity of the shell; Δ is the systemic velocity). The spectrum in panel d shows a prominent blue peak and is integrated over most of the core of the nebula, with the exception of the NE corner whose spectrum is shown in panel c and is characterized by a prominent red peak. Panel b: region with the largest velocity dispersion from Fig. 10b. |
| In the text | |
|
Fig. A.1. Signal-to-noise ratio per pixel in the original, unsmoothed data, over the region of the RO-1001 nebula within the area where a detection is found in the adaptively smoothing map, shown by color coding in the image (right scale). The flux error in each pixel is already enlarged to account for correlated noise (see Sect. 2). ALMA continuum sources are shown as black contours. White contours show the Lyα surface brightness levels from Fig. 2. |
| In the text | |
Current usage metrics show cumulative count of Article Views (full-text article views including HTML views, PDF and ePub downloads, according to the available data) and Abstracts Views on Vision4Press platform.
Data correspond to usage on the plateform after 2015. The current usage metrics is available 48-96 hours after online publication and is updated daily on week days.
Initial download of the metrics may take a while.