Fig. 4.
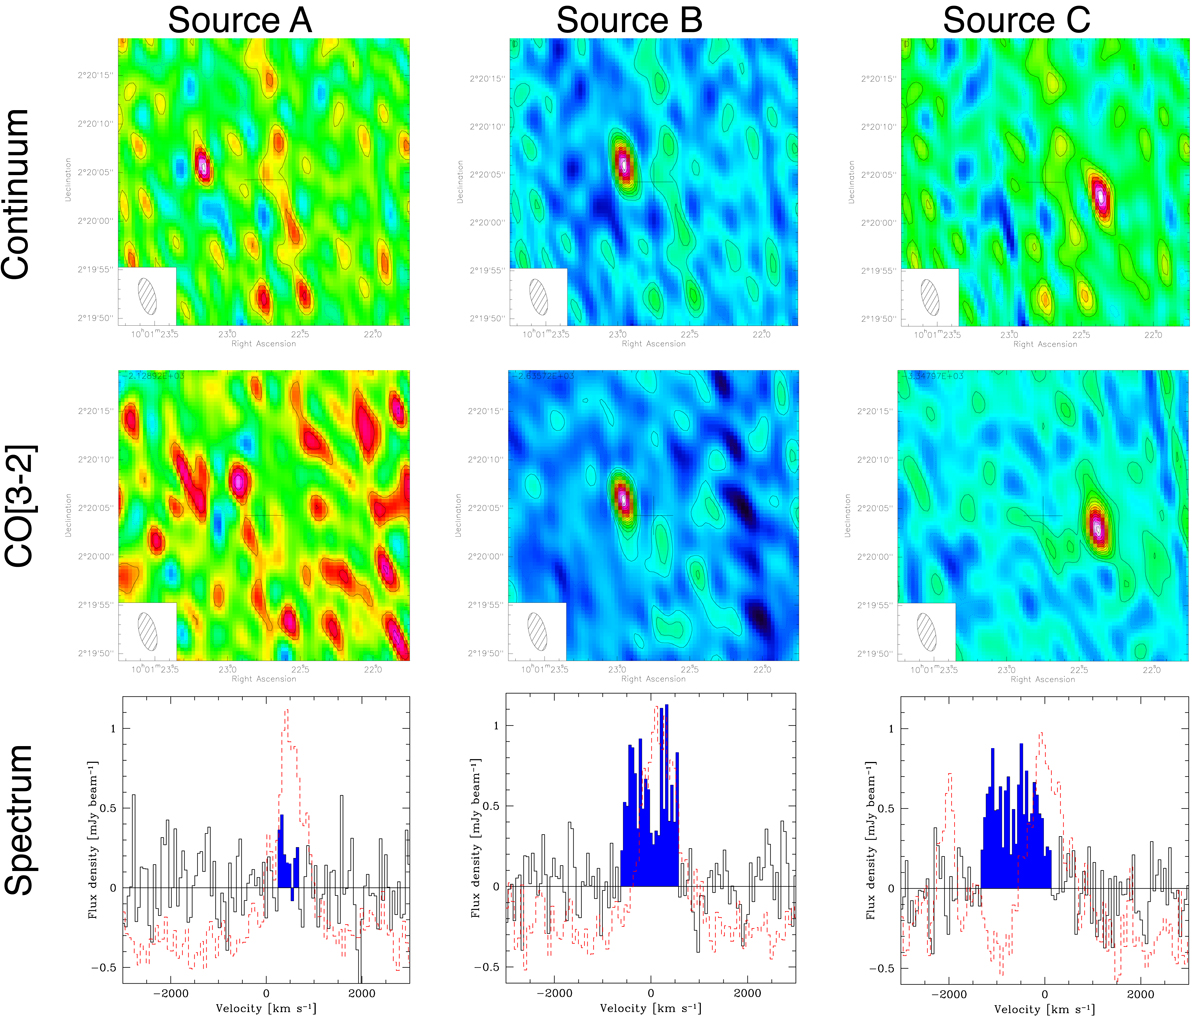
NOEMA observations. The top row shows continuum images, the second row integrated CO[3−2] line emission, and the third row shows the spectra. Different columns correspond to sources A, B, and C, as labeled. The NOEMA spectrum of source A, extracted at the well-determined continuum position (S/N = 8) shows a faint 3.5σ line, at the velocity of the Lyα line at the same position. The Lyα spectra extracted over a PSF at the same location as the galaxies are shown as red dashed histograms, shifted in the plots to lower zero-level for easier comparison. The Lyα spectra are from the lower resolution, higher S/N KCWI cube. The cross in each map is ±2″ and marks the position of the phase center of the NOEMA observations.
Current usage metrics show cumulative count of Article Views (full-text article views including HTML views, PDF and ePub downloads, according to the available data) and Abstracts Views on Vision4Press platform.
Data correspond to usage on the plateform after 2015. The current usage metrics is available 48-96 hours after online publication and is updated daily on week days.
Initial download of the metrics may take a while.