Fig. 8.
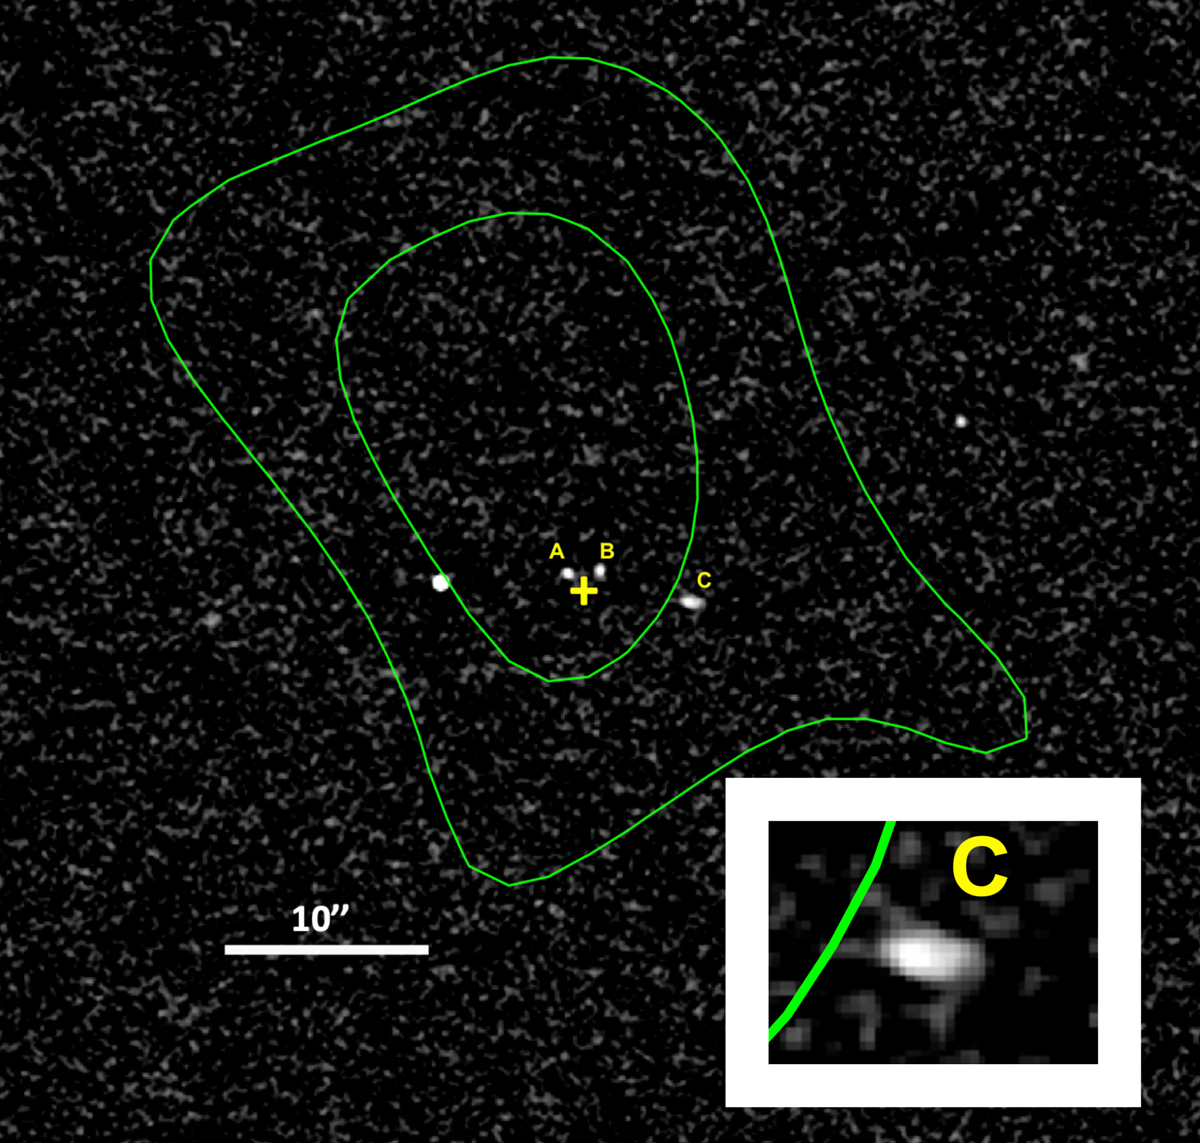
X-ray contours (1 and 2σ) from Chandra+XMM overlayed over the VLA 3 GHz image of the RO-1001 field. The offset between the X-ray peak and the Lyα peak (yellow cross) is entirely consistent with arising from noise. The 3.1σ signal measurement is obtained integrating the emission over a region centered at the RO-1001 centroid and with 24″ radius (set to avoid a bright, unrelated point X-ray source that is increasing the noise substantially). The insert in the bottom-right corner shows a zoom onto source C, allowing a clear view of its elongated shape. The bright, left-most radio source is a low-redshift interloper.
Current usage metrics show cumulative count of Article Views (full-text article views including HTML views, PDF and ePub downloads, according to the available data) and Abstracts Views on Vision4Press platform.
Data correspond to usage on the plateform after 2015. The current usage metrics is available 48-96 hours after online publication and is updated daily on week days.
Initial download of the metrics may take a while.