Fig. 11.
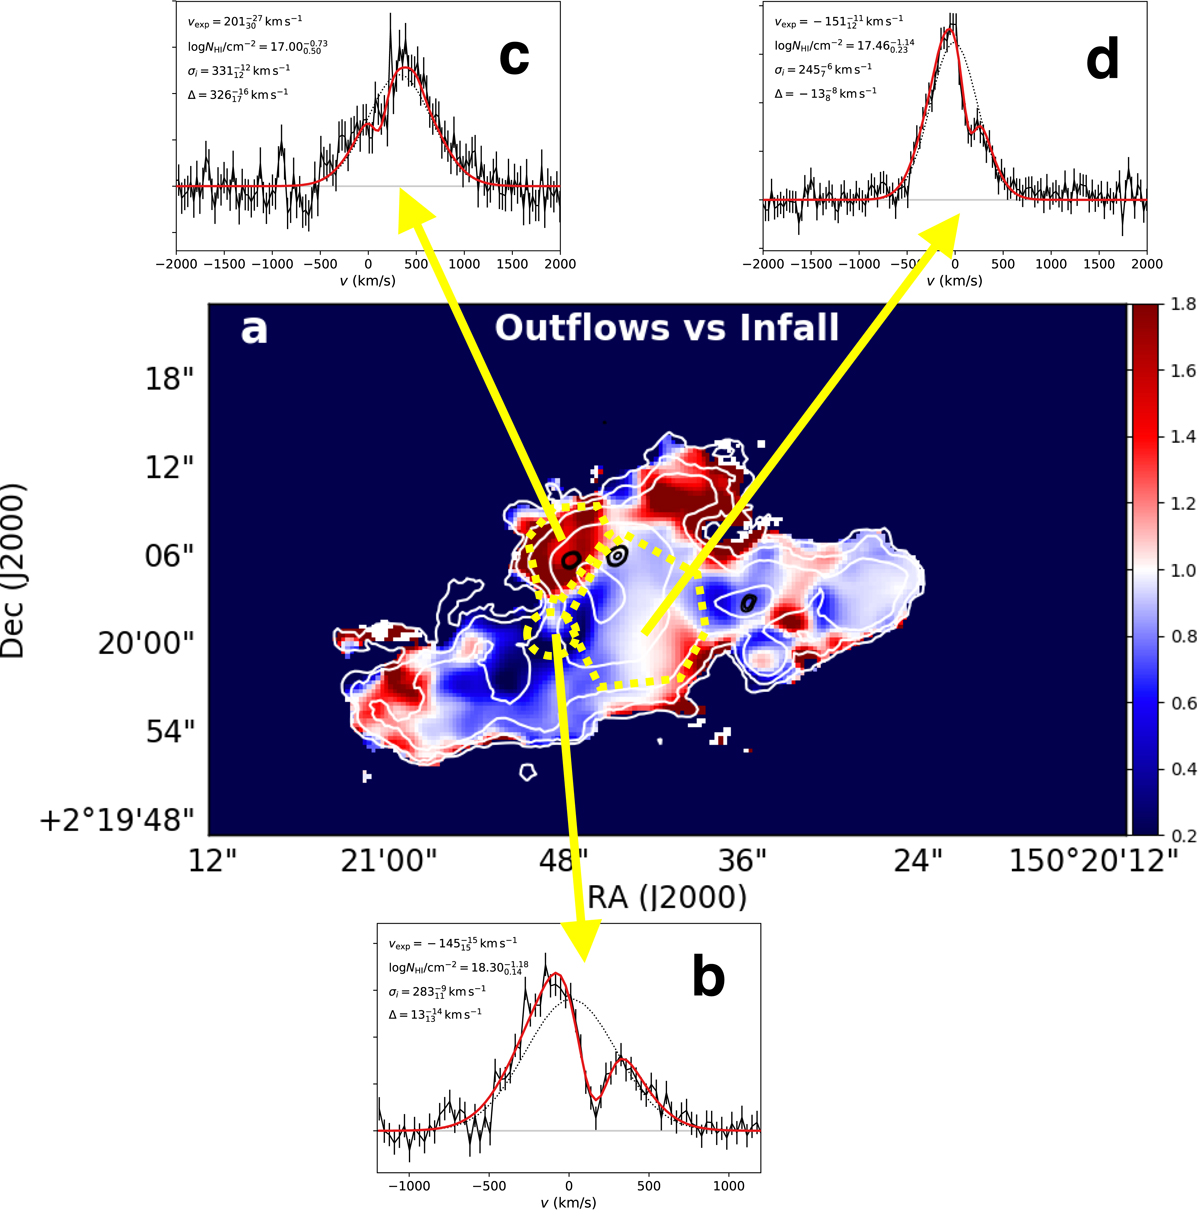
Ratio between the integrated flux of the redshifted and blueshifted components (panel a) – shown by color coding in the image (right scale) – from a ROHSA analysis of the deeper low-spectral-resolution data. Blue (red) colors correspond to infall-(outflow-)dominated regions. ALMA continuum sources are shown as black contours. White contours show the Lyα surface brightness levels from Fig. 2. Yellow-dotted contours show the regions where spectra were extracted using the higher spectral resolution data, as shown in panels b–d. Observed spectra are shown as black continuous lines, while best fitting modeling from the shell models in Sect. 3.3 are shown in red for the observed spectrum and dotted black for the intrinsic spectrum. Resulting constraints on physical quantities are labeled (vexp is the bulk velocity of the shell; Δ is the systemic velocity). The spectrum in panel d shows a prominent blue peak and is integrated over most of the core of the nebula, with the exception of the NE corner whose spectrum is shown in panel c and is characterized by a prominent red peak. Panel b: region with the largest velocity dispersion from Fig. 10b.
Current usage metrics show cumulative count of Article Views (full-text article views including HTML views, PDF and ePub downloads, according to the available data) and Abstracts Views on Vision4Press platform.
Data correspond to usage on the plateform after 2015. The current usage metrics is available 48-96 hours after online publication and is updated daily on week days.
Initial download of the metrics may take a while.