Fig. A.1.
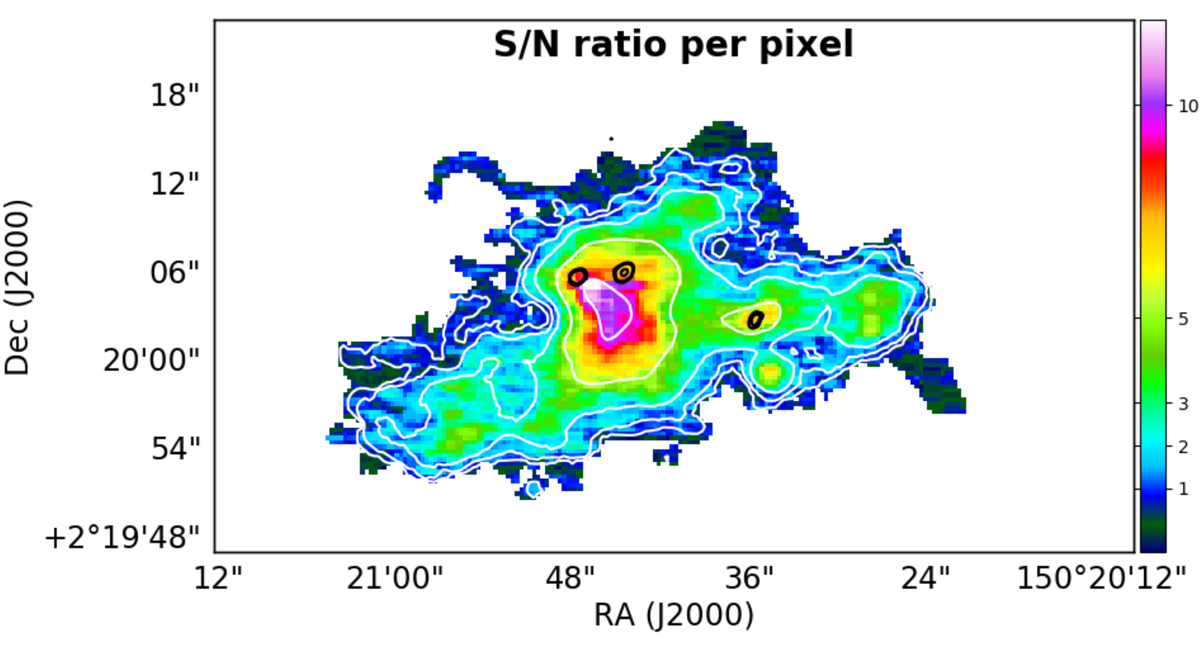
Signal-to-noise ratio per pixel in the original, unsmoothed data, over the region of the RO-1001 nebula within the area where a detection is found in the adaptively smoothing map, shown by color coding in the image (right scale). The flux error in each pixel is already enlarged to account for correlated noise (see Sect. 2). ALMA continuum sources are shown as black contours. White contours show the Lyα surface brightness levels from Fig. 2.
Current usage metrics show cumulative count of Article Views (full-text article views including HTML views, PDF and ePub downloads, according to the available data) and Abstracts Views on Vision4Press platform.
Data correspond to usage on the plateform after 2015. The current usage metrics is available 48-96 hours after online publication and is updated daily on week days.
Initial download of the metrics may take a while.