| Issue |
A&A
Volume 648, April 2021
|
|
|---|---|---|
| Article Number | A32 | |
| Number of page(s) | 17 | |
| Section | Extragalactic astronomy | |
| DOI | https://doi.org/10.1051/0004-6361/202039898 | |
| Published online | 08 April 2021 | |
A MeerKAT view of pre-processing in the Fornax A group
1
INAF – Osservatorio Astronomico di Cagliari, Via della Scienza 5, 09047 Selargius, CA, Italy
e-mail: This email address is being protected from spambots. You need JavaScript enabled to view it.
2
University of Oulu, Space Physics and Astronomy Unit, Pentti Kaiteran katu 1, 90014 Oulu, Finland
3
Institute of Astronomy, Graduate School of Science, The University of Tokyo, 2-21-1 Osawa, Mitaka, Tokyo 181-0015, Japan
4
Kapteyn Astronomical Institute, University of Groningen, PO Box 800 9700 AV Groningen, The Netherlands
5
INAF – Astronomical Observatory of Capodimonte, Via Moiariello 16, Naples 80131, Italy
6
Netherlands Institute for Radio Astronomy (ASTRON), Oude Hoogeveensedijk 4, 7991 PD Dwingeloo, The Netherlands
7
Deptarment of Astronomy, Univ. of Cape Town, Private Bag X3, Rondebosch 7701, South Africa
8
Inter-University Institute for Data Intensive Astronomy, University of Cape Town, Cape Town, Western Cape 7700, South Africa
9
South African Radio Astronomy Observatory, 2 Fir Street, Black River Park, Observatory, Cape Town 7925, South Africa
10
Department of Physics and Electronics, Rhodes University, PO Box 94 Makhanda 6140, South Africa
11
Argelander-Institut für Astronomie, Auf dem Hügel 71, 53121 Bonn, Germany
12
Ruhr University Bochum, Faculty of Physics and Astronomy, Astronomical Institute, 44780 Bochum, Germany
13
Dipartimento di Fisica, Università di Cagliari, Cittadella Universitaria, 09042 Monserrato, Italy
14
Centre for Space Research, North-West University, Potchefstroom 2520, South Africa
15
Department of Physics, University of Pretoria, Private Bag X20, Hatfield 0028, South Africa
16
INAF – Istituto di Radioastronomia, Via Gobetti 101, 40129 Bologna, Italy
Received:
12
November
2020
Accepted:
22
January
2021
Abstract
We present MeerKAT neutral hydrogen (H I) observations of the Fornax A group, which is likely falling into the Fornax cluster for the first time. Our H I image is sensitive to 1.4 × 10¹⁹ atoms cm−2 over 44.1 km s−1, where we detect H I in 10 galaxies and a total of (1.12 ± 0.02) × 109 M⊙ of H I in the intra-group medium (IGM). We search for signs of pre-processing in the 12 group galaxies with confirmed optical redshifts that reside within the sensitivity limit of our H I image. There are 9 galaxies that show evidence of pre-processing and we classify each galaxy into their respective pre-processing category, according to their H I morphology and gas (atomic and molecular) scaling relations. Galaxies that have not yet experienced pre-processing have extended H I discs and a high H I content with a H2-to-H I ratio that is an order of magnitude lower than the median for their stellar mass. Galaxies that are currently being pre-processed display H I tails, truncated H I discs with typical gas fractions, and H2-to-H I ratios. Galaxies in the advanced stages of pre-processing are the most H I deficient. If there is any H I, they have lost their outer H I disc and efficiently converted their H I to H2, resulting in H2-to-H I ratios that are an order of magnitude higher than the median for their stellar mass. The central, massive galaxy in our group (NGC 1316) underwent a 10:1 merger ∼2 Gyr ago and ejected 6.6−11.2 × 10⁸ M⊙ of H I, which we detect as clouds and streams in the IGM, some of which form coherent structures up to ∼220 kpc in length. We also detect giant (∼100 kpc) ionised hydrogen (Hα) filaments in the IGM, likely from cool gas being removed (and subsequently ionised) from an in-falling satellite. The Hα filaments are situated within the hot halo of NGC 1316 and there are localised regions that contain H I. We speculate that the Hα and multiphase gas is supported by magnetic pressure (possibly assisted by the NGC 1316 AGN), such that the hot gas can condense and form H I that survives in the hot halo for cosmological timescales.
Key words: galaxies: groups: general / galaxies: groups: individual: Fornax A / galaxies: evolution / galaxies: interactions / galaxies: ISM / radio lines: galaxies
© ESO 2021
1. Introduction
Our current understanding of galaxy formation and evolution is that secular processes and galaxy environment fundamentally shape the properties of galaxies (e.g., Baldry et al. 2004; Balogh et al. 2004; Bell et al. 2004; Peng et al. 2010; Driver et al. 2011; Schawinski et al. 2014; Davies et al. 2019). In the local Universe (z ∼ 0) up to ∼50% of galaxies reside in groups (Eke et al. 2004; Robotham et al. 2011), making it essential to understand the group environment in the context of galaxy evolution.
While there is no precise definition of a galaxy group, it generally contains 3−102 galaxies in a dark matter (DM) halo of 1012 − 1014 M⊙ (e.g., Catinella et al. 2013). As the galaxy number density and DM halo mass of groups span a wide range, there is no dominant transformation mechanism that galaxies are subjected to, but rather multiple secular and external mechanisms working together. The properties of group galaxies appear to correlate with group halo mass and virial radius, implying that quenching paths in groups are different from those in clusters (Weinmann et al. 2006; Haines et al. 2007; Wetzel et al. 2012; Woo et al. 2013; Haines et al. 2015).
As galaxies fall towards clusters, there is sufficient time for external (i.e. environmentally driven, such as tidal and hydro-dynamical) mechanisms to transform and even quench the galaxies, prior to reaching the cluster (e.g., Porter et al. 2008; Haines et al. 2013, 2015; Bianconi et al. 2018; Fossati et al. 2019; Seth & Raychaudhury 2020). This is called “pre-processing” and refers to the accelerated, non-secular evolution of galaxies that occurs prior to entering a cluster. As pre-processing requires external mechanisms to transform the galaxies, this evolution commonly occurs in groups, where it is generally thought that group galaxies follow a different evolutionary path compared to galaxies of the same mass in the field (e.g., Fujita 2004; Mahajan 2013; Roberts & Parker 2017; Cluver et al. 2020). In particular, pre-processing is likely to be most efficient in massive (> 1010.5 M⊙) galaxies residing in massive (1013 − 1014 M⊙) groups (Donnari et al. 2021). It has also been shown that pre-processing is responsible for the decrease in star formation activity for late-type galaxies at distances between 1 and 3 cluster virial radii (e.g., Lewis et al. 2002; Gómez et al. 2003; Verdugo et al. 2008; Mahajan et al. 2012; Haines et al. 2015).
Neutral hydrogen in the atomic form (H I) is ideal for tracing tidal and hydro-dynamical processes in galaxies and the intra-group medium (IGM). H I is the main component of the interstellar medium (ISM) and can show the effects of ram pressure, viscous and turbulent stripping, thermal heating (e.g., Cowie & McKee 1977; Nulsen 1982; Chung et al. 2007, 2009; Rasmussen et al. 2008; Steinhauser et al. 2016; Ramatsoku et al. 2020), and moderate and strong tidal interactions (e.g., Koribalski 2012; de Blok et al. 2018; Kleiner et al. 2019), long before these mechanism can be identified in the stars.
In this paper we present a detailed analysis of the Fornax A galaxy group based on H I and ancillary observations. The Fornax A group is an excellent candidate to search for pre-processing signatures as it is likely in-falling into the (low mass −5 × 10¹³ M⊙) Fornax cluster (Drinkwater et al. 2001) for the first time. The group galaxies span a variety of stellar masses and morphological types, implying that tidal and hydro-dynamical interactions are likely to affect the galaxies gas and stellar content (Raj et al. 2020).
Using Meer Karoo Array Telescope (MeerKAT) H I observations, deep optical imaging from the Fornax Deep Survey (FDS: Iodice et al. 2016, 2017; Venhola et al. 2018, 2019; Raj et al. 2019, 2020), wide-field Hα imaging from the VLT Survey Telescope (VST) and molecular gas observations from the Atacama Large Millimetre Array (ALMA), we identify galaxies at different stages of pre-processing following various types of interactions.
This paper is organised as follows: Section 2 describes the Fornax A group. Section 3 describes the H I and Hα observations and the data reduction process used to produce our images. We present the results of our H I measurements, H I images, and the relation to stellar and Hα emission in Sect. 4. In Sect. 5 we present the atomic-to-molecular gas ratios and discuss the evidence and timescale of pre-processing in the group. Finally, we summarise our results in Sect. 6. Throughout this paper we assume a luminosity distance of 20 Mpc to the most massive galaxy (NGC 1316) in the Fornax A group (Cantiello et al. 2013; Hatt et al. 2018) and assume all objects in the group are at the same distance. At this distance, 1′ corresponds to 5.8 kpc.
2. The Fornax A group
The Fornax A galaxy group is the brightest group in the Fornax volume. It is located on the cluster outskirts at a projected distance of ∼3.6 deg (1.3 Mpc, or ∼2 × the Fornax cluster virial radius) from the cluster centre and has a mass of 1.6 × 10¹³ M⊙, which is of the same order of magnitude as the Fornax cluster (Mvir ∼ 5 × 10¹³ M⊙) itself (Maddox et al. 2019). Within the virial radius of the group (∼1° or 0.38 Mpc, as measured by Drinkwater et al. 2001), there are approximately 70 galaxies (mostly dwarfs) that have been photometricially identified as likely group members (Venhola et al. 2019), of which 13 have confirmed spectroscopic redshifts (Maddox et al. 2019).
The brightest group galaxy (BGG), NGC 1316, is a peculiar early-type galaxy with a stellar mass of 6 × 10¹¹ M⊙ (Iodice et al. 2017). NGC 1316 is a giant radio galaxy (Ekers et al. 1983; Fomalont et al. 1989; McKinley et al. 2015; Maccagni et al. 2020), known merger remnant, and the brightest galaxy in the Fornax cluster volume (even brighter than the brightest cluster galaxy NGC 1399). There are a number of extended stellar loops and streams in NGC 1316 that are a result of a 10:1 merger that occurred 1−3 Gyr ago, between a massive early-type galaxy and a gas-rich, late-type galaxy (Schweizer 1980; Mackie & Fabbiano 1998; Goudfrooij et al. 2001; Iodice et al. 2017; Serra et al. 2019). The majority of the remaining bright (mB < 16) galaxies are late types that have stellar mass ranges of 8 < log(M⋆/M⊙) < 10.5 (Raj et al. 2020).
There have been a variety of previous studies that have detected H I in the Fornax A group. Horellou et al. (2001) and Serra et al. (2019) imaged the central region of the Fornax A group in H I, where the more recent image of Serra et al. (2019) detected NGC 1316, NGC 1317, NGC 1310, and ESO 301-IG 11, along with four clouds at the outskirts of NGC 1316 (EELR, SH2, CN, 1, and CN, 2), and two tails (TN and TS). The remaining six galaxies, which have previously been detected, are NGC 1326, NGC 1326A, and NGC 1326B in the H I Parkes All Sky Survey (HIPASS; Meyer et al. 2004; Koribalski et al. 2004), NGC 1316C with the Nançay telescope (Theureau et al. 1998), FCC 35 with the Australian Telescope Compact Array (ATCA) and the Green Bank Telescope (Putman et al. 1998; Courtois & Tully 2015), and FCC 46 with the ATCA (De Rijcke et al. 2013). Within NGC 1316, H I has been resolved in the centre and correlates with massive amounts of molecular gas (Morokuma-Matsui et al. 2019; Serra et al. 2019). H I has also been detected in the outer stellar halo, within the regions defined by the Hα extended emission line region (EELR; originally discovered by Mackie & Fabbiano 1998), in the southern star cluster complex (SH2; Horellou et al. 2001) and in two northern clouds (CN, 1 and CN, 2) (Serra et al. 2019). Lastly, ∼6 × 10⁸ M⊙ of H I was detected in the IGM, defined as the northern and southern tails (TN and TS). The tails are ejected H I gas from the NGC 1316 merger and extend up to 150 kpc from the galaxy centre (Serra et al. 2019).
The Fornax A group is an ideal system to search for pre-processing. Evidence suggests that the group is in the early stage of assembly (Iodice et al. 2017; Raj et al. 2020) and is located at the cluster infall distance where pre-processing is thought to occur (Lewis et al. 2002; Gómez et al. 2003; Verdugo et al. 2008; Mahajan et al. 2012; Haines et al. 2015). The BGG is massive enough to experience efficient pre-processing (Donnari et al. 2021) and Raj et al. (2020) show that there are signatures of pre-processing in the group; six of the nine late types have an up-bending (type III) break in their radial light profile. This indicates that the star formation may be halting in the outer disc of galaxies, although, what is driving the decline in star formation is not yet clear.
3. Observations and data reduction
3.1. MeerKAT radio observation
Commissioned in July 2018, MeerKAT is a new radio interferometer and a precursor for the Square Kilometre Array SKA1-MID telescope (Jonas 2016; Mauch et al. 2020). MeerKAT is designed to produce highly sensitive radio continuum and H I images with good spatial and spectral resolution in a relatively short amount of observing time. The MeerKAT Fornax Survey (MFS; PI: P.Serra) is one of the designated Large Survey Projects (LSPs) of the MeerKAT telescope. The MFS will observe the Fornax galaxy cluster in H I over a wide range of environment densities, down to a column density of a few ×1019 atoms cm−2 at a resolution of 1 kpc, equivalent to a H I mass limit of 5 × 10⁵ M⊙ (Serra et al. 2016).
The Fornax A group was observed with MeerKAT in two different commissioning observations in June 2018, which differ by the number of antennas (36 and 62, respectively) connected to the correlator. We present the details of these observations and of the H I cube in Table 1. The MeerKAT baselines range between 29 m and 7.7 km and for both these observations, the SKARAB correlator in the 4k mode was used, which consists of 4096 channels in full polarisation in the frequency range 856−1712 MHz with a resolution of 209 kHz (equivalent to 44.1 km s−1 for H I at the distance of the Fornax cluster).
Observation and H I cube properties.
The first observation (referred to as Mk-36) used 36 antennas and observed the target for a total of 8 h. Results from this observation are presented both in radio continuum (Maccagni et al. 2020) and in H I (Serra et al. 2019); these papers provide a detailed description of the data reduction process. In this work, we use the Mk-36 calibrated measurement set in combination with that from the second observation (detailed below).
The second observation (Mk-62) used 62 antennas and observed the target for a total of 7 h. PKS 1934−638 and PKS 0032−403 were observed, where the former was observed for 20 min and used as the bandpass and flux calibrator while the latter was observed for 2 min every 10 min and used as the gain calibrator.
We used the Containerised Automated Radio Astronomical Calibration (CARACal1; Józsa et al. 2020) pipeline to reduce the MeerKAT observations. The pipeline uses Stimela2, which containerises different open-source radio interferometry software in a Python framework. This makes the pipeline both flexible and highly customisable and has been used to reduce MeerKAT and other (e.g., Jansky Very Large Array) interferometric observations (e.g., see Serra et al. 2019; Maccagni et al. 2020; Ramatsoku et al. 2020; Ianjamasimanana et al. 2020).
We used CARACal to reduce the Mk-62 observation end-to-end and include the already reduced Mk-36 observation (Serra et al. 2019; Maccagni et al. 2020) at the spectral line imaging step. For the Mk-62 observation, we used 120 (1330−1450) MHz of bandwidth to ensure adequate continuum imaging and calibration. We used 18 (1402−1420) MHz, which easily covers the group volume, for the (joint) spectral line imaging.
Our choice of data reduction techniques and steps is outlined using CARACal as follows: First, we flag the radio frequency interference (RFI) in the calibrators data based on the Stokes Q visibilites using AOflagger (Offringa et al. 2012). Then, a time-independent, antenna-based, complex gain solution was derived for the bandpass using CASA bandpass and the flux scale was determined with CASA gaincal. Frequency-independent, time-dependent, antenna-based complex gains were determined using CASA gaincal. The gain amplitudes were scaled to bootstrap the flux scale with CASA fluxscale, and the bandpass and complex gain solutions were applied to the target visibilities using CASA applycal. The RFI in the target data was then flagged based on the Stokes Q visibilites, using AOflagger (Offringa et al. 2012). We imaged and self-calibrated the continuum emission of the target with WSclean (Offringa et al. 2014; Offringa & Smirnov 2017) and CUBICAL (Kenyon et al. 2018), respectively. This process was repeated two more times, in which each self-calibration iteration was frequency-independent and solved only for the gain phase, with a solution interval of 2 min. The final continuum model was subtracted from the visibilities using CASA msutils. The visibilities from both the Mk-36 and Mk-62 calibrated measurement sets were then Doppler corrected into the barycentric rest frame using CASA mstransform. Residual continuum emission in the combined measurement set was removed by fitting and subtracting a second order polynomial to the real and imaginary visibility spectra with CASA mstransform. Then, we created a H I cube by imaging the H I emission with WSclean (Offringa et al. 2014; Offringa & Smirnov 2017) and made a 3D mask through source finding with the Source Findina Application (SoFiA; Serra et al. 2015). This was then used as a clean mask to image a new H I cube with higher image fidelity. Finally, we applied the primary beam correction of Mauch et al. (2020) down to a level of 2%, which corrects for the sensitivity response pattern of MeerKAT.
Our H I cube was imaged3 using an 18 MHz sub-band (centred on NGC 1316) and the basic properties are presented in Table 1. The root mean square (rms) noise is 90 μJy beam−1, which equates to a 3σ H I column density of 1.4 × 10¹⁹ atoms cm−2 over a single channel of 44.1 km s−1 at the angular resolution of 33.0″ × 29.2″. Compared to Serra et al. (2019), we present an image that is approximately twice as large and more than twice as sensitive and has comparable spatial and velocity resolutions.
We searched for H I sources using SoFiA outside the CARACal pipeline. To ensure that we properly captured H I emission that is diffuse or far from the pointing centre, we tested different combinations of smoothing kernels and detection thresholds in the SoFiA smooth + clip algorithm, per-source integrated signal-to-noise ratio (S/N) thresholds, and reliability thresholds. Pixels in the H I cube are detected if their value is above a smooth + clip detection threshold of 3.5 (in absolute value and relative to the cube noise) for spatial smoothing kernels equal to 1, 2, and 3 times the synthesised beam in combination with velocity smoothing kernels over a single (i.e. no smoothing) and three channels. The mean, sum, and maximum pixel value of each detected source (normalised to the local noise) create a parameter space that can separate real H I emission from noise peaks (Fig. 1; Serra et al. 2012). The reliability of each source (defined as the local ratio of positive-to-negative source density within this 3D parameter space) as well as the integrated S/N are then used to identify statistically significant, real H I sources. Our catalogue was created by retaining only sources with an integrated S/N above 4 and a reliability above 0.65. As shown in Fig. 1, this selection is purposefully designed to be conservative, ensuring that detected diffuse H I emission (i.e clouds in the IGM) is clearly real emission and does not include noise peaks.
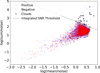 |
Fig. 1. Sum of the pixel values as a function of the mean pixel value for all sources detected with SoFiA. The blue points indicate the positive detections and the red points indicate the negative detections (Serra et al. 2012). Detected H I clouds are shown as black crosses. The dotted line shows the per-source integrated S/N of 4. Only positive sources above this threshold and with a reliability > 0.65 are retained in our final catalogue. The chosen integrated S/N of 4 is a conservative threshold as it is closer to area of parameter space occupied by the most statistically significant detections (i.e. the positive sources with a high sum/noise for their mean/noise value) and is clearly above the edge of non-statistically significant detections (i.e. where the density of positive sources is approximately the same as the density of negative sources). Owing to this conservative threshold, the detected H I clouds, while often diffuse, occupy the parameter space of real, reliable H I emission. |
However, we found some real H I emission below these thresholds that should be included in the detection mask. We thus operated on the detection mask using the virtual reality (VR) software iDaVIE-v (Sivitilli et al. 2021) from the Institute for Data Intensive Astronomy (IDIA) Visualisation Lab (Marchetti et al. 2020; Jarrett et al. 2020). This allowed us to use a ray marching renderer (Comrie et al., in prep.) to view and interact with our H I cube, while making adjustments to the mask within a 3D digital immersive setting. We were able to inspect the mask for any spurious H I emission that was included or identify real H I emission that was missed. This was accomplished by importing the detection mask from SoFiA, overlaying it with the H I cube in the VR environment, and then adjusting the mask using the motion-tracking hand controllers. As part of this process, we added two sources to the detection mask within the VR environment by marking zones where emission was clearly present.
The two sources added in VR were originally excluded from the detection mask because they are below the reliability threshold of 0.65 (but above the integrated S/N threshold of 4). These sources are deemed real because they either coincide with emission at other wavelengths (see below) or are part of large, coherent H I emission. Following these edits to the detection mask in VR, we created H I intensity and velocity maps that are presented in the next section.
3.2. VST Hα observation
To generate the Hα-emission images, we used a combination of Hα narrow-band images and r′ broad-band images both collected using the OmegaCAM attached to the VST at Cerro Paranal, Chile (PID: 0102.B-0780(A)). The OmegaCAM is a 32 CCD wide-field camera with a 1 deg × 1 deg field of view and a pixel size of 0.21″. We used the NB 659 Hα filter with 10 nm throughput, bought by Janet Drew for the VST Photometric Hα Survey (VPHAS; Drew et al. 2014). The imaging was done using large ≈1 deg pointings and short 150 s and 180 s exposures in r′ and Hα bands, respectively. This strategy allows us to make accurate sky background removal by subtracting averaged background models from the science exposures, and it also reduces the amount of imaging artefacts (such as satellite tracks) in the final mosaics because those are averaged out when the images are stacked. The total exposure times in the r′-band and Hα-band were 8250 s and 31 140 s, respectively. Similar data reduction and calibration was done for both r′-band and Hα-images. Details of the used reduction steps are given by Venhola et al. (2018).
As the Hα narrow-band images are sensitive both to Hα emission and flux coming from the continuum, we needed to subtract the continuum flux from the Hα images before they can be used for Hα analysis. As the flux in the r′ band is dominated by the continuum, we use scaled r′-band images to subtract the continuum from the Hα. The optimal scaling of the r′-band image was selected by visually determining the scaling factor that results in a clean subtraction of the majority of stars and early-type galaxies.
However, there are some caveats in this procedure, which leaves some systematic over- and under-subtraction in the Hα images. If the seeing conditions or point spread functions (PSFs) differ between the broad- and narrow-band images there will be some residuals in the continuum subtracted image. In addition to these residuals caused by the inner parts of the PSF (≲5″), also the extended outer parts (see Venhola et al. 2018) and reflection rings of the PSF may leave some features in the images. In the case of bright, extended, and peaked galaxies such as NGC 1316, these PSF features are also significant. As the positions of the reflection rings are dependent on the position of the source on the focal plane they do not overlap precisely in the narrow- and broad-band images and thus leave some systematic over- and under- subtractions in the images. These kinds of features are apparent in the reduced Hα emission images.
The over- and under-subtraction artefacts dominate in and around objects with bright stellar emission. Therefore, NGC 1316 is significantly affected to the extent that the artefacts obscure real Hα emission. To rectify this, we select a sub-region that includes NGC 1316, NGC 1317, and NGC 1310 and create a model of the background that is ultimately subtracted from the original image.
The background model was created by masking the visible, real Hα emission, and replaced with the background local median. The masked image is then filtered with a median filter to eliminate sharp features in the image. Lastly, the (masked, filtered) background model is subtracted from the original image.
We repeat this process using the residual image to create an improved mask, which is then subtracted from the original image. We use a conservative approach to mask the Hα emission, as the aim is to remove the dominant artefacts and achieve a uniform background throughout the image. We present a comparison of the images and additional detail in Appendix A.
4. H I distribution in the group
In Fig. 2, we present the primary beam-corrected H I column density map as detected by MeerKAT, overlaid on a gri stacked optical image from the FDS (Iodice et al. 2016, 2017; Venhola et al. 2018). Our H I image (Fig. 2) is sensitive to a column density of NH I = 1.4 × 10¹⁹ atoms cm−2 in the most sensitive part (pointing centre), equating to a 3σ H I mass lower detection limit 1.7 × 10⁶ M⊙ for a point source 100 km s−1 wide.
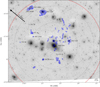 |
Fig. 2. Primary beam-corrected constant H I contours from MeerKAT (blue) overlaid on a FDS (Iodice et al. 2016) gri stacked optical image. The lowest contour represents the 3σ column density level of NH I = 1.4 × 10¹⁹ atoms cm−2 over a 44.1 km s−1 channel, where the contours increase by a factor of 3n (n = 0, 1, 2, ...). The group galaxies are labelled and the galaxies not detected in H I are outlined by a dashed black ellipse. The grey circles indicate the sensitivity of the primary beam (Mauch et al. 2020) at 50%, 10%, and 2%. The red dashed circle denotes the 1.05° (0.38 Mpc) virial radius of the group as adopted in Drinkwater et al. (2001), where the restoring beam (33.0″ × 29.2″) is shown in the bottom left corner and a scale bar indicating 20 kpc at the distance of Fornax A in the bottom right corner. The direction to the Fornax cluster is shown by the black arrow. In H I, we detect 10 (out of 12) galaxies, previously known clouds and streams in the IGM and a population of new H I clouds in the IGM. The previously known IGM H I structures are labelled in Fig. 4 for clarity. |
As a result of the improved sensitivity of our image, in H I we detect 10 galaxies out of the 13 spectroscopically confirmed galaxies (Maddox et al. 2019), all the previously known clouds and streams, and a new population of clouds and streams in the IGM. Eleven of our H I detections (10 galaxies and SH2) have corresponding optical redshifts (Maddox et al. 2019). NGC 1341, FCC 19, and FCC 40 are the 3 galaxies with optical redshifts in which we do not detect any H I. NGC 1341 is a late-type (SbcII) galaxy with a stellar mass of 5.5 × 10⁹ M⊙ (Raj et al. 2020), in which H I has beeen previously detected (Courtois & Tully 2015). However, NGC 1341 is outside our H I image field of view and we do not include it in our sample. FCC 40 is a low surface brightness dwarf (dE4) elliptical (Iodice et al. 2017) and is unlikely to contain massive amounts of H I. It is also located in a region of the image in which the sensitivity is 75% worse than the pointing centre, such that we do not detect H I below 5.6 × 10¹⁹ atoms cm−2. FCC 19 is a dS0 with a stellar mass of 3.4 × 10⁸ M⊙ (Iodice et al. 2017; Liu et al. 2019). As it is near the pointing centre (70 kpc in projection from NGC 1316), we would expect to detect H I if there were any. However, no H I is detected in FCC 19 and we discuss the implications of this in Sect. 5.2.
We present the three-colour (constructed using the individual g, r, and i images) FDS (Iodice et al. 2016) optical image cutout for each group galaxy in our sample, which has been overlaid with the H I contours at their respective column density sensitivity (or upper limit) in Fig. 3. The integrated H I flux and mass of the H I detections and the basic properties of the group galaxies within the H I image field of view are presented in Table 2. The velocity field is presented in Fig. 4 and highlights some new large-scale coherent H I structures, which extend up to ∼220 kpc in length.
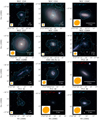 |
Fig. 3. Optical three-colour composite of each group galaxy in our sample with overlaid H I contours. The colour image is comprised of the g-, r-, and i-band filters from the FDS (Iodice et al. 2016); the white dashed contour shows the most sensitive, constant column density of NH I = 1.4 × 10¹⁹ atoms cm−2 from Fig. 2 and the blue contours start from the local column density sensitivity (i.e. 1.4 × 10¹⁹ atoms cm−2 scaled by the primary beam response; see top left corner of each cutout) and increase by a factor of 3n with n = 0, 1, 2, ..., at each step. For non-detections, the 3σ H I column density upper limit over a single channel is shown in red in the top left of the cutout. The restoring beam (33.0″ × 29.2″) is shown in orange in the bottom left corner and a 5 kpc scale bar is shown in the bottom right corner. |
Basic properties of the group galaxies and H I detected sources within the H I image field of view.
4.1. Newly detected H I
Our H I image is the widest and deepest interferometric image of the Fornax A group to date. Naturally, we detect new H I sources, additional H I in known sources and resolved H I in previously unresolved sources. All the sources are presented in Table 2, Figs. 2 and 4. As described in Sect. 2, several sources in the Fornax A group have been previously detected. The new H I sources detected in this work are as follows: resolved H I tails associated with FCC 35, NGC 1310, and NGC 1326; an extension of TN in the form of additional, coherent clouds; an additional component to TS in the form of a western cloud; and a population of clouds in the IGM (unlabelled in Fig. 4).
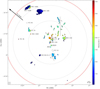 |
Fig. 4. H I velocity field, where the known galaxies and previously detected clouds and tails in the IGM are labelled. As in Fig. 2, the two galaxies not detected in H I are outlined by black, dashed ellipses and the direction to the Fornax cluster is shown by the black arrow. The velocity colour bar is centred on the systemic velocity of the BGG (NGC 1316) at 1760 km s−1. The grey circles indicate the sensitivity of the primary beam (Mauch et al. 2020) at 50%, 10%, and 2%. The red dashed circle denotes the 1.05° (0.38 Mpc) virial radius of the group as adopted in Drinkwater et al. (2001), where the restoring (33.0″ × 29.2″) beam and scale bar are shown in the bottom corners. The clouds that make up TN have a new, extended component, effectively doubling the size compared to its original discovery in Serra et al. (2019). |
4.2. H I in galaxies
We detect H I in ten galaxies, where the H I is well resolved in eight of them (Fig. 3). Out of those, two galaxies have H I that is confined to the stellar disc, while the remaining 6 have H I emission that extend beyond the stellar disc. The two galaxies with unresolved H I are NGC 1316C and FCC 46.
The two well-resolved galaxies with H I confined within the stellar discs are NGC 1316 and NGC 1317 (Fig. 3). We detected 6.8 × 10⁷ M⊙ of H I in the centre of NGC 1316, 60% more H I in the centre than previously detected in Serra et al. (2019). The H I has complex kinematics (also seen in the molecular gas and dust) beyond a uniformly rotating disc. The H I in NGC 1317 is sharply truncated at the boundary of the stellar disc. Given its stellar mass and morphology, NGC 1317 is H I deficient by at least an order of magnitude (discussed in detail in Sect. 5.2).
There are six galaxies in the group that have extended H I discs. Three galaxies (NGC 1326A/B and ESO 301-IG 11) have slightly extended and mostly symmetric H I discs, while the other three galaxies (FCC 35, NGC 1326, and NGC 1310) have extended H I features that are significantly disturbed and asymmetric (Fig. 3).
NGC 1326A and B have extended H I discs and although they overlap in projection, they are separated by ∼800 km s−1 in velocity. There is no H I connecting these two galaxies along the line of sight down to a column density of 2.8 × 10²⁰ atoms cm−2, which is also confirmed through visual inspection in virtual reality. Future, more sensitive data from the MFS (Serra et al. 2016) will unambiguously show whether these galaxies are interacting or not.
The collisional ring galaxy ESO 301-IG 11 has a slightly extended H I disc, where the extension is in the south-east direction (away from the group centre). As suggested by its classification, the H I is likely to have been tidally disturbed in the collision that formed the ring.
In the three galaxies with disturbed or asymmetric H I discs (detailed below), strong tidal interactions can be reasonably excluded as the cause, as the deep g-band FDS images show no stellar emission associated with the extended H I down to a surface brightness of 30 mag arcsec−2. The H I tails and asymmetries all differ in these galaxies, likely because each galaxy is affected by different processes, such as gentle tidal interactions, ram pressure, and accretion.
The dwarf late-type galaxy FCC 35 has a long, asymmetric (kinematically irregular) H I tail pointing away from the group centre. The two closest galaxies (spatially with confirmed redshifts) are NGC 1316C and FCC 46, a dwarf late type and dwarf early type. These two galaxies have unresolved H I and are more H I deficient than the majority of the group galaxies. Neither a dynamical interaction between these galaxies nor a hydrodynamical mechanism (such as ram pressure) can be ruled out as the cause for the long, H I tail of FCC 35.
NGC 1326 is a barred spiral galaxy with a ring and has clumpy, extended, and asymmetric H I emission in the south, pointing towards the group centre. The one-sided H I emission could be indicative of a tidal interaction. However, this could also be an instrumental effect, as the galaxy is located very far from the pointing centre and is subjected to a variable sensitivity response. The southern side (where the H I tail is) is sensitive down to ∼6.1 × 10¹⁹ atoms cm−2, while the northern side has a lower sensitivity of ∼2.3 × 10²⁰ atoms cm−2. As the tails are diffuse (< 1 × 10²⁰ atoms cm−2), more sensitive observations are needed to determine if NGC 1326 has extended H I emission on the northern side.
Finally, the massive late-type galaxy NGC 1310 is surrounded by H I extensions and clouds of different velocities, which is unusual, because it is a relatively (compared to NGC 1317) isolated galaxy, with an undisturbed optical spiral morphology and a uniformly rotating H I disc. Despite the coarse velocity resolution, we can determine from our observations that the majority of the H I extensions and clouds (except for the extended component of the disc to the south) are not rotating with the disc (Fig. 4) and cover a broad range (∼1450−1950 km s−1) in velocity, suggesting that it may be anomalous H I gas from an external origin. Future data from the MFS (Serra et al. 2016) with better velocity resolution will clarify this point.
4.3. H I in the intra-group medium
We detect a total of (1.12 ± 0.02) × 109 M⊙ of H I in the IGM. All of the previous clouds in Serra et al. (2019) were detected as well as additional H I in some of these features. We detect new clouds, the majority residing in the north, with some forming large, contiguous 3D structures.
We searched for any association between the new H I in the IGM and stellar emission. In particular, as more H I has been detected within the stellar halo of NGC 1316, we checked for any correlation between the H I and known stellar loops (Fig. 5). Overall, there is very little, clear association between the H I in the NGC 1316 halo and its stellar loops. The major exceptions are TS and its newly detected cloud, as they are fully contained within the SW stellar loop. The H I in SH2 and EELR may potentially correlate with the stellar loop L1 and there are some H I cloud (e.g., CN, 2) in the north that partially overlap with the stellar loop L7. Other than examples above, all the remaining H I in the IGM shows no association with stellar emission.
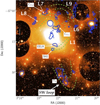 |
Fig. 5. Low surface brightness (star removed) image of NGC 1316 in g-band, observed with the VST (Iodice et al. 2017). The known (Schweizer 1980; Richtler et al. 2014; Iodice et al. 2017) stellar loops are labelled and outlined by the dashed green lines. The H I is shown by the solid blue contours and the previously known H I clouds are labelled. The clouds that make up TS (including the new western H I cloud) overlap with the stellar SW loop. There is some overlap with some H I clouds in the north (e.g., CN, 2 and the clouds to the west) and the optical loop L7. Overall, there is no consistent correlation between the stellar loops and the distribution of H I clouds. |
We detect an extension in TN, effectively doubling its length and mass. The extension smoothly connects in velocity with the previously known emission and now extends up to ∼220 kpc from NGC 1316 (Fig. 4), which is where the H I originated from Serra et al. (2019). The clouds that make up TN now contains (2.10 ± 0.07) × 108 M⊙ of H I. The north and south tails contain 60% (6.7 ± 0.1 × 10⁸ M⊙) of the total IGM H I mass. The remaining clouds in the IGM mostly reside to the north of NGC 1316, with the majority of these existing over a narrow (90 km s−1) velocity range. It is possible some of these clouds form large coherent H I structures, although it is not clear compared to the case of TN and TS. While TN and TS originate from a single pericentric passage of the NGC 1316 merger (Serra et al. 2019), the remaining clouds in the IGM are more likely to be the remnants of recently accreted satellites onto NGC 1316, which is consistent with Iodice et al. (2017).
The clouds immediately to the north-west of NGC 1317 may be a remnant of its outer disc. These clouds are within a projected distance of 10 kpc from NGC 1317 and the cloud and the galaxy have the same velocity. The H I-to-stellar mass ratio of the galaxy is low by at least an order of magnitude (see below) and these clouds alone are not enough to explain the H I deficiency. However, these are the only clouds that show potential evidence that they originated from NGC 1317.
All the H I in the IGM located north of the group centre (NGC 1316) and the clouds to the south-east of ESO 301-IG 11 appear to be decoupled from the stars. The H I in the south (SH2, TS) has stellar emission associated with it. Additionally, there are a few H I clouds near to the group centre that contain multiphase gas.
4.4. Multiphase gas in the intra-group medium
In Fig. 6, we show the ionized Hα gas emission detected in the vicinity of NGC 1316 (i.e. the group centre). Hα is detected in NGC 1316, NGC 1317, and NGC 1310. However, the most striking features are the Hα complexes detected in the IGM.
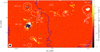 |
Fig. 6. OmegaCAM Hα emission showing the ionised gas in the vicinity of NGC 1316. The blue contour shows the majority of the western lobe of NGC 1316 in radio continuum at a (conservative) level of 1.3 mJy beam−1 from Maccagni et al. (2020). The white contours show the 3σ H I column density of 1.4 × 10¹⁹ atoms cm−2 (over 44.1 km s−1) from this work. Known sources (i.e. galaxies and IGM H I) and multiphase (MP) gas clouds that contain Hα and H I as well as the Ant-like feature from Fomalont et al. (1989) are labelled. This image reveals long filaments of ionised gas in the IGM. |
There are giant filaments of Hα in the IGM stretching between galaxies of the group. H I is directly associated with some of the ionised gas, showing the coexistence of multiphase gas in the IGM. These occur in EELR, CN, 1, the cloud directly below CN, 1 and in five newly detected clouds containing H I that we label MP in Fig. 6. Additionally, we detect the “Ant” (or ALF; Ant-like feature) first detected as a depolarising feature in Fomalont et al. (1989) and later in Hα by Bland-Hawthorn et al. (1995). The Hα emission is thought to provide the intervening turbulent magneto-ionic medium required to depolarize the radio continuum emission Fomalont et al. (1989). There is no optical continuum emission nor any H I emission currently associated with the Ant.
While there are a number of multiphase gas clouds in the IGM, the brightest case is EELR. It is clear that EELR has a complex multiphase nature, with H I, Hα, and dust all previously detected in it (Mackie & Fabbiano 1998; Horellou et al. 2001; Serra et al. 2019). We detect 50% more H I than the previous study (Serra et al. 2019) and H I is only present in the region of the bright, more ordered ionised gas morphology. Given that our H I image is sensitive to a column density of 1.4 × 10¹⁹ atoms cm−2, it is unlikely that there is any H I in the less ordered (and likely turbulent) part of EELR. Currently, the origin of EELR is unclear, and we will present a detailed analysis of it and its multiphase gas in future work.
5. Pre-processing in the group
The Fornax A group is at a projected distance of ∼1.3 Mpc (approximately 2 virial radii) from the Fornax Cluster centre. Redshift independent distances are too uncertain to establish whether the group is falling into the cluster. However, the intact spiral morphologies of group galaxies imply that the group has not passed the cluster pericentre as spiral morphologies do not typically survive more than one pericentric passage (e.g., Calcáneo-Roldán et al. 2000). At this distance, the intra-cluster medium (ICM) of the Fornax cluster should not have a significant impact on the group galaxies, meaning that quenched galaxies are a result of pre-processing within the group.
An optical analysis of the radial light profiles of the group galaxies and the intra-group light (IGL) concluded that the Fornax A group is in an early stage of assembly (Raj et al. 2020). This is evident from the low level (16%) of IGL and from the group being dominated by late types with undisturbed morphologies and comparable stellar masses (Raj et al. 2020).
In this work, we detect H I throughout the Fornax A group both in the galaxies and the IGM. While the galaxies range from being H I rich to extremely H I deficient, the majority of the galaxies contain a regular amount of H I for their stellar mass. This is consistent with the group being in an early phase of assembly, as the majority of galaxies would be H I deficient for a group in the advanced assembly stage. The H I detections show evidence of pre-processing in the form of (2.8 ± 0.2) × 108 M⊙ of H I in the IGM, H I deficient galaxies, truncated H I discs, H I tails, and asymmetries. The diversity of galaxy H I morphologies suggest that we are observing galaxies at different stages of pre-processing, as we detail below.
5.1. NGC 1316 merger
The most obvious case of pre-processing in the group is NGC 1316, the BGG. It is a peculiar early type that is the brightest galaxy in the entire Fornax cluster volume and the result of a 10:1 merger that occurred 1−3 Gyr ago between a massive early-type galaxy and a gas-rich late-type galaxy (Schweizer 1980; Mackie & Fabbiano 1998; Goudfrooij et al. 2001; Iodice et al. 2017; Serra et al. 2019). There are large stellar loops and streams, an anomalous amount of dust and molecular gas (2 × 10⁷ and 6 × 10⁸ M⊙, respectively) in the centre, as well as H I in the centre and in the form of long tails (Draine et al. 2007; Lanz et al. 2010; Galametz et al. 2012; Morokuma-Matsui et al. 2019; Serra et al. 2019).
The H I mass budget for a 10:1 merger to produce the features observed in NGC 1316 requires the progenitor to contain ∼2 × 10⁹ M⊙ of H I (Lanz et al. 2010; Serra et al. 2019). Recently, Serra et al. (2019) detected 4.3 × 10⁷ M⊙ of H I in the centre of NGC 1316, overlapping with the dust and molecular gas, and a total H I mass of 7 × 10⁸ M⊙ when including the tails and nearby H I clouds. While these authors detected an order of magnitude more H I than previous studies, this is a factor of ∼3 lower than expected. In this work, we detect a H I mass in the centre of (6.8 ± 0.4) × 107 M⊙ and a total H I mass 0.9−1.24 × 10⁹ M⊙ associated with NGC 1316 in the form of streams and clouds. This brings the observed H I mass budget even closer to the expected value under the 10:1 lenticular + spiral merger hypothesis – just within a factor 1.7−2.2, which is well within the uncertainties.
Since the merger 1−3 Gyr ago, NGC 1316 has been accreting small satellites (Iodice et al. 2017). The satellites may have contributed to the build up of H I, however, we do not observe any H I correlated with dwarf galaxies within 150 kpc of NGC 1316. Any contributed H I is second order compared to the initial merger, which is supported by the H I mass of NGC 1316 being dominated by the tails. Tidal forces from the initial merger ejected 6.6 × 10⁸ M⊙ of H I into the IGM in the TN and TS tails alone. The remaining H I in the IGM is likely to be a combination of gas decoupled from stars in the initial merger and gas from more recently accreted satellites. H I tidal tails that span hundreds of kpc in galaxy groups have been shown to survive in the IGM for the same timescale (1−3 Gyr) from when this merger took place (Hess et al. 2017).
5.2. Pre-processing status of the group galaxies
In this section, we identify galaxies at different stages of pre-processing according to their H I morphology and cool gas (H I and H2) ratios. The categories are as follows: (i) early, where a galaxy has yet to experience significant pre-processing; (ii) ongoing, for galaxies that currently show signatures of pre-processing; and (iii) advanced, for galaxies that have already experienced significant pre-processing.
There are a total of 12 galaxies in the sample, which are all the spectroscopically confirmed galaxies within the H I image field of view. In our sample, 10 galaxies have H I detections and 2 galaxies (FCC 19 and FCC 40) have H I upper limits (Fig. 3). There are 7 galaxies that have been observed with ALMA. The 5 galaxies that were not observed are ESO 301-IG 11, FCC 19, FCC 35, FCC 40, and FCC 46 (Morokuma-Matsui et al. 2019, and in prep.). We measure the molecular gas mass of the observed galaxies using the standard Milky Way CO-to-H2 conversion factor of 4.36 (M⊙ K km s−1 pc−2)−1 (Bolatto et al. 2013) as well as estimated stellar masses (Table 2) from Raj et al. (2020) and Venhola et al. (2018), which are derived from the g and i photometric relation in Taylor et al. (2011). We remove the helium contribution from our molecular gas masses so that we are measuring the molecular-to-atomic hydrogen gas mass (except in the total gas fraction, shown below) and can directly compare our findings to Catinella et al. (2018).
We present the H I and H2 scaling ratios in Fig. 7. We measure the H I gas fraction FHI ≡ log(MHI/M⋆), the total gas fraction Fgas ≡ log(1.3(MHI + MH2)/M⋆) where the 1.3 accounts for the helium contribution, the molecular-to-atomic gas mass ratio Rmol ≡ log(MH2/MHI), and the H2 gas fraction FH2 ≡ log(MH2/M⋆). We compare the H I fraction of our galaxies to those in the Herschel Reference Survey (HRS; Boselli et al. 2010, 2014) and the Void Galaxy Survey (VGS; Kreckel et al. 2012), which span a comparable stellar mass range of our galaxies. We also compare FHI to the median trend of the extended GALEX Arecibo SDSS Survey (xGASS; Catinella et al. 2018). Furthermore, we compare our molecular gas scaling relations to the median trends of xGASS-CO (Fig. 7), which are xGASS galaxies with CO detections (Catinella et al. 2018). The xGASS and xGASS-CO trends provide a good reference for the H I and H2 scaling relations in the local Universe as the median FHI trend was derived from 1179 galaxies selected with 109 < M⋆ (M⊙) < 1011.5 and 0.01 < z < 0.05, and the H2 mass and scaling relations derived using a subset 477 galaxies from the parent sample that have CO detections.
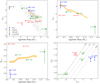 |
Fig. 7. Atomic and molecular gas scaling ratios. In all figures, the early, ongoing, and advanced pre-processing categories are shown as blue circles, green squares, and red diamonds, respectively and H2 upper limits are depicted by arrows. Solid markers indicate H I detections and open markers are non-detections. FCC 40 is not assigned to any pre-processing category and is shown as the open black star. Top left panel: H I gas fraction compared to galaxies from the HRS (Boselli et al. 2010, 2014) and VGS (Kreckel et al. 2012) (grey points) that show the typical scatter in FHI. The orange shaded region indicates the median trend from xGASS (Catinella et al. 2018). Top right panel: total gas fraction of our galaxies compared to the median xGASS-CO trend (Catinella et al. 2018) (orange shaded region). Bottom left panel: molecular-to-atomic-gas ratio of our galaxies compared to the median xGASS-CO trend (Catinella et al. 2018) (orange shaded region). Bottom right panel: H2 gas fraction as a function of H I gas fraction, showing constant ratios of 100%, 30%, 10%, and 3%. Overall, the galaxies in the early category are H I rich, the galaxies in the ongoing category typically follow the xGASS and xGASS-CO median scaling relations (Catinella et al. 2018), while galaxies in the advanced category have no H I or are H I-deficient with irregularly high H2-to-H I ratios. |
The two galaxies that show no signatures (i.e. in the early phase) of pre-processing are NGC 1326A and NGC 1326B. They are H I rich galaxies with typical extended H I discs and a low molecular gas content. Both galaxies were observed with ALMA (Morokuma-Matsui et al. 2019, and in prep.), although no CO was detected, placing upper limits on the H2 mass. They have the highest H I fraction and lowest H2-to-H I ratios given their stellar mass (Fig. 7). The galaxies are just within the virial radius of the group, making them furthest from the group centre in projected distance. This increases the likelihood that the galaxies have not undergone pre-processing yet.
The galaxies that show current signatures of pre-processing (i.e. the ongoing category) are FCC 35, ESO 301-IG 11, NGC 1310, NGC 1316, and NGC 1326. In general, these galaxies have H I tails or asymmetric extended H I emission, typical H I and H2 ratios (for the galaxies with H2 observations) that follow the median xGASS trends in Fig. 7. The exception to this is NGC 1316. As this galaxy is the BGG, it has a unique formation and evolution history (discussed in Sect. 5.1) that displays both an ongoing (e.g., tidal tails) and advanced state (giant elliptical with a lack of H I contained in the stellar body) of pre-processing. In this work, we include this galaxy in the ongoing category, although the H I mass range calculated in Sect. 5.1 reflects that it could also be part of the advanced category.
FCC 35 is the bluest galaxy (Fig. 3 and Table 2) in the group (Raj et al. 2020) and has extremely strong and narrow optical emission lines that classify it as either a blue compact dwarf or an active star-burst HII galaxy (Putman et al. 1998). Previous studies (i.e. Putman et al. 1998; Schröder et al. 2001) detected a H I cloud associated with FCC 35 and suggested it may be a result of a tidal interaction with the nearest (projected separation of 50 kpc) neighbour NGC 1316C. This is a plausible scenario as FCC 35 has an up-bending (Type-III) break in the stellar radial profile, and a bluer outer stellar disc (Raj et al. 2020), which could be tidally induced star formation. However, the star formation could also be compression/shock induced (Raj et al. 2020). We detect the H I cloud of FCC 35 as part of a long tail pointing away from the group centre, making it the most likely galaxy to show evidence of ram pressure stripping. The lower IGM (compared to the ICM) density means that ram pressure stripping is less prevalent in groups. Despite the observational challenges, a few cases have been reported (e.g., Westmeier et al. 2011; Rasmussen et al. 2012; Vulcani et al. 2018; Elagali et al. 2019) and ram pressure is thought to play an important role in the pre-processing of galaxies in groups. FCC 35 is not H I deficient (Fig. 7), implying that the gas has recently been displaced, similar to other galaxies showing early signs of gas removal (e.g., Ramatsoku et al. 2020; Moretti et al. 2020).
ESO 301-IG 11 is a collisional ring galaxy with a H I gas fraction below the median trend, although it is not the most H I deficient galaxy for its stellar mass. There is clear evidence of a tidal interaction in the form of irregular optical morphology, an up-bending (Type-III) break in the stellar radial profile and a slightly extended and asymmetric H I disc. The galaxy is blue in colour, although the outer stellar disc is redder than the inner disc (Raj et al. 2020), implying that the tidal interaction may have restarted star formation in the centre.
The asymmetric H I tail of NGC 1326 is diffuse (< 1 × 10²⁰ atoms cm−2) and only detected on one side of the galaxy. The sensitivity of the opposing side prevents us from detecting H I that diffuse, and we are therefore unable to distinguish whether the extended H I is part of a regular extended H I disc or a signature of pre-processing. With the current H I content, it follows the same H I and H2 trends as the other galaxies in the ongoing category.
The optical morphology and gas scaling relations of NGC 1310 suggest that it is not being pre-processed. The stellar spiral structure is completely intact (Fig. 3), ruling out strong tidal interactions and the H I gas fraction and molecular-to-atomic gas ratios are close to the median trends. However, the H I morphology appears complex and incoherent, with many asymmetric extensions and nearby clouds at different velocities. It is clear that the anomalous H I clouds and extensions are not rotating with the main H I disc (Fig. 4), suggesting external origins. The H I extension in the north-west may be emission from a dwarf satellite galaxy, although a spectroscopic redshift would be required to confirm this. Given the presence of the Hα filaments in the vicinity of NGC 1310, the remaining clouds may be a result of hot gas, cooling in the IGM (and hot halo of NGC 1316) and being captured or accreted onto this galaxy.
Finally, the galaxies that are in the advanced stage of pre-processing are NGC 1316C, NGC 1317, FCC 19, and FCC 46. There is no H I detected in FCC 19, and the other three galaxies have truncated H I discs and are H I deficient as their FHI is more than 3σ from the xGASS median trend (Fig. 7).
NGC 1316C and NGC 1317 have a low H I mass fraction and regular H2 mass fraction. The total gas fraction of these galaxies is low and is driven by the lack of H I. Hence, they have significantly more H2 than H I and a molecular-to-atomic fraction an order of magnitude higher (the highest in our sample) than the median trend (Fig. 7). Both these galaxies have no break (Type-I) in their stellar radial profile (Raj et al. 2020), showing no sign of disruption to their stellar body and their H I is confined to the stellar disc, implying that the outer H I disc has been removed. Ram pressure or gentle tidal interactions are likely to be responsible for removing the outer H I disc of these galaxies. The less dense (compared to the ICM) IGM combined with the group potential allows galaxies to hold on to their gas more effectively than in clusters (Seth & Raychaudhury 2020). The retained atomic gas within the stellar body can then be converted into molecular gas. This scenario is consistent with the findings of the GAs Stripping Phenomena in galaxies with MUSE (GASP; Moretti et al. 2020) project, where pre-processed galaxies in groups (and clusters) have their outer H I removed (via ram pressure) and the remaining H I is efficiently converted into H2. These galaxies in the advanced stage of pre-processing with truncated H I discs and regular amounts of H2 are similar to some galaxies in the Virgo (Cortese et al. 2010) and Fornax cluster (Loni et al. 2021). This suggests that late-type galaxies that have been sufficiently processed lose their outer H I disc and end up with more H2 than H I.
Despite the similarities between NGC 1316C and NGC 1317, these galaxies have likely been pre-processed on different timescales. The stellar mass of NGC 1316C is more than an order of magnitude lower than that of NGC 1317 and according to Raj et al. (2020), NGC 1316C only recently (< 1 Gyr) became a group member while NGC 1317 may have been a group member for up to 8 Gyr. There is no star formation beyond the very inner (< 0.5′) disc of NGC 1317 (Raj et al. 2020) and even though there is only a projected separation of ∼50 kpc between NGC 1316 and NGC 1317, a strong tidal interaction can be reasonably excluded due to the intact spiral structure of NGC 1317 (Richtler et al. 2014; Iodice et al. 2017). The outer H I disc has been removed and possibly lost to the IGM (i.e. potentially identified as the adjacent clouds at the same velocity) as a result of gentle tidal or hydrodynamical interactions. Alternatively, the outer disc may have been converted to other gaseous phases on short timescales (< 1 Gyr). While we are unable to identify the exact mechanisms that are responsible for the truncated H I disc of NGC 1317, it is evident that the galaxy has not had access to cold gas over long timescales.
Out of all the galaxies with H I, FCC 46 is the most H I deficient given its stellar mass. It is a dwarf elliptical with a recent star formation event and H I was first detected as a polar ring orbiting around the optical minor axis by De Rijcke et al. (2013). As the H I is kinematically decoupled from stellar body, the gas was likely accreted from an external source (De Rijcke et al. 2013). Our measured H I mass (Table 2) is consistent with that from De Rijcke et al. (2013), although, as a result of our sensitivity at that position, we do not detect the diffuse H I component that shows the minor axis rotation. A minor merger event (e.g., with a dwarf late type) is consistent with the morphology and ∼107 M⊙ of H I found in FCC 46.
FCC 19 is a dwarf lenticular galaxy (Fig. 3) with a stellar mass of 3.4 × 10⁸ M⊙ (Liu et al. 2019). It has a g − r colour of 0.58 (Iodice et al. 2017), which is similar to the colour of NGC 1310, NGC 1326, NGC 1326A, and ESO 301-IG 11 (Table 2), which have regular H I fractions and are likely forming stars. However, no H I is detected in FCC 19 and we measure a 3σFHI upper limit of −2.3 (Fig. 7) assuming a 100 km s−1 line width. FCC 19 is situated in the most sensitive part of the image, meaning that the galaxy truly does not contain H I. Being so close (70 kpc in projection) to NGC 1316, the tidal field and hot halo of NGC 1316 are likely to have played significant roles in removing the H I from FCC 19. The H I has likely been stripped from the galaxy and lost to the IGM. The stripped H I may also be potentially heated and prevented from cooling.
Lastly, we refrain from assigning a category to FCC 40 because we are unable to ascertain whether the galaxy properties are a result of secular evolution or have been influenced by pre-processing. This galaxy is a low surface brightness (Fig. 3), low-mass (M⋆ = 2.3 × 10⁶ M⊙) blue dwarf elliptical (Table 2) with no H I detected. We place an upper limit on the H I mass (and H I fraction), although it is currently unknown if galaxies of this mass, colour, and morphology are expected to contain H I.
We show the spatial distribution of each group galaxy and their pre-processing status in Fig. 8. The distribution shows a variety of pre-processing stages mixed throughout the group, with no clear radial dependence. The majority of on-going and advanced pre-processing are < 0.5 of the group virial radius, although there are galaxies (i.e. FCC 46 and NGC 1326) that have the same pre-processing status and are located closer to edge of the group, > 0.5 of the group virial radius. At a distance of ∼2 (cluster) virial radii from the Fornax cluster, the Fornax group is located at the distance where pre-processing is thought to be the most efficient (Lewis et al. 2002; Gómez et al. 2003; Verdugo et al. 2008; Mahajan et al. 2012; Haines et al. 2015). In general, it is not clear whether the pre-processing at this infall distance is driven by the group interacting with the cluster, or by local (e.g., tidal and hydrodynamical) interactions within the group. In this instance, it appears that pre-processing is driven by local interactions within the Fornax A group for the following reasons: (i) The massive, central galaxy is at least one order of magnitude more massive (Table 2) than the satellite galaxies. (ii) This central galaxy underwent a merger 1−3 Gyr ago (discussed in Sect. 5.1). (iii) The majority of galaxies close to the group centre (< 0.5 of the group virial radius) show evidence of pre-processing, while the two galaxies (NGC 1326 A/B) closest to the Fornax cluster (and furthest from the group centre) show no evidence of pre-processing. In addition to these points, there are four galaxies (NGC 1310, NGC 1317, ESO 301-IG 11, and FCC 19) that spatially overlap (in projection) with the radio lobes of NGC 1316 (Fig. 8) and therefore may be influenced by the AGN (e.g., Johnson et al. 2015).
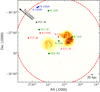 |
Fig. 8. Pre-processing map of the Fornax A group. The background image shows the 1.44 GHz MeerKAT radio continuum emission (Maccagni et al. 2020) and the position of each group galaxy are overlaid with the same markers as Fig. 7. The filled markers represent H I detections, the open markers indicate H I non-detections, where the early, ongoing, advanced, and unclassified pre-processing categories are shown as blue circles, green squares, red diamonds, and black stars, respectively. The red dashed circle denotes the 1.05° (0.38 Mpc) virial radius of the group as adopted in Drinkwater et al. (2001). A 20 kpc scale bar is shown in the bottom right corner and the direction to the Fornax cluster is shown by the black arrow. There is no consistent trend between projected position and pre-processing status, although the majority of group galaxies show evidence of pre-processing. The extent of the NGC 1316 AGN lobes show that it may be playing a role in the pre-processing of neighbouring galaxies and the magnetic field could help the containment of multiphase gas. |
5.3. Gas in the IGM
The H I tails and clouds in the IGM are a direct result of galaxies having their H I removed through hydrodynamical and tidal interactions over the past few Giga-years. As described in Sects. 4.3 and 5.1, the majority (if not all) of the H I in the IGM is due to the Fornax A merger and the recent accretion of satellites.
The amount (1.12 ± 0.2 × 10⁹ M⊙) of detected H I in the IGM is not enough to account for all of the missing H I in the H I deficient group galaxies. However, the outer parts of the image are subject to a large primary beam attenuation and some of the IGM H I may be hiding in the noise. We estimate the amount of H I potentially missed by assuming that we detect all H I in the IGM in the inner 0.1 deg2 (primary beam response > 90%) and that the IGM H I in this area is representative of the IGM throughout the entire group both in terms of amount of H I per unit area and H I column density distribution. Under this assumption, the primary beam attenuation reduces the detected H I by a factor of ∼2.3, implying that we may be missing up to ∼1.5 × 10⁹ M⊙ of H I in the IGM. All the (including the missed) H I in IGM is still not enough to explain all the H I deficient galaxies in the group and clearly gas exists in other phases (i.e. H2 and Hα). Some of the H I in the galaxies has been converted into H2, which explains why the more advanced pre-processed galaxies that have H I, display high molecular-to-atomic gas ratios, and there is Hα in galaxies and the IGM.
Currently, the origin of giant ionised gas filaments in the IGM is not well understood. However, they are typically observed in high-mass groups or low-mass clusters (e.g., halo masses > 1013.5 M⊙), for example the Virgo cluster (Kenney et al. 2008; Boselli et al. 2018a,b; Longobardi et al. 2020) and the Blue Infalling Group (Cortese et al. 2006; Fossati et al. 2019); see Yagi et al. (2017) for a list of clusters that contain long ionised gas filaments. A likely scenario is that cool gas is stripped from an in-falling galaxy, and subsequently ionised, possibly from ionising photons originating from star-forming regions (Poggianti et al. 2018; Fossati et al. 2019) or through non-photo-ionisation mechanisms such as shocks, heat conduction, and magneto-hydrodynamic waves (Boselli et al. 2016). We use the relation in Barger et al. (2013) to estimate the total Hα mass in the IGM (i.e. EELR, SH2, and the filaments) from our Hα photometry (Fig. 6). Assuming a typical Hα temperature of 104 K and electron density of 1 cm−3, we estimate the total Hα mass in the IGM to be ∼2.6 × 10⁶ M⊙, which does not significantly contribute to the total gas budget in the IGM.
Simulations show that ∼104 K (i.e. relatively cool) gas clouds can survive in hot haloes (such as NGC 1316) for cosmological timescales (Nelson et al. 2020). The clouds originate from satellite mergers, and are not in thermal equilibrium, but rather magnetically dominated. Cooling is triggered by the thermal instability and the cool gas is surrounded by an interface of intermediate temperature gas (Nelson et al. 2020). These ingredients can explain how multiphase gas clouds are present in the hot halo of NGC 1316 (Fig. 6), such that the Hα filaments are a result of satellite accretion and the H I has rapidly cooled from these structures, with the ability to survive in the IGM for cosmological timescales.
Recently, Müller et al. (2021) suggest that magnetic fields of the order of 2−4 μG can shield Hα and H I in the ICM/IGM such that the gas clouds do not dissipate. As the Hα filaments and multiphase gas clouds are within the radio lobes (in projection) of NGC 1316, the magnetic field of the lobes (measured to be ∼3 μG by McKinley et al. 2015; Anderson et al. 2018; Maccagni et al. 2020) may be providing additional stability for the Hα and H I to survive. Indeed, the Ant detected by Fomalont et al. (1989) and Bland-Hawthorn et al. (1995) is a small portion of the giant Hα filaments in the IGM. Even though there is currently no H I associated with the Ant, other sections of the Hα filaments show that neutral and ionised gas can coexist in some regions of the IGM, possibly transform into one another, and accrete onto group galaxies (e.g., NGC 1310).
6. Conclusions
We present results from MeerKAT H I commissioning observations of the Fornax A group. Our observations are reduced with the CARACal pipeline and our H I image is sensitive to a column density of 1.4 × 10¹⁹ atoms cm−2 in the field centre. Out of 13 spectroscopically confirmed group members, we detect H I in 10 and report an H I mass upper limit for 2 (the remaining galaxy is outside the field of view of our observation). We also detect H I in the IGM, in the form of clouds, some distributed along coherent structures up to 220 kpc in length. The H I in the IGM is the result of a major merger occurring in the massive, central galaxy NGC 1316, 1−3 Gyr ago, combined with H I being removed from satellite galaxies as they are pre-processed.
We find that 9 out of the 12 galaxies show some evidence of pre-processing in the form of H I deficient galaxies, truncated H I discs, H I tails, and asymmetries. Using the H I morphology and the molecular-to-atomic gas ratios of the galaxy, we classify whether each galaxy is in the early, ongoing, or advanced stage of pre-processing.
Finally, we show that there are giant Hα filaments in the IGM, within the hot halo of NGC 1316. The filaments are likely a result of molecular gas being removed from a satellite galaxy and then ionised. We observe a number of H I clouds associated with the ionised Hα filament, indicating the presence of multiphase gas. Simulations show that hot gas can condense into cool gas within hot haloes and survive for long periods of time on a cosmological timescale, which is consistent with the cool gas clouds we detect within the hot halo of NGC 1316. The multiphase gas is supported by magnetic pressure, implying that the magnetic field in the lobes of the NGC 1316 AGN might be playing an important role in maintaining these multiphase gas clouds. The cycle of AGN activity and cooling gas in the IGM could ultimately result in the cool gas clouds falling back onto the central galaxy. We summarise our main findings as follows:
-
We present new, resolved H I in FCC 35, NGC 1310, and NGC 1326.
-
There is a total of (1.12 ± 0.02) × 109 M⊙ of H I in the IGM, which is dominated by TN and TS (combined H I mass of 6.6 × 10⁸ M⊙). We detect additional components in both tails, an extension in TN, effectively doubling its length, and a cloud in TS that shows coherence with the stellar south-west loop.
-
The H I in the IGM is decoupled from the stars, other than in TS and SH2.
-
We measure 0.9−1.2 × 10⁹ M⊙ of H I associated with NGC 1316, bringing the observed H I mass budget within a factor of ∼2 of the expected value for a 10:1 lenticular + spiral merger occurring ∼2 Gyr ago.
-
Out of the 12 group galaxies in our sample, 2 (NGC 1326A and NGC 1326B) are in the early phase of pre-processing, 5 (FCC 35, ESO 301-IG 11, NGC 1310, NGC 1316, and NGC 1326) are in the ongoing phase of pre-processing, 4 (NGC 1316C, NGC 1317, FCC 19, and FCC 46) are in the advanced stage of pre-processing, and 1 (FCC 40) remains unclassified.
-
Galaxies that are yet to be pre-processed have a typical extended H I disk, high H I content, and molecular-to-atomic gas ratios at least an order of magnitude below the median trend for their stellar mass. Galaxies that are currently being pre-processed typically display H I tails or asymmetric extended disks, while containing regular amounts of H I and H2. Galaxies in the advanced stage of pre-processing have no H I or have lost their outer H I and are efficiently converting their remaining H I to H2.
-
We detect the Ant first observed by Fomalont et al. (1989) as a depolarising feature and later in Hα by Bland-Hawthorn et al. (1995), which turns out to be a small part of long, ionised Hα filaments in the IGM. Localised cooling (potentially assisted by the magnetic field in the lobes of the NGC 1316 AGN) can occur in the Hα filaments to condense and form H I.
In this work, our deep MeerKAT H I image shows many examples of pre-processing in the Fornax A group, such as galaxies with a variety of atypical morphologies and massive amounts of H I in the IGM. The improved sensitivity and resolution of the MFS (Serra et al. 2016) will likely reveal more H I throughout the group and provide kinematic information for the H I in galaxies and the IGM.
The deep H I imaging revealed periodic, artefacts caused by the correlator during this time of commissioning. The artefacts were apparent at the sky position of bright continuum emission. We were able to remove the artefacts by excluding baselines less than 50 m in the cube and 85 m for the single, worst channel. While short baselines are essential for diffuse emission, this equates to 5 and 22 baselines out of 1891.
The lower limit was determined by only including the same H I sources as Serra et al. (2019) and the TN extension, while the upper limit includes the remaining H I clouds in the IGM.
Acknowledgments
The MeerKAT telescope is operated by the South African Radio Astronomy Observatory, which is a facility of the National Research Foundation, an agency of the Department of Science and Innovation. We are grateful to the full MeerKAT team at SARAO for their work on building and commissioning MeerKAT. This paper makes use of the following ALMA data: ADS/JAO.ALMA#2017.1.00129.S. ALMA is a partnership of ESO (representing its member states), NSF (USA), and NINS (Japan), together with NRC (Canada), MOST and ASIAA (Taiwan), and KASI (Republic of Korea), in cooperation with the Republic of Chile. The Joint ALMA Observatory is operated by ESO, AUI/NRAO, and NAOJ. This work also made use of the Inter-University Institute for Data Intensive Astronomy (IDIA) visualisation lab (https://vislab.idia.ac.za). IDIA is a partnership of the University of Cape Town, the University of Pretoria and the University of Western Cape. This project has received funding from the European Research Council (ERC) under the European Union’s Horizon 2020 research and innovation programme (grant agreement no. 679627; project name FORNAX). The research of OS is supported by the South African Research Chairs Initiative of the Department of Science and Innovation and the National Research Foundation. KT acknowledges support from IDIA. The work of KMM is supported by JSPS KAKENHI Grant Number of 19J40004. RFP acknowledges financial support from the European Union’s Horizon 2020 research and innovation program under the Marie Skłodowska-Curie grant agreement No. 721463 to the SUNDIAL ITN network. AV acknowledges the funding from the Emil Aaltonen foundation. PK is partially supported by the BMBF project 05A17PC2 for D-MeerKAT. AS acknowledges funding from the National Research Foundation under the Research Career Advancement and South African Research Chair Initiative programs (SARChI), respectively. FV acknowledges financial support from the Italian Ministry of Foreign Affairs and International Cooperation (MAECI Grant Number ZA18GR02) and the South African NRF (Grant Number 113121) as part of the ISARP RAIOSKY2020 Joint Research Scheme.
References
- Anderson, C. S., Gaensler, B. M., Heald, G. H., et al. 2018, ApJ, 855, 41 [Google Scholar]
- Baldry, I. K., Glazebrook, K., Brinkmann, J., et al. 2004, ApJ, 600, 681 [Google Scholar]
- Balogh, M., Eke, V., Miller, C., et al. 2004, MNRAS, 348, 1355 [Google Scholar]
- Barger, K. A., Haffner, L. M., & Bland-Hawthorn, J. 2013, ApJ, 771, 132 [Google Scholar]
- Bell, E. F., Wolf, C., Meisenheimer, K., et al. 2004, ApJ, 608, 752 [Google Scholar]
- Bianconi, M., Smith, G. P., Haines, C. P., et al. 2018, MNRAS, 473, L79 [Google Scholar]
- Bland-Hawthorn, J., Ekers, R. D., van Breugel, W., Koekemoer, A., & Taylor, K. 1995, ApJ, 447, L77 [Google Scholar]
- Bolatto, A. D., Wolfire, M., & Leroy, A. K. 2013, ARA&A, 51, 207 [Google Scholar]
- Boselli, A., Eales, S., Cortese, L., et al. 2010, PASP, 122, 261 [NASA ADS] [CrossRef] [Google Scholar]
- Boselli, A., Cortese, L., Boquien, M., et al. 2014, A&A, 564, A66 [NASA ADS] [CrossRef] [EDP Sciences] [Google Scholar]
- Boselli, A., Cuillandre, J. C., Fossati, M., et al. 2016, A&A, 587, A68 [NASA ADS] [CrossRef] [EDP Sciences] [Google Scholar]
- Boselli, A., Fossati, M., Consolandi, G., et al. 2018a, A&A, 620, A164 [Google Scholar]
- Boselli, A., Fossati, M., Ferrarese, L., et al. 2018b, A&A, 614, A56 [NASA ADS] [CrossRef] [EDP Sciences] [Google Scholar]
- Calcáneo-Roldán, C., Moore, B., Bland-Hawthorn, J., Malin, D., & Sadler, E. M. 2000, MNRAS, 314, 324 [NASA ADS] [CrossRef] [Google Scholar]
- Cantiello, M., Grado, A., Blakeslee, J. P., et al. 2013, A&A, 552, A106 [NASA ADS] [CrossRef] [EDP Sciences] [Google Scholar]
- Catinella, B., Schiminovich, D., Cortese, L., et al. 2013, MNRAS, 436, 34 [Google Scholar]
- Catinella, B., Saintonge, A., Janowiecki, S., et al. 2018, MNRAS, 476, 875 [NASA ADS] [CrossRef] [Google Scholar]
- Chung, A., van Gorkom, J. H., Kenney, J. D. P., & Vollmer, B. 2007, ApJ, 659, L115 [NASA ADS] [CrossRef] [Google Scholar]
- Chung, S. M., Gonzalez, A. H., Clowe, D., et al. 2009, ApJ, 691, 963 [Google Scholar]
- Cluver, M. E., Jarrett, T. H., Taylor, E. N., et al. 2020, ApJ, 898, 20 [NASA ADS] [CrossRef] [Google Scholar]
- Cortese, L., Gavazzi, G., Boselli, A., et al. 2006, A&A, 453, 847 [Google Scholar]
- Cortese, L., Davies, J. I., Pohlen, M., et al. 2010, A&A, 518, L49 [NASA ADS] [CrossRef] [EDP Sciences] [Google Scholar]
- Courtois, H. M., & Tully, R. B. 2015, MNRAS, 447, 1531 [Google Scholar]
- Cowie, L. L., & McKee, C. F. 1977, ApJ, 211, 135 [Google Scholar]
- Davies, L. J. M., Robotham, A. S. G., Lagos, C. D. P., et al. 2019, MNRAS, 483, 5444 [Google Scholar]
- de Blok, W. J. G., Walter, F., Ferguson, A. M. N., et al. 2018, ApJ, 865, 26 [Google Scholar]
- De Rijcke, S., Buyle, P., & Koleva, M. 2013, ApJ, 770, L26 [Google Scholar]
- Donnari, M., Pillepich, A., Joshi, G. D., et al. 2021, MNRAS, 500, 4004 [Google Scholar]
- Draine, B. T., Dale, D. A., Bendo, G., et al. 2007, ApJ, 663, 866 [Google Scholar]
- Drew, J. E., Gonzalez-Solares, E., Greimel, R., et al. 2014, MNRAS, 440, 2036 [NASA ADS] [CrossRef] [Google Scholar]
- Drinkwater, M. J., Gregg, M. D., Holman, B. A., & Brown, M. J. I. 2001, MNRAS, 326, 1076 [Google Scholar]
- Driver, S. P., Hill, D. T., Kelvin, L. S., et al. 2011, MNRAS, 413, 971 [Google Scholar]
- Eke, V. R., Baugh, C. M., Cole, S., et al. 2004, MNRAS, 348, 866 [NASA ADS] [CrossRef] [Google Scholar]
- Ekers, R. D., Goss, W. M., Wellington, K. J., et al. 1983, A&A, 127, 361 [NASA ADS] [Google Scholar]
- Elagali, A., Staveley-Smith, L., Rhee, J., et al. 2019, MNRAS, 487, 2797 [Google Scholar]
- Ferguson, H. C. 1989, AJ, 98, 367 [Google Scholar]
- Fomalont, E. B., Ebneter, K. A., van Breugel, W. J. M., & Ekers, R. D. 1989, ApJ, 346, L17 [Google Scholar]
- Fossati, M., Fumagalli, M., Gavazzi, G., et al. 2019, MNRAS, 484, 2212 [Google Scholar]
- Fujita, Y. 2004, PASJ, 56, 29 [NASA ADS] [Google Scholar]
- Galametz, M., Kennicutt, R. C., Albrecht, M., et al. 2012, MNRAS, 425, 763 [Google Scholar]
- Gómez, P. L., Nichol, R. C., Miller, C. J., et al. 2003, ApJ, 584, 210 [NASA ADS] [CrossRef] [Google Scholar]
- Goudfrooij, P., Alonso, M. V., Maraston, C., & Minniti, D. 2001, MNRAS, 328, 237 [Google Scholar]
- Haines, C. P., Gargiulo, A., La Barbera, F., et al. 2007, MNRAS, 381, 7 [NASA ADS] [CrossRef] [Google Scholar]
- Haines, C. P., Pereira, M. J., Smith, G. P., et al. 2013, ApJ, 775, 126 [Google Scholar]
- Haines, C. P., Pereira, M. J., Smith, G. P., et al. 2015, ApJ, 806, 101 [NASA ADS] [CrossRef] [Google Scholar]
- Hatt, D., Freedman, W. L., Madore, B. F., et al. 2018, ApJ, 866, 145 [Google Scholar]
- Hess, K. M., Cluver, M. E., Yahya, S., et al. 2017, MNRAS, 464, 957 [Google Scholar]
- Horellou, C., Black, J. H., van Gorkom, J. H., et al. 2001, A&A, 376, 837 [NASA ADS] [CrossRef] [EDP Sciences] [Google Scholar]
- Ianjamasimanana, R., Namumba, B., Ramaila, A. J. T., et al. 2020, MNRAS, 497, 4795 [Google Scholar]
- Iodice, E., Capaccioli, M., Grado, A., et al. 2016, ApJ, 820, 42 [NASA ADS] [CrossRef] [Google Scholar]
- Iodice, E., Spavone, M., Capaccioli, M., et al. 2017, ApJ, 839, 21 [NASA ADS] [CrossRef] [Google Scholar]
- Jarrett, T. H., Comrie, A., Marchetti, L., et al. 2020, ArXiv e-prints [arXiv:2012.10342] [Google Scholar]
- Johnson, M. C., Kamphuis, P., Koribalski, B. S., et al. 2015, MNRAS, 451, 3192 [Google Scholar]
- Jonas, J. 2016, Proceedings of MeerKAT Science: On the Pathway to the SKA, 1 [Google Scholar]
- Józsa, G. I. G., White, S. V., Thorat, K., et al. 2020, in ADASS XXIX, eds. R. Pizzo, E. Deul, J. D. Mol, J. de Plaa, & H. Verkouter, ASP Conf. Ser., 527, 635 [Google Scholar]
- Kenney, J. D. P., Tal, T., Crowl, H. H., Feldmeier, J., & Jacoby, G. H. 2008, ApJ, 687, L69 [Google Scholar]
- Kenyon, J. S., Smirnov, O. M., Grobler, T. L., & Perkins, S. J. 2018, MNRAS, 478, 2399 [Google Scholar]
- Kleiner, D., Koribalski, B. S., Serra, P., et al. 2019, MNRAS, 488, 5352 [Google Scholar]
- Koribalski, B. S. 2012, PASA, 29, 359 [Google Scholar]
- Koribalski, B. S., Staveley-Smith, L., Kilborn, V. A., et al. 2004, AJ, 128, 16 [NASA ADS] [CrossRef] [Google Scholar]
- Kreckel, K., Platen, E., Aragón-Calvo, M. A., et al. 2012, AJ, 144, 16 [NASA ADS] [CrossRef] [Google Scholar]
- Lanz, L., Jones, C., Forman, W. R., et al. 2010, ApJ, 721, 1702 [Google Scholar]
- Lewis, I., Balogh, M., De Propris, R., et al. 2002, MNRAS, 334, 673 [NASA ADS] [CrossRef] [Google Scholar]
- Liu, Y., Peng, E. W., Jordán, A., et al. 2019, ApJ, 875, 156 [Google Scholar]
- Longobardi, A., Boselli, A., Fossati, M., et al. 2020, A&A, 644, A161 [EDP Sciences] [Google Scholar]
- Loni, A., Serra, P., Kleiner, D., et al. 2021, ArXiv e-prints [arXiv:2102.01185] [Google Scholar]
- Maccagni, F. M., Murgia, M., Serra, P., et al. 2020, A&A, 634, A9 [NASA ADS] [CrossRef] [EDP Sciences] [Google Scholar]
- Mackie, G., & Fabbiano, G. 1998, AJ, 115, 514 [Google Scholar]
- Maddox, N., Serra, P., Venhola, A., et al. 2019, MNRAS, 490, 1666 [CrossRef] [Google Scholar]
- Mahajan, S. 2013, MNRAS, 431, L117 [Google Scholar]
- Mahajan, S., Raychaudhury, S., & Pimbblet, K. A. 2012, MNRAS, 427, 1252 [Google Scholar]
- Marchetti, L., Jarrett, T. H., Comrie, A., et al. 2020, ArXiv e-prints [arXiv:2012.11553] [Google Scholar]
- Mauch, T., Cotton, W. D., Condon, J. J., et al. 2020, ApJ, 888, 61 [NASA ADS] [CrossRef] [Google Scholar]
- McKinley, B., Yang, R., López-Caniego, M., et al. 2015, MNRAS, 446, 3478 [Google Scholar]
- Meyer, M. J., Zwaan, M. A., Webster, R. L., et al. 2004, MNRAS, 350, 1195 [NASA ADS] [CrossRef] [Google Scholar]
- Moretti, A., Paladino, R., Poggianti, B. M., et al. 2020, ApJ, 897, L30 [CrossRef] [Google Scholar]
- Morokuma-Matsui, K., Serra, P., Maccagni, F. M., et al. 2019, PASJ, 71, 85 [Google Scholar]
- Müller, A., Poggianti, B. M., Pfrommer, C., et al. 2021, Nat. Astron., 5, 159 [Google Scholar]
- Nelson, D., Sharma, P., Pillepich, A., et al. 2020, MNRAS, 498, 2391 [Google Scholar]
- Nulsen, P. E. J. 1982, MNRAS, 198, 1007 [Google Scholar]
- Offringa, A. R., & Smirnov, O. 2017, MNRAS, 471, 301 [NASA ADS] [CrossRef] [Google Scholar]
- Offringa, A. R., van de Gronde, J. J., & Roerdink, J. B. T. M. 2012, A&A, 539, A95 [NASA ADS] [CrossRef] [EDP Sciences] [Google Scholar]
- Offringa, A. R., McKinley, B., Hurley-Walker, N., et al. 2014, MNRAS, 444, 606 [NASA ADS] [CrossRef] [Google Scholar]
- Peng, Y.-J., Lilly, S. J., Kovač, K., et al. 2010, ApJ, 721, 193 [NASA ADS] [CrossRef] [Google Scholar]
- Poggianti, B. M., Moretti, A., Gullieuszik, M., et al. 2018, ApJ, 853, 200 [Google Scholar]
- Porter, S. C., Raychaudhury, S., Pimbblet, K. A., & Drinkwater, M. J. 2008, MNRAS, 388, 1152 [NASA ADS] [Google Scholar]
- Putman, M. E., Bureau, M., Mould, J. R., Staveley-Smith, L., & Freeman, K. C. 1998, AJ, 115, 2345 [Google Scholar]
- Raj, M. A., Iodice, E., Napolitano, N. R., et al. 2019, A&A, 628, A4 [Google Scholar]
- Raj, M. A., Iodice, E., Napolitano, N. R., et al. 2020, A&A, 640, A137 [EDP Sciences] [Google Scholar]
- Ramatsoku, M., Murgia, M., Vacca, V., et al. 2020, A&A, 636, L1 [Google Scholar]
- Rasmussen, J., Ponman, T. J., Verdes-Montenegro, L., Yun, M. S., & Borthakur, S. 2008, MNRAS, 388, 1245 [Google Scholar]
- Rasmussen, J., Bai, X.-N., Mulchaey, J. S., et al. 2012, ApJ, 747, 31 [Google Scholar]
- Richtler, T., Hilker, M., Kumar, B., et al. 2014, A&A, 569, A41 [NASA ADS] [CrossRef] [EDP Sciences] [Google Scholar]
- Roberts, I. D., & Parker, L. C. 2017, MNRAS, 467, 3268 [Google Scholar]
- Robotham, A. S. G., Norberg, P., Driver, S. P., et al. 2011, MNRAS, 416, 2640 [NASA ADS] [CrossRef] [Google Scholar]
- Schawinski, K., Urry, C. M., Simmons, B. D., et al. 2014, MNRAS, 440, 889 [Google Scholar]
- Schröder, A., Drinkwater, M. J., & Richter, O. G. 2001, A&A, 376, 98 [NASA ADS] [CrossRef] [EDP Sciences] [Google Scholar]
- Schweizer, F. 1980, ApJ, 237, 303 [NASA ADS] [CrossRef] [Google Scholar]
- Serra, P., Jurek, R., & Flöer, L. 2012, PASA, 29, 296 [NASA ADS] [CrossRef] [Google Scholar]
- Serra, P., Westmeier, T., Giese, N., et al. 2015, MNRAS, 448, 1922 [Google Scholar]
- Serra, P., de Blok, W. J. G., Bryan, G. L., et al. 2016, Proceedings of MeerKAT Science: On the Pathway to the SKA, 8 [Google Scholar]
- Serra, P., Maccagni, F. M., Kleiner, D., et al. 2019, A&A, 628, A122 [NASA ADS] [CrossRef] [EDP Sciences] [Google Scholar]
- Seth, R., & Raychaudhury, S. 2020, MNRAS, 497, 466 [Google Scholar]
- Sivitilli, A. K., Comrie, A., Marchetti, L., & Jarrett, T. H. 2021, ArXiv e-prints [arXiv:2103.14397] [Google Scholar]
- Steinhauser, D., Schindler, S., & Springel, V. 2016, A&A, 591, A51 [NASA ADS] [CrossRef] [EDP Sciences] [Google Scholar]
- Taylor, E. N., Hopkins, A. M., Baldry, I. K., et al. 2011, MNRAS, 418, 1587 [NASA ADS] [CrossRef] [Google Scholar]
- Theureau, G., Bottinelli, L., Coudreau-Durand, N., et al. 1998, A&AS, 130, 333 [Google Scholar]
- Venhola, A., Peletier, R., Laurikainen, E., et al. 2018, A&A, 620, A165 [NASA ADS] [CrossRef] [EDP Sciences] [Google Scholar]
- Venhola, A., Peletier, R., Laurikainen, E., et al. 2019, A&A, 625, A143 [EDP Sciences] [Google Scholar]
- Verdugo, M., Ziegler, B. L., & Gerken, B. 2008, A&A, 486, 9 [NASA ADS] [CrossRef] [EDP Sciences] [Google Scholar]
- Vulcani, B., Poggianti, B. M., Jaffé, Y. L., et al. 2018, MNRAS, 480, 3152 [Google Scholar]
- Weinmann, S. M., van den Bosch, F. C., Yang, X., & Mo, H. J. 2006, MNRAS, 366, 2 [Google Scholar]
- Westmeier, T., Braun, R., & Koribalski, B. S. 2011, MNRAS, 410, 2217 [Google Scholar]
- Wetzel, A. R., Tinker, J. L., & Conroy, C. 2012, MNRAS, 424, 232 [Google Scholar]
- Woo, J., Dekel, A., Faber, S. M., et al. 2013, MNRAS, 428, 3306 [Google Scholar]
- Yagi, M., Yoshida, M., Gavazzi, G., et al. 2017, ApJ, 839, 65 [Google Scholar]
Appendix A: Hα image comparison
In Fig. A.1, we show the Hα image after the standard reduction and the image we used that modelled and subtracted the background of the original image using a median filter. The giant Hα filaments can be seen in the original image, however, it is dominated by the over- and under-subtracted artefacts and has a variable background.
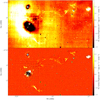 |
Fig. A.1. Comparison of the original and filtered Hα images. Top image: Hα image after the standard data reduction process. Bottom image: Hα image we present in our work that iteratively modelled and subtracted (described in Sect. 3.2) the background of the original image. Both images are presented on the same scale. The original image is clearly dominated by over- and under-subtracted artefacts, while the new image has a smooth and uniform background, which retains the majority of the real Hα emission. Some diffuse Hα emission is lost in this process, however, the new image is a significant improvement that shows the underlying structure of the giant Hα filaments in the IGM. |
The success of our median smoothing and model background subtraction is dependent on how well the real Hα is masked. Anything that is included in the mask, by definition, is included in the final image. This is especially challenging for diffuse Hα emission located in areas with high background noise. The converse is also true: if spurious Hα emission is included in the mask, it will also be in the final image.
To mitigate these issues as best as possible, we used a conservative approach to carefully mask the real Hα that was clearly visible in the original image. It is particularly difficult to mask real Hα emission in areas with a highly variable background and where the background is significantly under subtracted. The result is that some of the diffuse Hα emission is lost and not reproduced in the final image. As this is an iterative process, we were able to recover Hα emission in the most over-subtracted regions of the image. Even though we cannot conserve 100% of the Hα emission in this process, the purpose of this is to present the underlying structure of the new, giant Hα filaments detected in the IGM.
All Tables
Basic properties of the group galaxies and H I detected sources within the H I image field of view.
All Figures
|
Fig. 1. Sum of the pixel values as a function of the mean pixel value for all sources detected with SoFiA. The blue points indicate the positive detections and the red points indicate the negative detections (Serra et al. 2012). Detected H I clouds are shown as black crosses. The dotted line shows the per-source integrated S/N of 4. Only positive sources above this threshold and with a reliability > 0.65 are retained in our final catalogue. The chosen integrated S/N of 4 is a conservative threshold as it is closer to area of parameter space occupied by the most statistically significant detections (i.e. the positive sources with a high sum/noise for their mean/noise value) and is clearly above the edge of non-statistically significant detections (i.e. where the density of positive sources is approximately the same as the density of negative sources). Owing to this conservative threshold, the detected H I clouds, while often diffuse, occupy the parameter space of real, reliable H I emission. |
| In the text | |
|
Fig. 2. Primary beam-corrected constant H I contours from MeerKAT (blue) overlaid on a FDS (Iodice et al. 2016) gri stacked optical image. The lowest contour represents the 3σ column density level of NH I = 1.4 × 10¹⁹ atoms cm−2 over a 44.1 km s−1 channel, where the contours increase by a factor of 3n (n = 0, 1, 2, ...). The group galaxies are labelled and the galaxies not detected in H I are outlined by a dashed black ellipse. The grey circles indicate the sensitivity of the primary beam (Mauch et al. 2020) at 50%, 10%, and 2%. The red dashed circle denotes the 1.05° (0.38 Mpc) virial radius of the group as adopted in Drinkwater et al. (2001), where the restoring beam (33.0″ × 29.2″) is shown in the bottom left corner and a scale bar indicating 20 kpc at the distance of Fornax A in the bottom right corner. The direction to the Fornax cluster is shown by the black arrow. In H I, we detect 10 (out of 12) galaxies, previously known clouds and streams in the IGM and a population of new H I clouds in the IGM. The previously known IGM H I structures are labelled in Fig. 4 for clarity. |
| In the text | |
|
Fig. 3. Optical three-colour composite of each group galaxy in our sample with overlaid H I contours. The colour image is comprised of the g-, r-, and i-band filters from the FDS (Iodice et al. 2016); the white dashed contour shows the most sensitive, constant column density of NH I = 1.4 × 10¹⁹ atoms cm−2 from Fig. 2 and the blue contours start from the local column density sensitivity (i.e. 1.4 × 10¹⁹ atoms cm−2 scaled by the primary beam response; see top left corner of each cutout) and increase by a factor of 3n with n = 0, 1, 2, ..., at each step. For non-detections, the 3σ H I column density upper limit over a single channel is shown in red in the top left of the cutout. The restoring beam (33.0″ × 29.2″) is shown in orange in the bottom left corner and a 5 kpc scale bar is shown in the bottom right corner. |
| In the text | |
|
Fig. 4. H I velocity field, where the known galaxies and previously detected clouds and tails in the IGM are labelled. As in Fig. 2, the two galaxies not detected in H I are outlined by black, dashed ellipses and the direction to the Fornax cluster is shown by the black arrow. The velocity colour bar is centred on the systemic velocity of the BGG (NGC 1316) at 1760 km s−1. The grey circles indicate the sensitivity of the primary beam (Mauch et al. 2020) at 50%, 10%, and 2%. The red dashed circle denotes the 1.05° (0.38 Mpc) virial radius of the group as adopted in Drinkwater et al. (2001), where the restoring (33.0″ × 29.2″) beam and scale bar are shown in the bottom corners. The clouds that make up TN have a new, extended component, effectively doubling the size compared to its original discovery in Serra et al. (2019). |
| In the text | |
|
Fig. 5. Low surface brightness (star removed) image of NGC 1316 in g-band, observed with the VST (Iodice et al. 2017). The known (Schweizer 1980; Richtler et al. 2014; Iodice et al. 2017) stellar loops are labelled and outlined by the dashed green lines. The H I is shown by the solid blue contours and the previously known H I clouds are labelled. The clouds that make up TS (including the new western H I cloud) overlap with the stellar SW loop. There is some overlap with some H I clouds in the north (e.g., CN, 2 and the clouds to the west) and the optical loop L7. Overall, there is no consistent correlation between the stellar loops and the distribution of H I clouds. |
| In the text | |
|
Fig. 6. OmegaCAM Hα emission showing the ionised gas in the vicinity of NGC 1316. The blue contour shows the majority of the western lobe of NGC 1316 in radio continuum at a (conservative) level of 1.3 mJy beam−1 from Maccagni et al. (2020). The white contours show the 3σ H I column density of 1.4 × 10¹⁹ atoms cm−2 (over 44.1 km s−1) from this work. Known sources (i.e. galaxies and IGM H I) and multiphase (MP) gas clouds that contain Hα and H I as well as the Ant-like feature from Fomalont et al. (1989) are labelled. This image reveals long filaments of ionised gas in the IGM. |
| In the text | |
|
Fig. 7. Atomic and molecular gas scaling ratios. In all figures, the early, ongoing, and advanced pre-processing categories are shown as blue circles, green squares, and red diamonds, respectively and H2 upper limits are depicted by arrows. Solid markers indicate H I detections and open markers are non-detections. FCC 40 is not assigned to any pre-processing category and is shown as the open black star. Top left panel: H I gas fraction compared to galaxies from the HRS (Boselli et al. 2010, 2014) and VGS (Kreckel et al. 2012) (grey points) that show the typical scatter in FHI. The orange shaded region indicates the median trend from xGASS (Catinella et al. 2018). Top right panel: total gas fraction of our galaxies compared to the median xGASS-CO trend (Catinella et al. 2018) (orange shaded region). Bottom left panel: molecular-to-atomic-gas ratio of our galaxies compared to the median xGASS-CO trend (Catinella et al. 2018) (orange shaded region). Bottom right panel: H2 gas fraction as a function of H I gas fraction, showing constant ratios of 100%, 30%, 10%, and 3%. Overall, the galaxies in the early category are H I rich, the galaxies in the ongoing category typically follow the xGASS and xGASS-CO median scaling relations (Catinella et al. 2018), while galaxies in the advanced category have no H I or are H I-deficient with irregularly high H2-to-H I ratios. |
| In the text | |
|
Fig. 8. Pre-processing map of the Fornax A group. The background image shows the 1.44 GHz MeerKAT radio continuum emission (Maccagni et al. 2020) and the position of each group galaxy are overlaid with the same markers as Fig. 7. The filled markers represent H I detections, the open markers indicate H I non-detections, where the early, ongoing, advanced, and unclassified pre-processing categories are shown as blue circles, green squares, red diamonds, and black stars, respectively. The red dashed circle denotes the 1.05° (0.38 Mpc) virial radius of the group as adopted in Drinkwater et al. (2001). A 20 kpc scale bar is shown in the bottom right corner and the direction to the Fornax cluster is shown by the black arrow. There is no consistent trend between projected position and pre-processing status, although the majority of group galaxies show evidence of pre-processing. The extent of the NGC 1316 AGN lobes show that it may be playing a role in the pre-processing of neighbouring galaxies and the magnetic field could help the containment of multiphase gas. |
| In the text | |
|
Fig. A.1. Comparison of the original and filtered Hα images. Top image: Hα image after the standard data reduction process. Bottom image: Hα image we present in our work that iteratively modelled and subtracted (described in Sect. 3.2) the background of the original image. Both images are presented on the same scale. The original image is clearly dominated by over- and under-subtracted artefacts, while the new image has a smooth and uniform background, which retains the majority of the real Hα emission. Some diffuse Hα emission is lost in this process, however, the new image is a significant improvement that shows the underlying structure of the giant Hα filaments in the IGM. |
| In the text | |
Current usage metrics show cumulative count of Article Views (full-text article views including HTML views, PDF and ePub downloads, according to the available data) and Abstracts Views on Vision4Press platform.
Data correspond to usage on the plateform after 2015. The current usage metrics is available 48-96 hours after online publication and is updated daily on week days.
Initial download of the metrics may take a while.