Fig. 1.
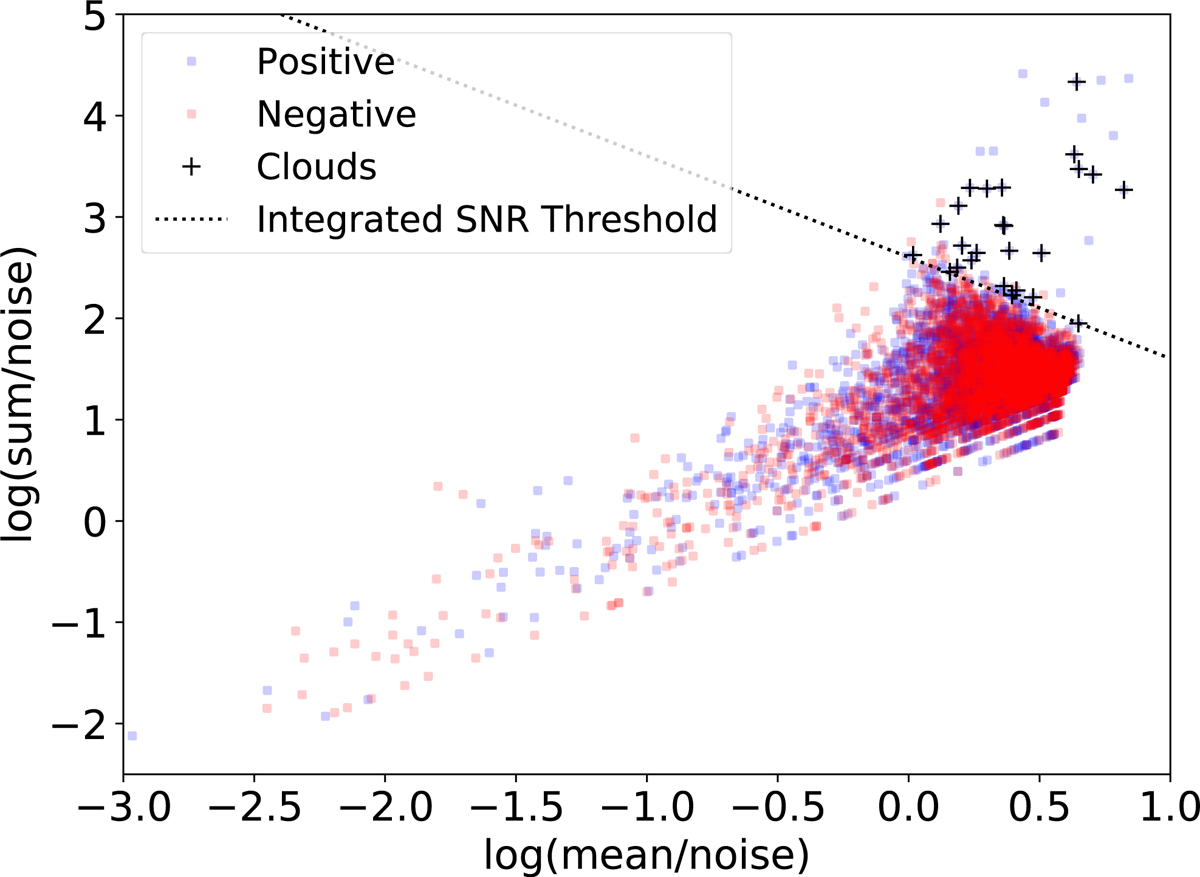
Sum of the pixel values as a function of the mean pixel value for all sources detected with SoFiA. The blue points indicate the positive detections and the red points indicate the negative detections (Serra et al. 2012). Detected H I clouds are shown as black crosses. The dotted line shows the per-source integrated S/N of 4. Only positive sources above this threshold and with a reliability > 0.65 are retained in our final catalogue. The chosen integrated S/N of 4 is a conservative threshold as it is closer to area of parameter space occupied by the most statistically significant detections (i.e. the positive sources with a high sum/noise for their mean/noise value) and is clearly above the edge of non-statistically significant detections (i.e. where the density of positive sources is approximately the same as the density of negative sources). Owing to this conservative threshold, the detected H I clouds, while often diffuse, occupy the parameter space of real, reliable H I emission.
Current usage metrics show cumulative count of Article Views (full-text article views including HTML views, PDF and ePub downloads, according to the available data) and Abstracts Views on Vision4Press platform.
Data correspond to usage on the plateform after 2015. The current usage metrics is available 48-96 hours after online publication and is updated daily on week days.
Initial download of the metrics may take a while.