Fig. A.1.
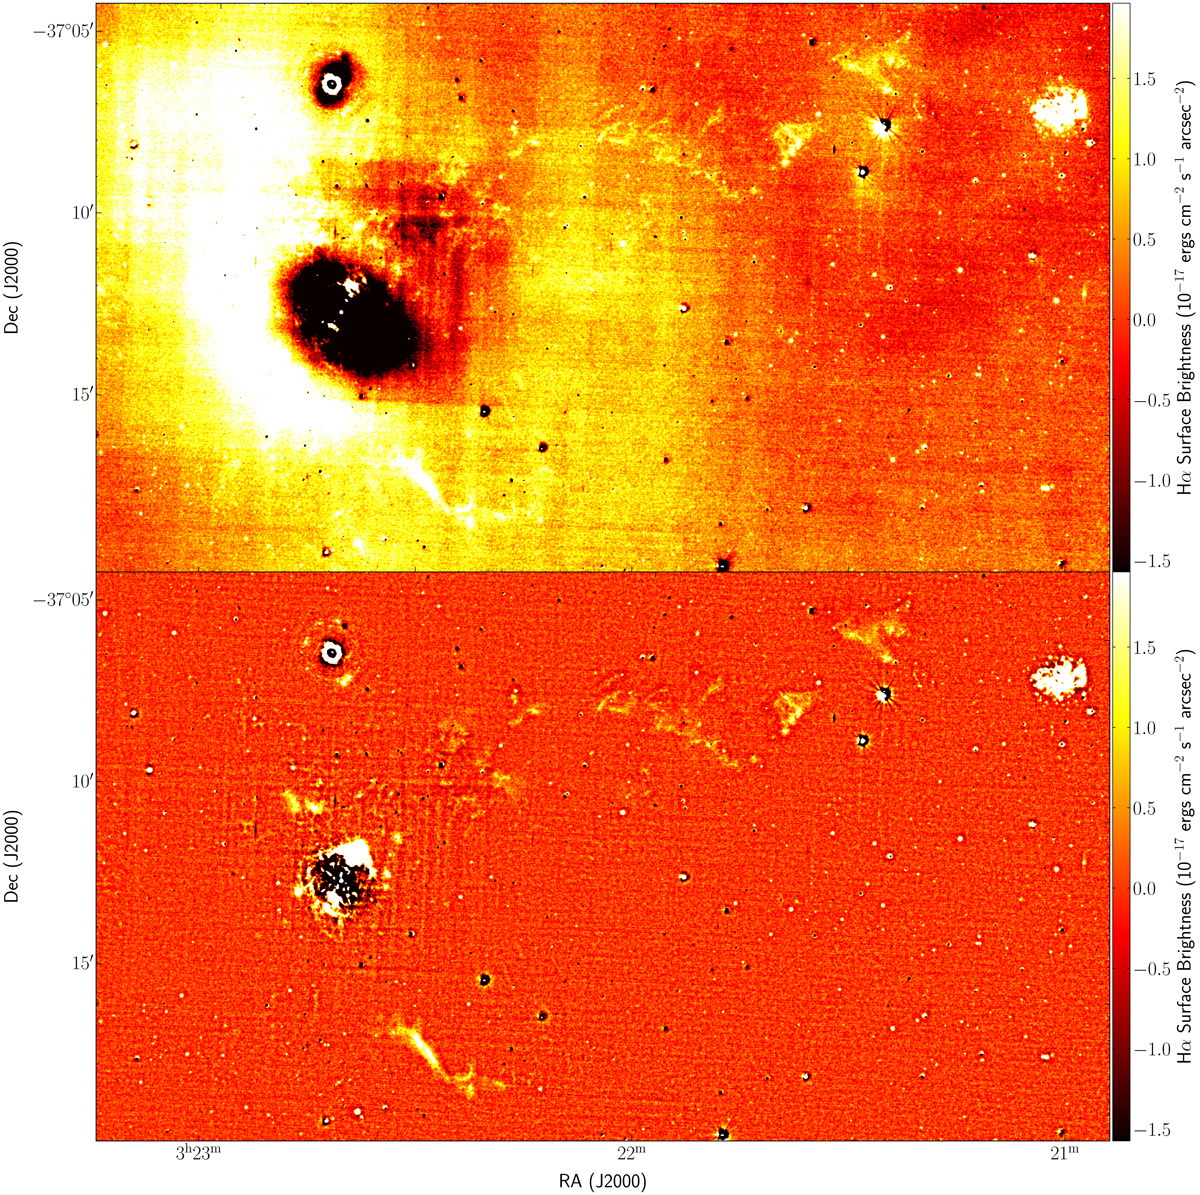
Comparison of the original and filtered Hα images. Top image: Hα image after the standard data reduction process. Bottom image: Hα image we present in our work that iteratively modelled and subtracted (described in Sect. 3.2) the background of the original image. Both images are presented on the same scale. The original image is clearly dominated by over- and under-subtracted artefacts, while the new image has a smooth and uniform background, which retains the majority of the real Hα emission. Some diffuse Hα emission is lost in this process, however, the new image is a significant improvement that shows the underlying structure of the giant Hα filaments in the IGM.
Current usage metrics show cumulative count of Article Views (full-text article views including HTML views, PDF and ePub downloads, according to the available data) and Abstracts Views on Vision4Press platform.
Data correspond to usage on the plateform after 2015. The current usage metrics is available 48-96 hours after online publication and is updated daily on week days.
Initial download of the metrics may take a while.