Fig. 2.
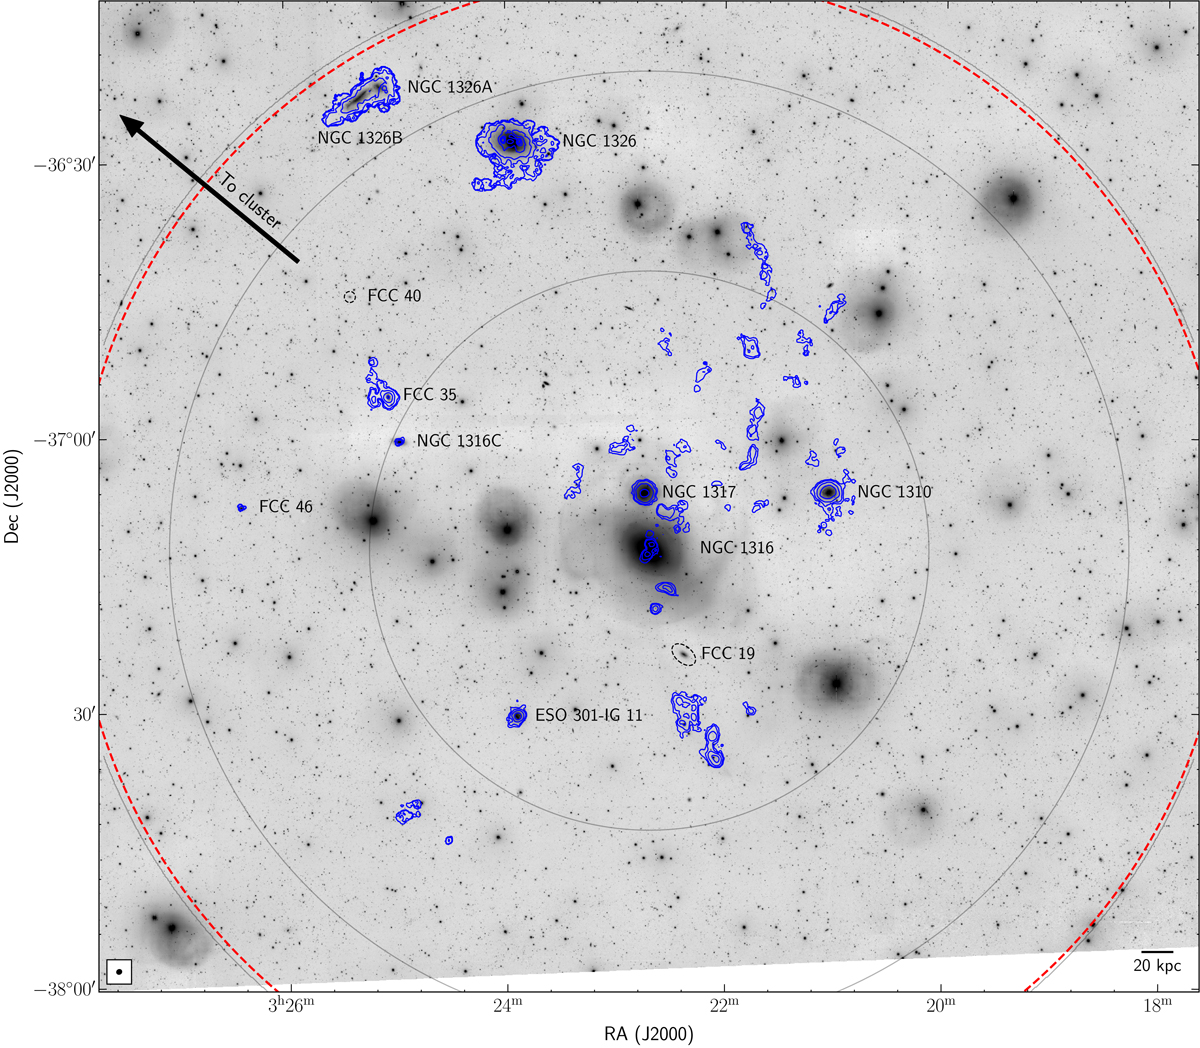
Primary beam-corrected constant H I contours from MeerKAT (blue) overlaid on a FDS (Iodice et al. 2016) gri stacked optical image. The lowest contour represents the 3σ column density level of NH I = 1.4 × 10¹⁹ atoms cm−2 over a 44.1 km s−1 channel, where the contours increase by a factor of 3n (n = 0, 1, 2, ...). The group galaxies are labelled and the galaxies not detected in H I are outlined by a dashed black ellipse. The grey circles indicate the sensitivity of the primary beam (Mauch et al. 2020) at 50%, 10%, and 2%. The red dashed circle denotes the 1.05° (0.38 Mpc) virial radius of the group as adopted in Drinkwater et al. (2001), where the restoring beam (33.0″ × 29.2″) is shown in the bottom left corner and a scale bar indicating 20 kpc at the distance of Fornax A in the bottom right corner. The direction to the Fornax cluster is shown by the black arrow. In H I, we detect 10 (out of 12) galaxies, previously known clouds and streams in the IGM and a population of new H I clouds in the IGM. The previously known IGM H I structures are labelled in Fig. 4 for clarity.
Current usage metrics show cumulative count of Article Views (full-text article views including HTML views, PDF and ePub downloads, according to the available data) and Abstracts Views on Vision4Press platform.
Data correspond to usage on the plateform after 2015. The current usage metrics is available 48-96 hours after online publication and is updated daily on week days.
Initial download of the metrics may take a while.