Fig. 8.
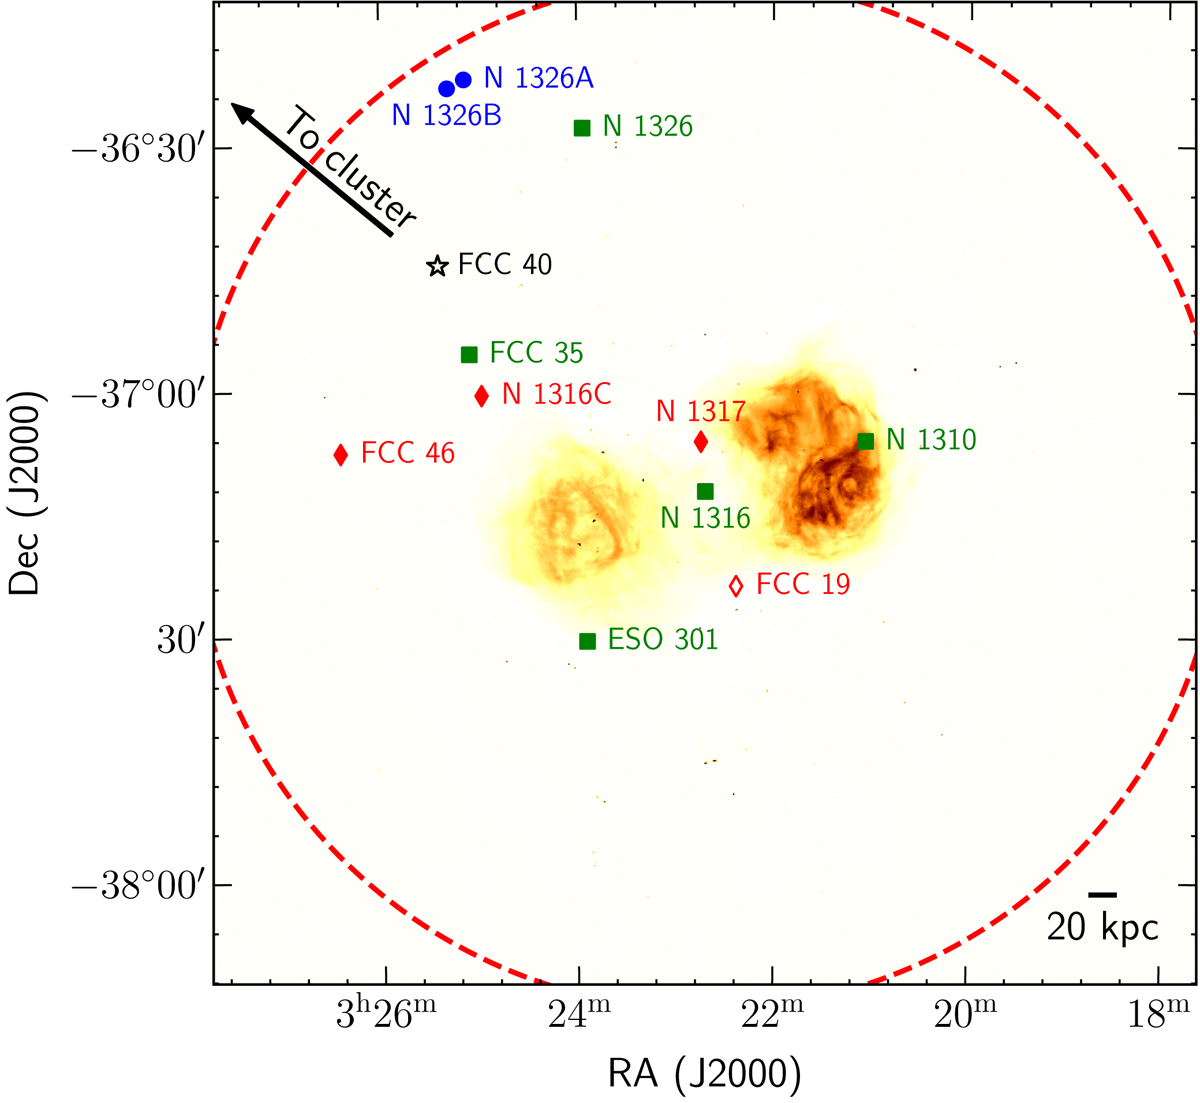
Pre-processing map of the Fornax A group. The background image shows the 1.44 GHz MeerKAT radio continuum emission (Maccagni et al. 2020) and the position of each group galaxy are overlaid with the same markers as Fig. 7. The filled markers represent H I detections, the open markers indicate H I non-detections, where the early, ongoing, advanced, and unclassified pre-processing categories are shown as blue circles, green squares, red diamonds, and black stars, respectively. The red dashed circle denotes the 1.05° (0.38 Mpc) virial radius of the group as adopted in Drinkwater et al. (2001). A 20 kpc scale bar is shown in the bottom right corner and the direction to the Fornax cluster is shown by the black arrow. There is no consistent trend between projected position and pre-processing status, although the majority of group galaxies show evidence of pre-processing. The extent of the NGC 1316 AGN lobes show that it may be playing a role in the pre-processing of neighbouring galaxies and the magnetic field could help the containment of multiphase gas.
Current usage metrics show cumulative count of Article Views (full-text article views including HTML views, PDF and ePub downloads, according to the available data) and Abstracts Views on Vision4Press platform.
Data correspond to usage on the plateform after 2015. The current usage metrics is available 48-96 hours after online publication and is updated daily on week days.
Initial download of the metrics may take a while.