Fig. 3.
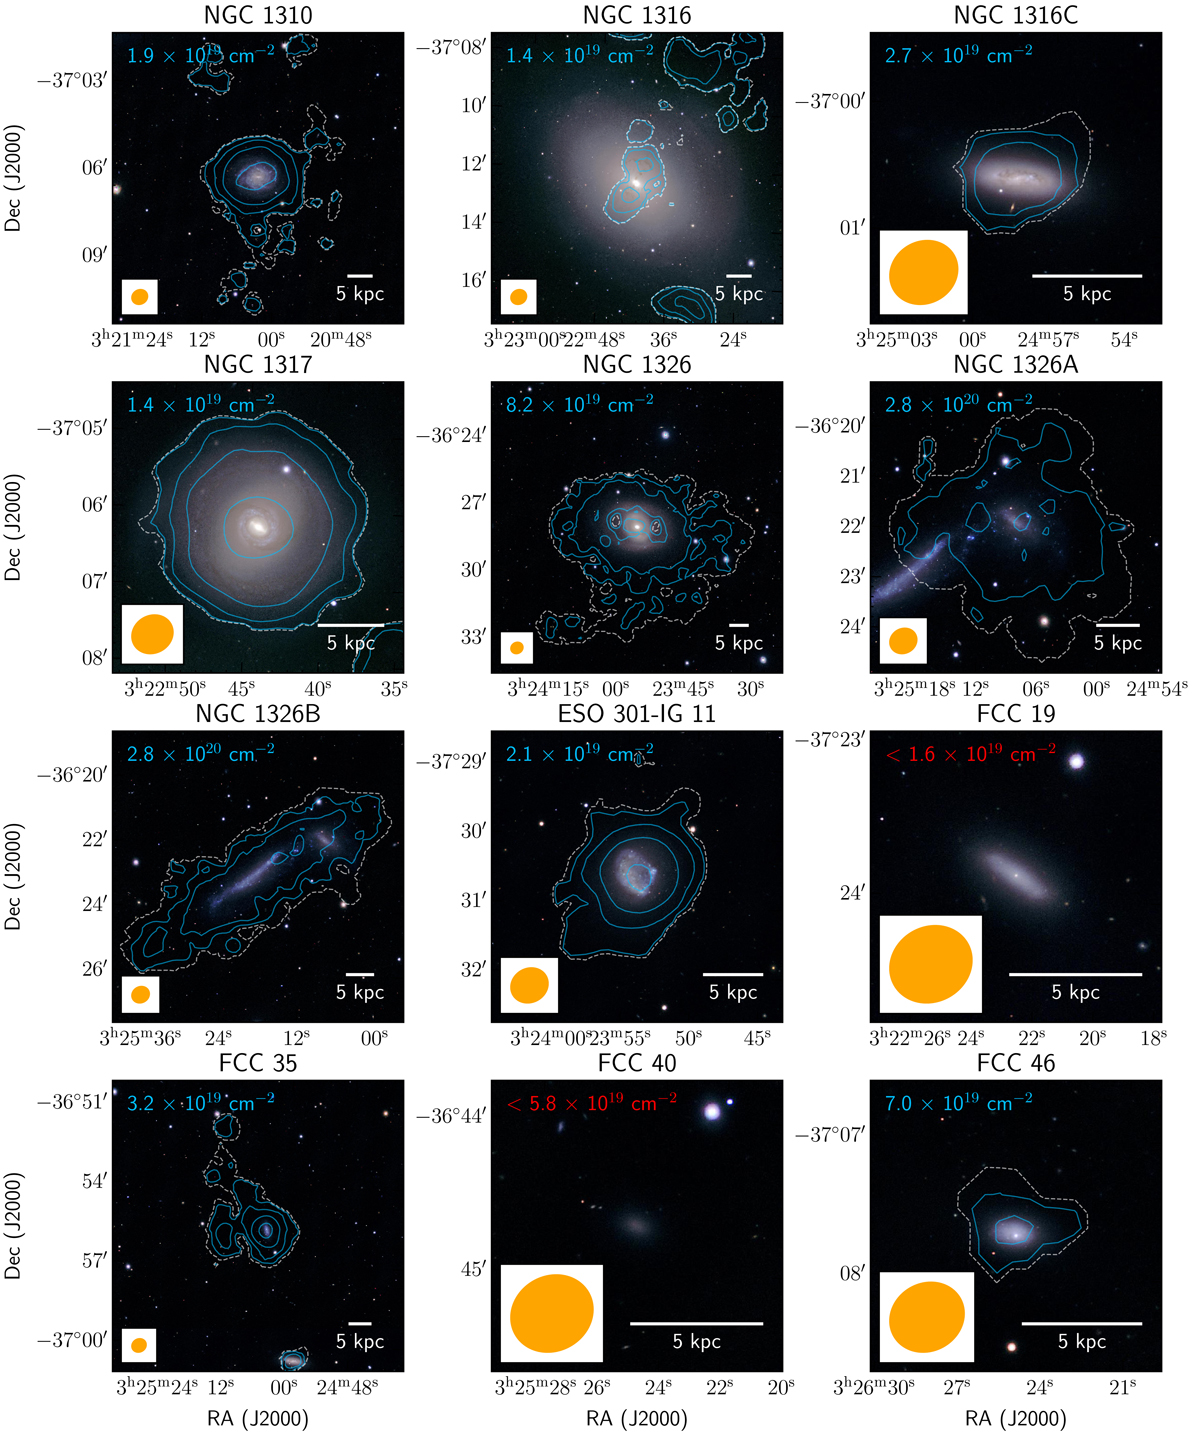
Optical three-colour composite of each group galaxy in our sample with overlaid H I contours. The colour image is comprised of the g-, r-, and i-band filters from the FDS (Iodice et al. 2016); the white dashed contour shows the most sensitive, constant column density of NH I = 1.4 × 10¹⁹ atoms cm−2 from Fig. 2 and the blue contours start from the local column density sensitivity (i.e. 1.4 × 10¹⁹ atoms cm−2 scaled by the primary beam response; see top left corner of each cutout) and increase by a factor of 3n with n = 0, 1, 2, ..., at each step. For non-detections, the 3σ H I column density upper limit over a single channel is shown in red in the top left of the cutout. The restoring beam (33.0″ × 29.2″) is shown in orange in the bottom left corner and a 5 kpc scale bar is shown in the bottom right corner.
Current usage metrics show cumulative count of Article Views (full-text article views including HTML views, PDF and ePub downloads, according to the available data) and Abstracts Views on Vision4Press platform.
Data correspond to usage on the plateform after 2015. The current usage metrics is available 48-96 hours after online publication and is updated daily on week days.
Initial download of the metrics may take a while.