| Issue |
A&A
Volume 634, February 2020
|
|
|---|---|---|
| Article Number | L14 | |
| Number of page(s) | 6 | |
| Section | Letters to the Editor | |
| DOI | https://doi.org/10.1051/0004-6361/201937217 | |
| Published online | 02 March 2020 | |
Letter to the Editor
Deceptively cold dust in the massive starburst galaxy GN20 at z ∼ 4
1
Cosmic Dawn Center (DAWN), Lyngbyvej 2, 2100 Copenhagen Ø, Denmark
2
Niels Bohr Institute, University of Copenhagen, Blegdamsvej 17, 2100 Copenhagen, Denmark
e-mail: This email address is being protected from spambots. You need JavaScript enabled to view it.
3
DTU-Space, Technical University of Denmark, Elektrovej 327, 2800 Kgs. Lyngby, Denmark
4
CEA, IRFU, DAp, AIM, Université Paris-Saclay, Université Paris Diderot, Sorbonne Paris Cité, CNRS, 91191 Gif-sur-Yvette, France
5
Max Planck Institute for Astronomy, Königstuhl 17, 69117 Heidelberg, Germany
6
Department of Physics, University of Oxford, Keble Road, Oxford OX1 3RH, UK
7
Astronomy Centre, Department of Physics and Astronomy, University of Sussex, Brighton BN1 9QH, UK
8
Department of Astronomy, Cornell University, Space Sciences Building, Ithaca, NY 14853, USA
9
Leiden Observatory, Leiden University, PO Box 9513, 2300 RA Leiden, The Netherlands
10
Aix Marseille Univ., Centre National de la Recherche Scientifique, Laboratoire d’Astrophysique de Marseille, Marseille, France
11
Department of Physics and Astronomy, University College London, Gower Street, London WC1E 6BT, UK
Received:
28
November
2019
Accepted:
4
February
2020
Abstract
We present new observations, carried out with IRAM NOEMA, of the atomic neutral carbon transitions [C I](3P1–3P0) at 492 GHz and [C I](3P2–3P1) at 809 GHz of GN20, a well-studied star-bursting galaxy at z = 4.05. The high luminosity line ratio [C I](3P2–3P1) /[C I](3P1–3P0) implies an excitation temperature of 48+14−9 K, which is significantly higher than the apparent dust temperature of Td = 33 ± 2 K (β = 1.9) derived under the common assumption of an optically thin far-infrared dust emission, but fully consistent with Td = 52 ± 5 K of a general opacity model where the optical depth (τ) reaches unity at a wavelength of λ0 = 170 ± 23 μm. Moreover, the general opacity solution returns a factor of ∼2× lower dust mass and, hence, a lower molecular gas mass for a fixed gas-to-dust ratio, than with the optically thin dust model. The derived properties of GN20 thus provide an appealing solution to the puzzling discovery of starbursts appearing colder than main-sequence galaxies above z > 2.5, in addition to a lower dust-to-stellar mass ratio that approaches the physical value predicted for starburst galaxies.
Key words: galaxies: evolution / galaxies: high-redshift / galaxies: ISM / galaxies: starburst
© ESO 2020
1. Introduction
Over the last decade, it has been established that the majority of star-forming galaxies (SFGs) fall into a tight correlation between the star formation rate (SFR) and the stellar mass (M*), forming a “main-sequence” (MS) with a normalization that increases with redshift (e.g., Brinchmann et al. 2004; Daddi et al. 2007; Noeske et al. 2007; Elbaz et al. 2007; Magdis et al. 2010). Outliers of this relation are defined as starburst galaxies (SBs), existing at all redshifts. While the star formation in MS galaxies is governed by secular processes, merger-induced events or galaxy interactions are thought to trigger it in SBs (e.g., Cibinel et al. 2019).
In the interstellar medium (ISM), the thermal emission from dust grains heated by UV photons originating from newly formed stars dominates the spectral energy distribution (SED) of galaxies (at ∼8−1000 μm, Sanders & Mirabel 1996). Modeling of the rest-frame far-infrared (FIR) and the Rayleigh-Jeans (RJ) tail of the SED can be used to derive properties including the dust mass (Md), the infrared luminosity (LIR), the intensity of the radiation field (⟨U⟩ ∝ LIR/Md: Draine & Li 2007), and the mass-weighted dust temperature (Td) where ⟨U⟩ = (Td/18.9)6.04 (Magdis et al. 2012a, 2017).
With the ever-increasing number of galaxy populations with well-studied infrared properties, several puzzling findings have started to emerge, especially for high-redshift SBs. First, their dust-to-stellar mass ratios (Md/M*) are found to be extremely large (reaching 0.1: Tan et al. 2014), with a stellar mass budget that is unable to account for the inferred dust production (Béthermin et al. 2015). Second, while the intensity of the radiation field in MS galaxies rises with increasing redshift up to z ∼ 4 (Magdis et al. 2017; Jin et al. 2019), mirroring the increase in the specific SFR (sSFR = SFR/M*) in the same time interval (Béthermin et al. 2015, for Td: Schreiber et al. 2018), the evolution is less clear for SBs. While Schreiber et al. (2018) report a trend of increasing Td with both redshift and offset from the MS, the latter, independently of redshift, Béthermin et al. (2015) observe no evolution of the mean radiation field (hence, dust temperature) with redshift for strong SBs with sSFR > 10 × sSFRMS, which become apparently colder than MS galaxies at z > 2.5, which is at odds with the expectations. A possible solution to the latter could be offered by a more general treatment of the modeling of the FIR emission that in the vast majority of the literature. Also, due to the limited sampling of the SEDs in the FIR to RJ regime, such modeling is performed under the assumption of optically thin FIR emission for both MS and SB galaxies. Indeed, observational studies of local ultra-luminous infrared galaxies (ULIRGs) and high-redshift massive SBs indicate that the dust could remain optically thick out to rest-frame λ0 = 100−200 μm (e.g., Blain et al. 2003; Huang et al. 2014; Lutz et al. 2016; Spilker et al. 2016; Riechers et al. 2013; Hodge et al. 2016; Simpson et al. 2017) and, in the most extreme case, out to millimeter wavelengths as reported for the star-bursting nucleus of Arp 220 (Scoville et al. 2017a). If the FIR dust emission is optically thick, the suppressed continuum emission in the Wien’s part of the IR emission shifts the peak of the SED to longer wavelengths, mimicking apparently cold Td, while, in fact, the actual luminosity-weighted Td of the sources would be considerably warmer. The main difficulty is that the optically thin or thick solutions are heavily degenerate; the same SED could arise from either cold and optically thin or a warm and optically thick FIR dust emission with no robust way to discriminate between the two by simply using continuum observations. An independent proxy for Td is, thus, required to break this degeneracy.
In this work, we present new Northern Extended Millimeter Array (NOEMA) observations of GN20, a well-known massive (stellar mass of M* ∼ 1011M⊙: Tan et al. 2014) starburst galaxy at z = 4.0553 (Pope et al. 2006; Daddi et al. 2009), targeting both atomic neutral carbon lines, [C I](3P1–3P0) and [C I](3P2–3P1). The simple three-level structure of the atom allows us to use the [C I] line luminosity ratio to derive the excitation temperature (Tex), which was recently reported to correlate with Td derived assuming optically thin FIR dust emission on sub-galactic scales for nearby (U)LIRGs (Jiao et al. 2019a,b), suggesting that the gas probed by [C I] and the dust are correlated on kpc scales. The [C I] line ratio might thus be used as an independent empirical indicator of the dust temperature, potentially breaking the degeneracy between an optically thick and thin case for the FIR dust emission.
Throughout the Letter, we adopt H0 = 70 km s−1 Mpc−1, ΩM = 0.30, ΩΛ = 0.70, and a Chabrier (2003) initial mass function (IMF).
2. Observations and data reduction
We used IRAM NOEMA to observe the [C I](3P1–3P0), [C I](3P2–3P1), and CO(7–6) line transitions in the GN20 protocluster (Daddi et al. 2009). The observations took place in March 2017 using the D configuration for a total on-source time of 7.6 h (program W16DZ, PI: G. Magdis). The [C I](3P1–3P0) line (rest frequency: νrest = 492.161 GHz) is redshifted to ν = 97.355 GHz at z = 4.0553 with a primary beam of 51.8″. We set our pointing center to the coordinates of GN20 (RA: 12h37m11 89, Dec: +62d22m12
 1) to detect the [C I] and CO lines in this galaxy. Although the D-configuration leads to a relatively low spatial resolution (∼3−6″), it is the most suitable configuration for a detection experiment as ours. As the observations of the two other GN20 protocluster members, GN20.2a and GN20.2b, are affected by a primary beam attenuation of about 0.2−0.7, no lines were detected and we could not derive any constraining measurements for these galaxies.
The data were reduced using the GILDAS software packages CLIC and MAPPING. The pipeline-derived flux for our flux calibrator LKHA101 is 0.24 Jy at 97.4 GHz, and 0851+202 7.24 Jy at 160.1 GHz, with about 20% absolute calibration uncertainty. We produced uv tables with channel widths of 26 km s−1, achieving an rms of 0.77 and 1.35 mJy beam−1 at 3 mm and 1.86 mm, respectively. We then estimated the continuum emission by averaging the line-free channels. Finally, we subtracted the continuum to produce the line uv tables. The spectra were then extracted using the GILDAS UV_FIT task by assuming an intrinsic source size of 0.72″ (circular Gaussian FWHM), the size of the CO(4–3) line derived from the higher-resolution and signal-to-noise (S/N) data from Tan et al. (2014). The beam sizes at 3 mm and 1.86 mm are 6.72″ × 3.42″ and 2.51″ × 1.72″, respectively. The CO and [C I] line intensity maps were produced by collapsing the uv space cube according to the line widths followed by an imaging process (dirty image). We extracted all information directly in the uv plane to avoid introducing any artifacts during the imaging process. We note that assuming an unresolved point-like source in the fitting leads to ∼20% lower line fluxes and 50% worse residuals1.
We searched for emission lines by scanning the S/N spectra as detailed in Daddi et al. (2015). The estimated continuum at 1.86 mm of GN20 is 2.80 ± 0.13 mJy and 0.36 ± 0.04 mJy at 3.05 mm. The 1.86 mm continuum flux is larger than the existing measurements reported in Casey et al. (2009) (S1.86 mm = 1.9 ± 0.2 mJy), for which the actual noise may have been underestimated. On the other hand, the 3.05 mm continuum flux (central frequency 98.16 GHz) is fully consistent with the flux reported in Tan et al. (2014) (S3.3 mm = 0.23 ± 0.04 mJy, central frequency 91.34 GHz) when taking into account the difference in frequency and assuming the dust continuum decreases as ∼λ−3.8.
Figure 1 (left) shows the [C I](3P1–3P0) spectrum with an indication of a double-peaked structure which is more prominent in the [C I](3P2–3P1) and CO(7–6) lines (Fig. 1, right). We fixed the line width as derived from the brighter [C I](3P2–3P1) line (see Table 1) to estimate the [C I](3P1–3P0) line flux. This is done for the purpose of including the fainter component of the [C I](3P1–3P0) line feature which, due to the low S/N, would otherwise be overlooked. We detected the line with a 6.40σ significance, retrieving a total velocity-integrated flux of 0.70 ± 0.11 Jy km s−1.
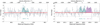 |
Fig. 1. Extracted spectra of the [C I](3P1–3P0) line (left) and the [C I](3P2–3P1) and CO(7–6) lines (right). Both spectra are binned in steps of 26 km s−1. The colored areas indicate that the velocity ranges corresponding to detected line emission as labeled, which were used to obtain the velocity-integrated fluxes. Blue and purple solid lines show the best-fit double Gaussians, whereas the red line in each panel shows the continuum level. The velocity offset in both panels is relative to the expected frequency of the [C I] lines at z = 4.0553. |
Derived properties of GN20.
Existing [C I](3P2–3P1) and CO(7–6) line observations of this target were previously reported as upper limits with line intensities of < 1.2 Jy km s−1 (Casey et al. 2009). However, our observations reveal 8.5σ and 11.0σ detections for the [C I](3P2–3P1) and CO(7–6) emission, respectively. This could indicate that the previous [C I](3P2–3P1) and CO(7–6) upper limits may have been underestimated, similarly to the continuum measurement at 1.86 mm. Figure 1 (right) shows the spectrum of [C I](3P2–3P1) and CO(7–6), where the velocity offset is relative to the expected frequency at z = 4.0553. Both lines are detected and reveal a double-peaked structure. The total velocity-integrated flux density of the [C I](3P2–3P1) line is 1.80 ± 0.22 Jy km s−1 with a line width of 949 km s−1. The observed lines indicate a redshift of 4.0536 ± 0.0080, which is consistent with previous redshift determinations from CO line measurements (Daddi et al. 2009; Carilli et al. 2010, 2011; Hodge et al. 2012; Tan et al. 2014). The CO(7–6) flux measurements, along with a detailed study of the CO spectral line energy distribution (SLED), will be presented in a dedicated, forthcoming paper.
The total integrated flux density of each line was estimated by taking the product of the averaged flux density in the channels, maximizing the S/N and the velocity width of these channels (see Daddi et al. 2015; Whitaker et al. 2014). We checked these non-parametric estimates against Gaussian modeling, retrieving fully consistent results. We proceeded with the scanning method based on the first approach to derive the line luminosities throughout the Letter. The line fluxes were converted to luminosities (listed in Table 1) following the conversions in Solomon & Vanden Bout (2005).
3. Analysis
3.1. The excitation temperature of neutral atomic carbon
Our new NOEMA observations allow us to derive the excitation temperature (Tex), under the assumption of local thermodynamical equilibrium (LTE) and given that both carbon lines are optically thin. To test the validity of the latter assumption, we derived the optical depth of each [C I] line following Schneider et al. (2003) (Eqs. (A.6) and (A.7)) by using the intrinsic brightness temperature of the [C I] lines. We used the optically thick FIR dust results (τ = 1, λ0 = 170 μm, and log(Md/M⊙)=9.31) to derive the source solid angle assuming κ850 = 0.43 cm2 g−1 at λ = 850 μm yielding Ωsource = 2.36 × 10⁻¹² sr or an effective radius of Re = 1.2 kpc, consistent with the reported size of the rest-frame 170 μm observations (Hodge et al. 2015). For the [C I](3P1–3P0) and [C I](3P2–3P1) lines, we measured brightness temperatures of Tb = 1.07 and 1.02 K, respectively. As the equations include the excitation temperature, we assumed for the first iteration that Tex is equal to Td = 33−52 K, the derived dust temperature assuming optically thin and thick dust MBB prescriptions, respectively (see Sect. 3.2). This yields optical depths of τ[CI] = 0.03−0.05 for both [C I] lines, comparable with other high-redshift galaxies (Walter et al. 2011; Alaghband-Zadeh et al. 2013; Nesvadba et al. 2019). The excitation temperature can be derived via the formula under the assumption that [C I] is thermalized, meaning that it shares the same Tex for both levels of [C I] (Stutzki et al. 1997):
 (1)
(1)
where ![Mathematical equation: $ R = L_{[{\rm{CI}}]{(^{\rm{3}}}{{\rm{P}}_{\rm{2}}}{{\rm{ - }}^{\rm{3}}}{{\rm{P}}_{\rm{1}}})}^\prime $](/articles/aa/full_html/2020/02/aa37217-19/aa37217-19-eq7.gif) /
/![Mathematical equation: $ L_{[{\rm{CI}}]{(^{\rm{3}}}{{\rm{P}}_{\rm{1}}}{{\rm{ - }}^{\rm{3}}}{{\rm{P}}_{\rm{0}}})}^\prime $](/articles/aa/full_html/2020/02/aa37217-19/aa37217-19-eq8.gif) . We find R = 0.9 ± 0.2 and Tex = 48.2 ± 11.6 K. We bootstrapped the [C I](3P1–3P0) and [C I](3P2–3P1) luminosities, assuming normally distributed values with the observed error as the standard deviation. This Monte Carlo (MC) test yields a median of
. We find R = 0.9 ± 0.2 and Tex = 48.2 ± 11.6 K. We bootstrapped the [C I](3P1–3P0) and [C I](3P2–3P1) luminosities, assuming normally distributed values with the observed error as the standard deviation. This Monte Carlo (MC) test yields a median of  K (the upper and lower values are the 16th and 84th percentiles). Lastly, re-deriving the optical depths using the final excitation temperature yields τ[CI] = 0.03 for both lines, confirming that both [C I] lines are optically thin2.
3.2. Modeling of the FIR and millimeter emission
To further constrain the FIR and millimeter properties of GN20, we complement the literature observations with our new continuum flux measurements at 1.86 and 3.05 mm. Existing photometry and millimeter measurements have already been presented in detail (see Magdis et al. 2012a; Tan et al. 2014) including photometry observations from Herschel (PACS: 100, 160 μm; SPIRE: 250, 350, 500 μm) and the AzTEC 1.1 mm map (Perera et al. 2008). We also include continuum measurements at 2.2, 3.3, and 6.6 mm (Carilli et al. 2011), and 870 μm observations (Hodge et al. 2015).
We adopted three different methods to infer the FIR properties of GN20. First, we used the silicate-graphite-PAH models from Draine & Li (2007, hereafter DL07), including diffuse ISM and photodissociation region (PDR) components to estimate the LIR (at 8−1000 μm), the Md, and the ⟨U⟩ by fitting the available mid-IR to millimeter photometry (Fig. 2, left). Since the DL07 dust models inherently assume that the dust emission is optically thin and do not determine a luminosity-weighted Td that is commonly used in the literature, we also considered optically thin and general opacity single-temperature modified blackbody (MBB) prescriptions (Berta et al. 2016).
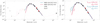 |
Fig. 2. Mid-IR to millimeter SED of GN20 in observed wavelength. Left: complement our new continuum measurements at 1.86 and 3.05 mm (red points) with existing photometry observations at observed and λ > 160 μm and λ ≤ 160 μm (black and grey points, respectively), where the latter is omitted from the MBB modeling. Blue and red lines show the best-fit single-temperature MBB prescription assuming an optically thick (λ0 = 170 ± 23 μm) and thin dust emission, respectively. We also present the best-fit MBB model when accounting for the effect of the CMB (grey curve). The solid pink line shows the best-fit using the DL07 dust models, containing a diffuse ISM component and dust in PDR regions. The best-fit MBB parameters are listed in Table 1. Right: zoom-in of the rest-frame FIR part of the SED of GN20 when including the optically thick and thin MBB prescriptions. We note that the optically thick MBB model is a better macth to the photometry observations at λ ≤ 160 μm. |
For the general opacity MBB model, we fit the observed FIR and millimeter photometry at λrest > 50 μm of GN20 (to avoid contamination from warm dust):
 (2)
(2)
where B(ν, T) is the Planck function,  is the frequency-dependent optical depth of the dust, ν0 is the frequency at which the optical depth reaches unity, and β is the dust emissivity. To estimate Md, we assume a dust opacity at 850 μm of κ850 = 0.43 cm2 g−1 (Li & Draine 2001). In the optically thin case (ν0 ≪ ν), the MBB prescription is reduced to:
 (3)
(3)
The SED of GN20 and the best-fit prescriptions are presented in Fig. 2 and the results are listed in Table 1. For the optically thin case, the SED fitting yields Td = 33 ± 2 K and β = 1.9 ± 0.1, which is consistent with the result reported in Magdis et al. (2011a) but considerably smaller than the Tex derived from the [C I] luminosity ratio (Sect. 3.1). Accounting for the effect of the cosmic microwave background (CMB) on the (sub-)millimeter dust continuum emission, as detailed in da Cunha et al. (2013), results in consistent best-fit parameters within the uncertainties (Fig. 2, left). On the other hand, when fitting the FIR SED using a general opacity dust model (Eq. (2)), the optical depth reaches unity at a wavelength of λ0 = c/ν0 = 170 ± 23 μm with a dust temperature of Td = 52 ± 5 K, which is fully consistent with Tex, while recovering the same β value as for the optically thin case.
4. Results and discussion
Recent works have reported a correlation between the Tex derived from [C I] line ratio and the apparent luminosity-weighted Td derived assuming optically thin MBB prescription with β = 2 from resolved observations of nearby star-forming galaxies and (U)LIRGs (Jiao et al. 2019a,b). For galaxies at high-redshift, when Td is derived using the same MBB prescription, the existence of a Tex − Td correlation is less clear. Although this is possibly due to the small sample size and lower S/N temperature estimates, which both cause significant scatter, the high-redshift galaxies give, on average, Td ≥ Tex, which is consistent with the local systems (Jiao et al. 2019a,b; Valentino et al. 2020).
Following the same prescriptions to derive Tex and Td as proposed in these studies leads to the observation of several curious properties for GN20. The large [C I] line ratio yields  K, which is significantly warmer than the apparent dust temperature of Td = 33 ± 2 K, opposing to the general trend in the empirical Tex − Td relation when assuming optically thin FIR dust emission. In fact, the [C I] MC test predicts a 97.5% probability of obtaining a Tex above 33 K. In Fig. 3, we show the cosmic evolution of the luminosity-weighted dust temperature when including MS, SBs, and dusty SFGs at z = 0−6 (Béthermin et al. 2015; Schreiber et al. 2018; Jin et al. 2019). The included Td values from the literature are all consistent with those derived using an optically thin MBB prescription. We convert the mass- to luminosity-weighted Td measurements using Eq. (6) in Schreiber et al. (2018). The apparent luminosity-weighted dust temperature of GN20 is similar to the average of main-sequence galaxies at z ∼ 1.4 (Schreiber et al. 2018), despite GN20 being a strong starburst galaxy (SFR = 1860 ± 90 M⊙ yr−1) and exhibiting a factor of ∼6× larger sSFR (sSFR = 16.9 Gyr−1) than z = 4 MS galaxies (Tan et al. 2014; Sargent et al. 2014; Jin et al. 2019).
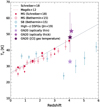 |
Fig. 3. Evolution of Td as a function of redshift. We include stacked MS galaxies from Schreiber et al. (2018) (the small red circles present the stacked galaxies in the largest mass bin with 11.0 < log(M⋆/M⊙)< 11.5 whereas large red filled circles are the weighted mean of all galaxies), stacked MS and SB galaxies from Béthermin et al. (2015) (open red and blue symbols, respectively). For the latter, we convert ⟨U⟩ to Td following Schreiber et al. (2018). We also include four dusty SFGs from Jin et al. (2019) (open blue triangles). Purple symbols depict the derived Tex of GN20 from the [C I] luminosity ratio and from the MBB modeling assuming optically thin or thick FIR dust emission. |
Likewise, the optically thin DL07 models (assuming multi-component dust distribution) provide similar results, yielding  for GN20 (Magdis et al. 2011b, 2012b; Tan et al. 2014), placing it at a factor of ∼2.5 times below the ⟨U⟩−z relation for MS galaxies (Béthermin et al. 2015; Magdis et al. 2017). As a sanity check, we also converted ⟨U⟩ to Td following ⟨U⟩ = (Td/18.9 K)6.04 (Magdis et al. 2017; Schreiber et al. 2018; Jin et al. 2019) and used the aforementioned conversion to obtain the luminosity-weighted dust temperature (Schreiber et al. 2018). The inferred Td, DL07 = 33 ± 1 K for GN20 is fully consistent with the dust temperature derived from the optically thin MBB prescription. Lastly, the dust masses derived from the optically thin MBB and the DL07 prescriptions both lead to unphysically large Md/M* = 0.04 ± 0.02 and Md/M* = 0.05 ± 0.02, respectively, which is a factor of ∼5× higher than the predicted ratios for SBs based on semi-analytical models (Lagos et al. 2012; Béthermin et al. 2015). Although the spatial offset between the optical/UV and the CO+FIR emission could indicate that the stellar mass is underestimated due to dust extinction, the reported dynamical mass analysis of GN20 (Hodge et al. 2012) suggests that only a modest (if any) increase of the stellar mass can be allowed while still being consistent with the dynamical constraints.
Accounting for the effects of the optical depth in the SED modeling (Sect. 3.2) alleviates or even removes all these tensions at once. A free opacity MBB prescription for GN20 indicates that the FIR dust emission is optically thick up to λ0 = 170 ± 23 μm with an actual luminosity-weighted Td = 52 ± 5 K that is similar to the Tex from [C I] (Fig. 3), which is consistent with the expected dust temperature of a starburst galaxy at z = 4.05 with an offset from the MS similar to GN20 (Eq. (18) in Schreiber et al. 2018). The optically thick FIR dust temperature is also in agreement with the observed Tex − Td relation (Jiao et al. 2019b) of Tex ≤ Tkin (Valentino et al. 2020). For a comparison with other high-z starbursts, Spilker et al. (2016) report a λ0 − Td correlation based on lensed starburst galaxies at z = 1.9−5.7 with ⟨λ0⟩ = 140 ± 40 μm, derived using free opacity MBB prescription, yielding consistent results with our derived FIR properties of GN20. Moreover, for a subsample of these galaxies, Bothwell et al. (2017) report larger Td than that of the kinetic temperature (Tkin) of the molecular gas based on [C I] and CO molecular lines. Under the assumption of LTE, Tkin = Tex, which results in Td > Tex, which is in agreement with previous findings.
As a simple check, we calculated the optical depth of the FIR dust emission similar to the approach described in Jin et al. (2019), using: τ = κ × Σdust where κ is the dust mass absorption coefficient from Li & Draine (2001) and Σdust is the dust mass surface density. We derive Σdust ∼ 500 M⊙ pc−2 assuming Re ∼ 1.2 kpc (Sect. 3.1) where τ ∼ 1 at ∼170 μm, suggesting that the dust emission is optically thick up to FIR wavelengths3. If, indeed, the dust emission in SBs is affected by opacity effects with λ0 > 100 μm, as it appears for local and high-redshift SB galaxies (e.g., Blain et al. 2003; Conley et al. 2011; Cox et al. 2011; Riechers et al. 2013; Simpson et al. 2017), the inferred Td would systematically increase. This would place the SB systems above the Td − z relation of MS galaxies at all redshifts, solving the puzzling observation of strong SBs being colder (or having lower ⟨U⟩) than MS galaxies beyond z > 2.5 (Béthermin et al. 2015), as inferred by the optically thin dust models.
An optically thick FIR dust emission will also naturally lead to lower dust masses. For GN20, the free opacity SED modeling results in a Md/M* ratio of 0.02 ± 0.01, approaching the predicted ratios of Md/M* < 0.01 for SBs at z ∼ 4 (Lagos et al. 2012). The effect of the Td in the determination of the Md (and thus of the Mgas for a fixed δGDR) as a function of the rest-frame wavelength used to anchor the Md estimate is shown in Fig. 4. In the RJ tail (λrest ≥ 500 μm), a factor of 2× difference in Td results in a factor of ∼2× difference in Md, reflecting the well-known dependence of Md ∝  in the optically thin limit. However, at shorter rest-frame wavelengths, the discrepancy between the Md estimates becomes considerably larger, reaching a factor of ∼5× at λrest ∼ 200 μm.
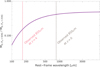 |
Fig. 4. Comparison of the derived Md ratio based on the MBB prescription assuming different dust temperatures (50 K compared to 25 K) as a function of rest-frame wavelength. The dust continuum emission at an observed 850 μm is commonly used to infer Md. |
This is a matter of caution with regard to the common approach for inferring the ISM mass (proportional to the Md and hence the Mgas) of high-z galaxies from single-band ALMA continuum observations at observed wavelengths 850−1200 μm (e.g., Scoville et al. 2017b; Liu et al. 2019), under the assumption of a fixed δGDR and mass-weighted Td of ∼25 K. At z > 3, such observations probe λrest < 300 μm, where moderate deviations from Td = 25 K result in significant changes in Md (and thus in Mgas). Moreover, they trace a regime where the FIR dust emission could be optically thick. In particular, for high-z SBs similar to GN20, an observed 850 μm measurement probes λrest ∼ 160 μm, where the dust is likely affected by opacity effects. For reference, a Td = 25 K versus 50 K overestimates Md (and thus Mgas) by a factor of ∼7×. We stress that the Td = 50 K measured here is luminosity-weighted and is, thus, likely to be higher than the mass-weighted Td.
Using the Tex − Td correlation to identify possible critical effects of the optical depth on the dust emission in extreme starbursts is potentially useful for settling a few issues concerning GN20. However, this relies on several assumptions and caveats that should be borne in mind; and alternative scenarios explaining Tex > Td in the optically thin case might be considered. If the [C I] line emission is subthermally excited, the excitation temperatures of the two [C I] line transitions might not be equal as assumed under LTE. In this case, using Eq. (1) would lead to a systematically overestimated Tex (Glover et al. 2015, but see Israel et al. 2015 about the phases traced by [C I] in extreme conditions of local starbursts).
Cosmic rays and turbulence could, in principle, lead to different gas and dust temperatures (Papadopoulos et al. 2004; Bisbas et al. 2017), assuming that the cosmic ray energy density scales with the SFR density (Glover et al. 2015). An enhancement of cosmic rays is expected, thus, in starbursty environments, increasing the average temperature of the molecular gas, while at the same time, leaving the dust unaffected. An increased rate of cosmic rays in SBs would also lead to enhanced [C I] emission throughout the cloud via CO destruction. However, in this case, models predict larger [C I] to CO luminosity ratios in SBs than MS galaxies, which is in disagreement with current observations which report that the [C I]/CO luminosity ratio remains roughly constant as a function of LIR and sSFR, at least on global scales (Valentino et al. 2018). This might be due to the fact that the global SFR is not a good predictor of the gas conditions in clouds (Narayanan & Krumholz 2014). Alternatively, turbulence can distribute [C I] throughout the cloud, smoothing the [C I]/CO luminosity ratio (Papadopoulos et al. 2004; Bisbas et al. 2017). As turbulence is expected to be dominant in regions with high cosmic ray ionization rates (i.e., in starburst or merger systems), it is plausible that both mechanisms are responsible for heating the molecular gas.
We stress that a scenario with Tex > Td does not change the fact that the apparent dust temperature and the mean radiation field in a typical starburst galaxy at z = 4 is significantly lower than that of MS galaxies at similar redshifts and that it provides an apparent Td that is in disagreement with the empirical Tex − Td relation. As our study is based on a single galaxy, the method of using the [C I] line ratio to distinguish between an optically thick or thin FIR dust solution has to be tested for the general population of high-redshift starbursts. However, accounting for optical depth effects at FIR wavelengths in starbursts similar to GN20 can mitigate several observed tensions by providing larger dust temperatures, in addition to lower dust masses, easing the improbable large dust to stellar mass ratios.
This is estimated by examining the total flux within one beam size aperture at the position of GN20 in the dirty image of the line-channel-collapsed residual data. The residual uv data are produced by the GILDAS UV_FIT task.
Adopting a larger size similar to that measured of the CO(2–1) emission (Re ∼ 4 kpc: Carilli et al. 2010; Hodge et al. 2015) yields a Tb and τ[CI] that is ∼9.5% of values derived for the Re = 1.2 kpc case.
Large dust optical depths at FIR and submillimeter wavelengths can suppress the [C I] lines yielding fainter line emission as reported for CO line transitions of local ULIRGs (Papadopoulos et al. 2010, 2012). To account for this effect, we calculate the intrinsic [C I] line luminosity ratio assuming an isothermal mixture of line-emitting gas and dust. We compute the dust optical depth at the observed frequencies of the [C I] line transitions based on the best-fit model with the opacity free to vary (Sect. 3.2) yielding τd,[CI](1−0) = 0.1 and τd,[CI](2−1) = 0.2. Adopting Eq. (4) in Papadopoulos et al. (2010), the [C I] luminosity line ratio and excitation temperature would increase to R = 1.0 ± 0.2 and Tex = 54.1 ± 13.4 K, respectively. This does not affect the substance of our results.
Acknowledgments
We thank the anonymous referee for helpful and constructive comments which improved this Letter. We also thank Padelis Papadopoulos for useful suggestions on the effect of dust opacity on emission lines. This work is based on observations carried out under project number W16DZ with the IRAM NOEMA Interferometer. IRAM is supported by INSU/CNRS (France), MPG (Germany) and IGN (Spain). IC acknowledges support from Villum Fonden research grant (13160). FV and GEM acknowledge the Villum Fonden research grant 13160 “Gas to stars, stars to dust: tracing star formation across cosmic time”, and the Carlsberg Fonden research grant CF18-0388 “Galaxies: Rise And Death”. DL acknowledges support and funding from the European Research Council (ERC) under the European Union’s Horizon 2020 research and innovation programme (grant agreement No. 694343). GEM and ST acknowledge support from the ERC Consolidator Grant funding scheme (project ConTExt, grant number No. 648179). The Cosmic Dawn Center is funded by the Danish National Research Foundation under grant No. 140.
References
- Alaghband-Zadeh, S., Chapman, S. C., Swinbank, A. M., et al. 2013, MNRAS, 435, 1493 [Google Scholar]
- Berta, S., Lutz, D., Genzel, R., Förster-Schreiber, N. M., & Tacconi, L. J. 2016, A&A, 587, A73 [NASA ADS] [CrossRef] [EDP Sciences] [Google Scholar]
- Béthermin, M., Daddi, E., Magdis, G., et al. 2015, A&A, 573, A113 [NASA ADS] [CrossRef] [EDP Sciences] [Google Scholar]
- Bisbas, T. G., van Dishoeck, E. F., Papadopoulos, P. P., et al. 2017, ApJ, 839, 90 [NASA ADS] [CrossRef] [Google Scholar]
- Blain, A. W., Barnard, V. E., & Chapman, S. C. 2003, MNRAS, 338, 733 [NASA ADS] [CrossRef] [Google Scholar]
- Bothwell, M. S., Aguirre, J. E., Aravena, M., et al. 2017, MNRAS, 466, 2825 [Google Scholar]
- Brinchmann, J., Charlot, S., White, S. D. M., et al. 2004, MNRAS, 351, 1151 [NASA ADS] [CrossRef] [Google Scholar]
- Carilli, C. L., Daddi, E., Riechers, D., et al. 2010, ApJ, 714, 1407 [NASA ADS] [CrossRef] [Google Scholar]
- Carilli, C. L., Hodge, J., Walter, F., et al. 2011, ApJ, 739, L33 [NASA ADS] [CrossRef] [Google Scholar]
- Casey, C. M., Chapman, S. C., Daddi, E., et al. 2009, MNRAS, 400, 670 [NASA ADS] [CrossRef] [Google Scholar]
- Chabrier, G. 2003, PASP, 115, 763 [NASA ADS] [CrossRef] [Google Scholar]
- Cibinel, A., Daddi, E., Sargent, M. T., et al. 2019, MNRAS, 485, 5631 [NASA ADS] [CrossRef] [Google Scholar]
- Conley, A., Cooray, A., Vieira, J. D., et al. 2011, ApJ, 732, L35 [NASA ADS] [CrossRef] [Google Scholar]
- Cox, P., Krips, M., Neri, R., et al. 2011, ApJ, 740, 63 [NASA ADS] [CrossRef] [Google Scholar]
- da Cunha, E., Groves, B., Walter, F., et al. 2013, ApJ, 766, 13 [Google Scholar]
- Daddi, E., Dickinson, M., Morrison, G., et al. 2007, ApJ, 670, 156 [NASA ADS] [CrossRef] [Google Scholar]
- Daddi, E., Dannerbauer, H., Stern, D., et al. 2009, ApJ, 694, 1517 [Google Scholar]
- Daddi, E., Dannerbauer, H., Liu, D., et al. 2015, A&A, 577, A46 [NASA ADS] [CrossRef] [EDP Sciences] [Google Scholar]
- Draine, B. T., & Li, A. 2007, ApJ, 657, 810 [NASA ADS] [CrossRef] [Google Scholar]
- Elbaz, D., Daddi, E., Le Borgne, D., et al. 2007, A&A, 468, 33 [NASA ADS] [CrossRef] [EDP Sciences] [Google Scholar]
- Glover, S. C. O., Clark, P. C., Micic, M., & Molina, F. 2015, MNRAS, 448, 1607 [NASA ADS] [CrossRef] [Google Scholar]
- Hodge, J. A., Carilli, C. L., Walter, F., et al. 2012, ApJ, 760, 11 [Google Scholar]
- Hodge, J. A., Riechers, D., Decarli, R., et al. 2015, ApJ, 798, L18 [NASA ADS] [CrossRef] [Google Scholar]
- Hodge, J. A., Swinbank, A. M., Simpson, J. M., et al. 2016, ApJ, 833, 103 [Google Scholar]
- Huang, J. S., Rigopoulou, D., Magdis, G., et al. 2014, ApJ, 784, 52 [NASA ADS] [CrossRef] [Google Scholar]
- Israel, F. P., Rosenberg, M. J. F., & van der Werf, P. 2015, A&A, 578, A95 [NASA ADS] [CrossRef] [EDP Sciences] [Google Scholar]
- Jiao, Q., Zhao, Y., Lu, N., et al. 2019a, ApJ, 880, 133 [NASA ADS] [CrossRef] [Google Scholar]
- Jiao, Q., Zhao, Y., Lu, N., et al. 2019b, ApJ, 883, 207 [NASA ADS] [CrossRef] [Google Scholar]
- Jin, S., Daddi, E., Magdis, G. E., et al. 2019, ApJ, 887, 144 [NASA ADS] [CrossRef] [Google Scholar]
- Lagos, C. D. P., Bayet, E., Baugh, C. M., et al. 2012, MNRAS, 426, 2142 [NASA ADS] [CrossRef] [Google Scholar]
- Li, A., & Draine, B. T. 2001, ApJ, 554, 778 [Google Scholar]
- Liu, D., Schinnerer, E., Groves, B., et al. 2019, ApJ, 887, 235 [NASA ADS] [CrossRef] [Google Scholar]
- Lutz, D., Berta, S., Contursi, A., et al. 2016, A&A, 591, A136 [NASA ADS] [CrossRef] [EDP Sciences] [Google Scholar]
- Magdis, G. E., Rigopoulou, D., Huang, J. S., & Fazio, G. G. 2010, MNRAS, 401, 1521 [NASA ADS] [CrossRef] [Google Scholar]
- Magdis, G. E., Daddi, E., Elbaz, D., et al. 2011a, ApJ, 740, L15 [NASA ADS] [CrossRef] [Google Scholar]
- Magdis, G., Elbaz, D., Dickinson, M., et al. 2011b, A&A, 534, A15 [NASA ADS] [CrossRef] [EDP Sciences] [Google Scholar]
- Magdis, G. E., Daddi, E., Béthermin, M., et al. 2012a, ApJ, 760, 6 [NASA ADS] [CrossRef] [Google Scholar]
- Magdis, G. E., Daddi, E., Sargent, M., et al. 2012b, ApJ, 758, L9 [NASA ADS] [CrossRef] [Google Scholar]
- Magdis, G. E., Rigopoulou, D., Daddi, E., et al. 2017, A&A, 603, A93 [NASA ADS] [CrossRef] [EDP Sciences] [Google Scholar]
- Narayanan, D., & Krumholz, M. R. 2014, MNRAS, 442, 1411 [NASA ADS] [CrossRef] [Google Scholar]
- Nesvadba, N., Canameras, R., Kneissl, R., et al. 2019, A&A, 624, A23 [NASA ADS] [CrossRef] [EDP Sciences] [Google Scholar]
- Noeske, K. G., Faber, S. M., Weiner, B. J., et al. 2007, ApJ, 660, L47 [NASA ADS] [CrossRef] [Google Scholar]
- Papadopoulos, P. P., Isaak, K., & van der Werf, P. 2010, ApJ, 711, 757 [NASA ADS] [CrossRef] [Google Scholar]
- Papadopoulos, P. P., Thi, W. F., & Viti, S. 2004, MNRAS, 351, 147 [NASA ADS] [CrossRef] [Google Scholar]
- Papadopoulos, P. P., van der Werf, P. P., Xilouris, E. M., et al. 2012, MNRAS, 426, 2601 [NASA ADS] [CrossRef] [Google Scholar]
- Perera, T. A., Chapin, E. L., Austermann, J. E., et al. 2008, MNRAS, 391, 1227 [NASA ADS] [CrossRef] [Google Scholar]
- Pope, A., Scott, D., Dickinson, M., et al. 2006, MNRAS, 370, 1185 [NASA ADS] [CrossRef] [Google Scholar]
- Riechers, D. A., Bradford, C. M., Clements, D. L., et al. 2013, Nature, 496, 329 [Google Scholar]
- Sanders, D. B., & Mirabel, I. F. 1996, Annu. Rev. Astron. Astrophys., 34, 749 [Google Scholar]
- Sargent, M., Daddi, E., Béthermin, M., et al. 2014, ApJ, 793, 19 [NASA ADS] [CrossRef] [Google Scholar]
- Schneider, N., Simon, R., Kramer, C., et al. 2003, A&A, 406, 915 [NASA ADS] [CrossRef] [EDP Sciences] [Google Scholar]
- Schreiber, C., Elbaz, D., Pannella, M., et al. 2018, A&A, 609, A30 [NASA ADS] [CrossRef] [EDP Sciences] [Google Scholar]
- Scoville, N., Murchikova, L., Walter, F., et al. 2017a, ApJ, 836, 66 [NASA ADS] [CrossRef] [Google Scholar]
- Scoville, N., Lee, N., Vanden Bout, P., et al. 2017b, ApJ, 837, 150 [NASA ADS] [CrossRef] [Google Scholar]
- Simpson, J. M., Smail, I., Swinbank, A. M., et al. 2017, ApJ, 839, 58 [NASA ADS] [CrossRef] [Google Scholar]
- Solomon, P. M., & Vanden Bout, P. A. 2005, Annu. Rev. Astron. Astrophys., 43, 677 [Google Scholar]
- Spilker, J. S., Marrone, D. P., Aravena, M., et al. 2016, ApJ, 826, 112 [NASA ADS] [CrossRef] [Google Scholar]
- Stutzki, J., Graf, U. U., Haas, S., et al. 1997, ApJ, 477, L33 [NASA ADS] [CrossRef] [Google Scholar]
- Tan, Q., Daddi, E., Magdis, G., et al. 2014, A&A, 569, A98 [NASA ADS] [CrossRef] [EDP Sciences] [Google Scholar]
- Valentino, F., Magdis, G. E., Daddi, E., et al. 2018, ApJ, 869, 27 [NASA ADS] [CrossRef] [Google Scholar]
- Valentino, F., Magdis, G. E., Daddi, E., et al. 2020, ApJ, 890, 24 [NASA ADS] [CrossRef] [Google Scholar]
- Walter, F., Weiß, A., Downes, D., Decarli, R., & Henkel, C. 2011, ApJ, 730, 18 [NASA ADS] [CrossRef] [Google Scholar]
- Whitaker, K. E., Franx, M., Leja, J., et al. 2014, ApJ, 795, 104 [NASA ADS] [CrossRef] [MathSciNet] [Google Scholar]
All Tables
All Figures
|
Fig. 1. Extracted spectra of the [C I](3P1–3P0) line (left) and the [C I](3P2–3P1) and CO(7–6) lines (right). Both spectra are binned in steps of 26 km s−1. The colored areas indicate that the velocity ranges corresponding to detected line emission as labeled, which were used to obtain the velocity-integrated fluxes. Blue and purple solid lines show the best-fit double Gaussians, whereas the red line in each panel shows the continuum level. The velocity offset in both panels is relative to the expected frequency of the [C I] lines at z = 4.0553. |
| In the text | |
|
Fig. 2. Mid-IR to millimeter SED of GN20 in observed wavelength. Left: complement our new continuum measurements at 1.86 and 3.05 mm (red points) with existing photometry observations at observed and λ > 160 μm and λ ≤ 160 μm (black and grey points, respectively), where the latter is omitted from the MBB modeling. Blue and red lines show the best-fit single-temperature MBB prescription assuming an optically thick (λ0 = 170 ± 23 μm) and thin dust emission, respectively. We also present the best-fit MBB model when accounting for the effect of the CMB (grey curve). The solid pink line shows the best-fit using the DL07 dust models, containing a diffuse ISM component and dust in PDR regions. The best-fit MBB parameters are listed in Table 1. Right: zoom-in of the rest-frame FIR part of the SED of GN20 when including the optically thick and thin MBB prescriptions. We note that the optically thick MBB model is a better macth to the photometry observations at λ ≤ 160 μm. |
| In the text | |
|
Fig. 3. Evolution of Td as a function of redshift. We include stacked MS galaxies from Schreiber et al. (2018) (the small red circles present the stacked galaxies in the largest mass bin with 11.0 < log(M⋆/M⊙)< 11.5 whereas large red filled circles are the weighted mean of all galaxies), stacked MS and SB galaxies from Béthermin et al. (2015) (open red and blue symbols, respectively). For the latter, we convert ⟨U⟩ to Td following Schreiber et al. (2018). We also include four dusty SFGs from Jin et al. (2019) (open blue triangles). Purple symbols depict the derived Tex of GN20 from the [C I] luminosity ratio and from the MBB modeling assuming optically thin or thick FIR dust emission. |
| In the text | |
|
Fig. 4. Comparison of the derived Md ratio based on the MBB prescription assuming different dust temperatures (50 K compared to 25 K) as a function of rest-frame wavelength. The dust continuum emission at an observed 850 μm is commonly used to infer Md. |
| In the text | |
Current usage metrics show cumulative count of Article Views (full-text article views including HTML views, PDF and ePub downloads, according to the available data) and Abstracts Views on Vision4Press platform.
Data correspond to usage on the plateform after 2015. The current usage metrics is available 48-96 hours after online publication and is updated daily on week days.
Initial download of the metrics may take a while.