Fig. 3.
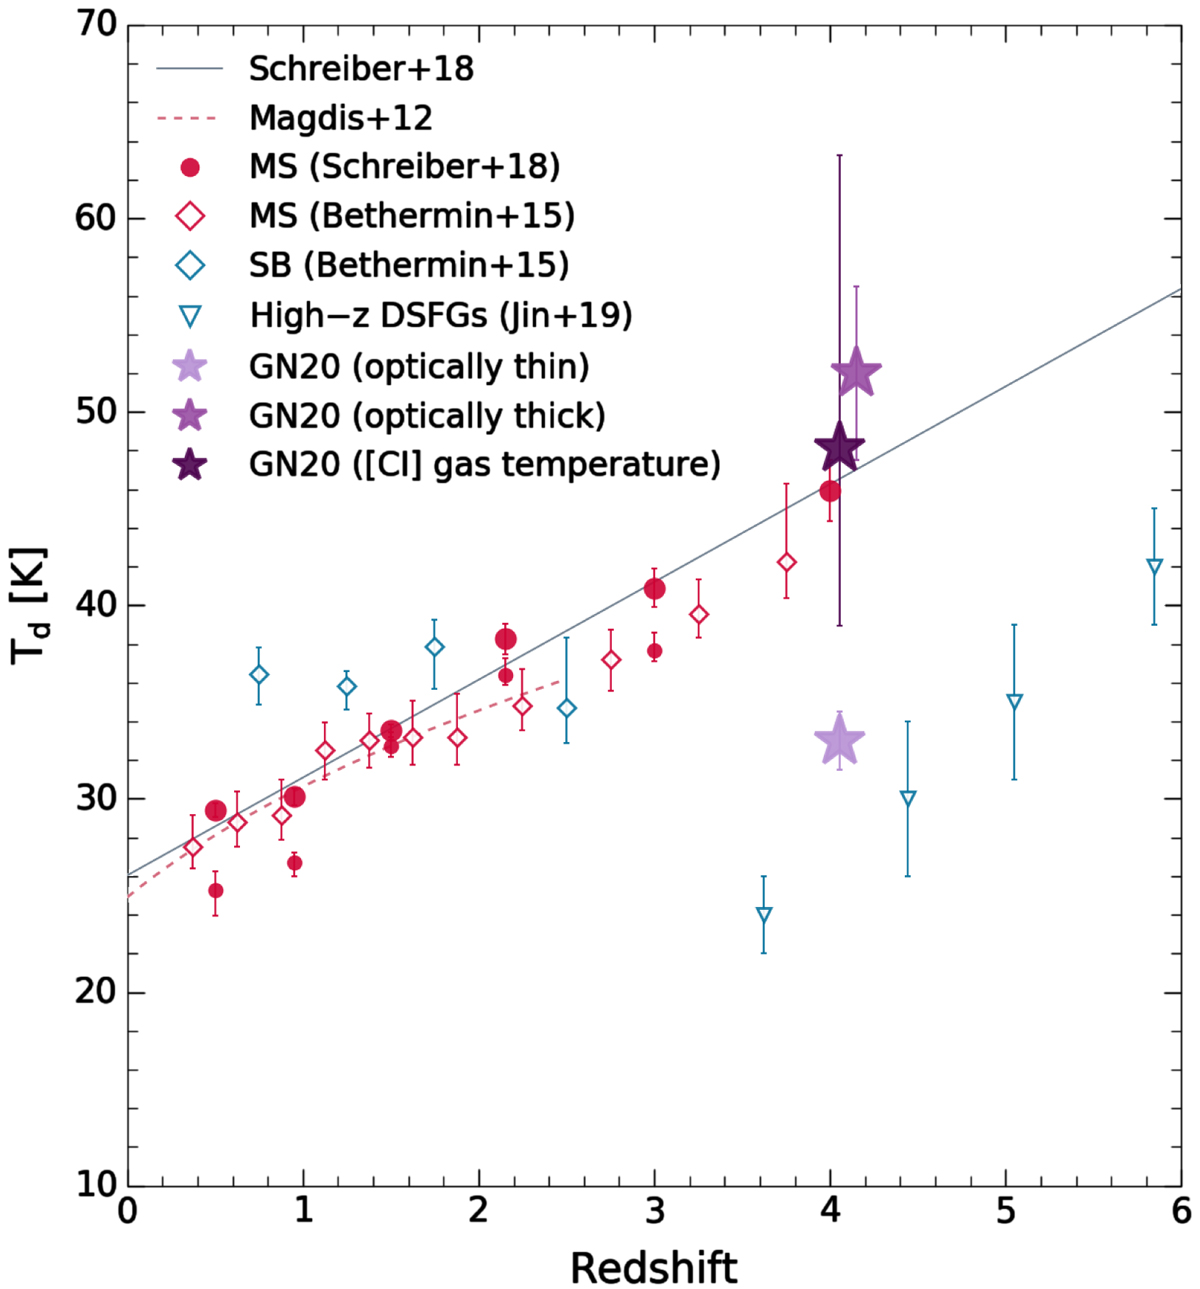
Evolution of Td as a function of redshift. We include stacked MS galaxies from Schreiber et al. (2018) (the small red circles present the stacked galaxies in the largest mass bin with 11.0 < log(M⋆/M⊙)< 11.5 whereas large red filled circles are the weighted mean of all galaxies), stacked MS and SB galaxies from Béthermin et al. (2015) (open red and blue symbols, respectively). For the latter, we convert ⟨U⟩ to Td following Schreiber et al. (2018). We also include four dusty SFGs from Jin et al. (2019) (open blue triangles). Purple symbols depict the derived Tex of GN20 from the [C I] luminosity ratio and from the MBB modeling assuming optically thin or thick FIR dust emission.
Current usage metrics show cumulative count of Article Views (full-text article views including HTML views, PDF and ePub downloads, according to the available data) and Abstracts Views on Vision4Press platform.
Data correspond to usage on the plateform after 2015. The current usage metrics is available 48-96 hours after online publication and is updated daily on week days.
Initial download of the metrics may take a while.