Fig. 2.
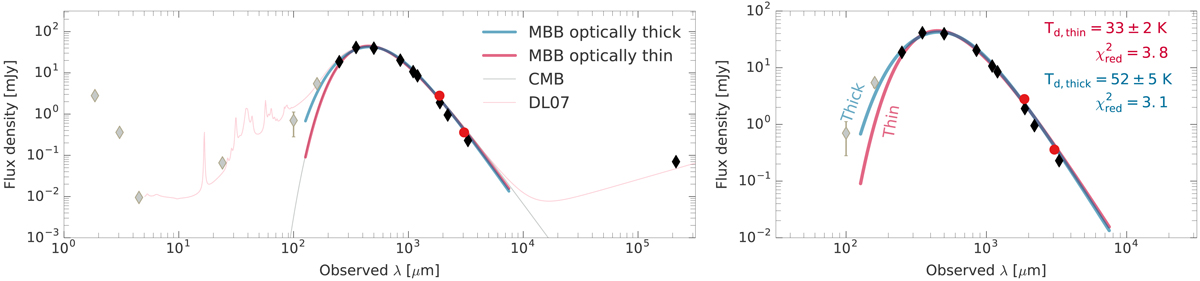
Mid-IR to millimeter SED of GN20 in observed wavelength. Left: complement our new continuum measurements at 1.86 and 3.05 mm (red points) with existing photometry observations at observed and λ > 160 μm and λ ≤ 160 μm (black and grey points, respectively), where the latter is omitted from the MBB modeling. Blue and red lines show the best-fit single-temperature MBB prescription assuming an optically thick (λ0 = 170 ± 23 μm) and thin dust emission, respectively. We also present the best-fit MBB model when accounting for the effect of the CMB (grey curve). The solid pink line shows the best-fit using the DL07 dust models, containing a diffuse ISM component and dust in PDR regions. The best-fit MBB parameters are listed in Table 1. Right: zoom-in of the rest-frame FIR part of the SED of GN20 when including the optically thick and thin MBB prescriptions. We note that the optically thick MBB model is a better macth to the photometry observations at λ ≤ 160 μm.
Current usage metrics show cumulative count of Article Views (full-text article views including HTML views, PDF and ePub downloads, according to the available data) and Abstracts Views on Vision4Press platform.
Data correspond to usage on the plateform after 2015. The current usage metrics is available 48-96 hours after online publication and is updated daily on week days.
Initial download of the metrics may take a while.