| Issue |
A&A
Volume 630, October 2019
|
|
|---|---|---|
| Article Number | A75 | |
| Number of page(s) | 30 | |
| Section | Stellar structure and evolution | |
| DOI | https://doi.org/10.1051/0004-6361/201935999 | |
| Published online | 24 September 2019 | |
Luminous red novae: Stellar mergers or giant eruptions?⋆
1
INAF – Osservatorio Astronomico di Padova, Vicolo dell’Osservatorio 5, 35122 Padova, Italy
e-mail: This email address is being protected from spambots. You need JavaScript enabled to view it.
2
INAF – Osservatorio Astronomico di Trieste, Via G.B. Tiepolo 11, 34143 Trieste, Italy
3
Max-Planck-Institut für Astrophysik, Karl-Schwarzschild-Str. 1 85748 Garching, Germany
4
European Organisation for Astronomical Research in the Southern Hemisphere (ESO), Karl-Schwarzschild-Str. 2, 85748 Garching bei München, Germany
5
School of Physics, O’Brien Centre for Science North, University College Dublin, Belfield, Dublin 4, Ireland
6
Osservatorio Astronomico di Monte Maggiore, Via Montemaggiore 3, 47016, Predappio Forlì-Cesena, Italy
7
INAF – Osservatorio Astronomico di Capodimonte, Salita Moiariello 16, 80131 Napoli, Italy
8
Institute of Space Sciences (ICE, CSIC), Campus UAB, Camí de Can Magrans s/n, 08193 Cerdanyola del Vallès (Barcelona), Spain
9
Institut d’Estudis Espacials de Catalunya (IEEC), c/Gran Capità 2-4, Edif. Nexus 201, 08034 Barcelona, Spain
10
Department of Physics and Astronomy, University of Turku, Vesilinnantie 5, 20014 Turku, Finland
11
Astrophysics Research Centre, School of Mathematics and Physics, Queen’s University Belfast, Belfast BT7 1NN, UK
12
The Oskar Klein Centre, Department of Astronomy, Stockholm University, AlbaNova 10691 Stockholm, Sweden
13
California Institute of Technology, 1200 E. California Blvd, Pasadena, CA 91125, USA
14
Finnish Centre for Astronomy with ESO (FINCA), University of Turku, Quantum, Vesilinnantie 5 20014, Finland
15
Aalto University Metsähovi Radio Observatory, Metsähovintie 114, 02540 Kylmälä, Finland
16
Lajatico Astronomical Centre, Via dei Mulini a Vento, 56030, Lajatico Pisa, Italy
17
Coral Towers Observatory, Unit 38 Coral Towers, 255 Esplanade, Cairns 4870, Australia
18
INAF – Osservatorio Astrofisico di Catania, Via S. Sofia 78, 95123 Catania, Italy
19
Dipartimento di Fisica e Astronomia, Università di Padova, Vicolo dell’Osservatorio 3, 35122 Padova, Italy
20
INFN – Sezione di Padova, Via Marzolo 8, 35131 Padova, Italy
21
Center for Astrophysics, Guangzhou University, Guangzhou 510006, PR China
22
Lunar and Planetary Lab, Department of Planetary Sciences, University of Arizona, Tucson, AZ 85721, USA
23
Osservatorio Astronomico di Monte Agliale, Via Cune Motrone, 55023 Borgo a Mozzano, Lucca, Italy
24
Las Campanas Observatory – Carnagie Institution of Washington, Colina el Pino, Casilla 601, La Serena, Chile
25
INAF – Osservatorio Astronomico di Brera, via E. Bianchi 46, 23807 Merate, LC, Italy
26
Osservatorio Astronomico del Col Druscié, 32043 Cortina d’Ampezzo, Italy
27
School of Physics & Astronomy, Cardiff University, Queens Buildings, The Parade, Cardiff CF24 3AA, UK
28
Gemini Observatory, Southern Operations Center, c/o AURA, Casilla 603, La Serena, Chile
29
School of Physics, Trinity College Dublin, The University of Dublin, Dublin 2, Ireland
30
Department of Applied Physics, University of Cádiz, Campus of Puerto Real, 11510 Cádiz, Spain
31
Departamento de Ciencias Fisicas, Universidad Andres Bello, Avda. Republica 252, Santiago, Chile
32
Millennium Institute of Astrophysics (MAS), Nuncio Monseor Sótero Snz 100, Providencia, Santiago, Chile
33
Center for Interdisciplinary Exploration and Research in Astrophysics (CIERA) and Department of Physics and Astronomy, Northwestern University, Evanston, IL 60208, USA
34
Minnesota Institute for Astrophysics, University of Minnesota, Minneapolis, MN 55455, USA
Received:
31
May
2019
Accepted:
5
August
2019
Abstract
We present extensive datasets for a class of intermediate-luminosity optical transients known as luminous red novae. They show double-peaked light curves, with an initial rapid luminosity rise to a blue peak (at −13 to −15 mag), which is followed by a longer-duration red peak that sometimes is attenuated, resembling a plateau. The progenitors of three of them (NGC 4490−2011OT1, M 101−2015OT1, and SNhunt248), likely relatively massive blue to yellow stars, were also observed in a pre-eruptive stage when their luminosity was slowly increasing. Early spectra obtained during the first peak show a blue continuum with superposed prominent narrow Balmer lines, with P Cygni profiles. Lines of Fe II are also clearly observed, mostly in emission. During the second peak, the spectral continuum becomes much redder, Hα is barely detected, and a forest of narrow metal lines is observed in absorption. Very late-time spectra (∼6 months after blue peak) show an extremely red spectral continuum, peaking in the infrared (IR) domain. Hα is detected in pure emission at such late phases, along with broad absorption bands due to molecular overtones (such as TiO, VO). We discuss a few alternative scenarios for luminous red novae. Although major instabilities of single massive stars cannot be definitely ruled out, we favour a common envelope ejection in a close binary system, with possibly a final coalescence of the two stars. The similarity between luminous red novae and the outburst observed a few months before the explosion of the Type IIn SN 2011ht is also discussed.
Key words: binaries: close / stars: winds / outflows / stars: massive / supernovae: general
Tables A.1–A.6 are only available at the CDS via anonymous ftp to cdsarc.u-strasbg.fr (130.79.128.5) or via http://cdsarc.u-strasbg.fr/viz-bin/cat/J/A+A/630/A75
Royal Society – Science Foundation Ireland University Research Fellow.
Deceased 7 March, 2019.
© ESO 2019
1. Introduction
A growing number of transients were discovered in the past few years showing intrinsic luminosities intermediate between those of classical novae and traditional supernova (SN) types. These objects are labelled as “Intermediate-Luminosity Optical Transients” (e.g., Berger et al. 2009; Soker & Kashi 2012) or “gap transients” (Kasliwal 2012; Pastorello & Fraser 2019). Although some gap transients can be genuine albeit weak SN explosions (see discussions in Horiuchi et al. 2011; Kochanek 2012, and references therein), most of them are non-terminal instabilities of massive stars that are approaching the final stages of their life, or even outbursts due to binary interaction. We have observed super-Eddington eruptions of massive Luminous Blue Variable (LBV) stars, but also LBV-like eruptions of moderate-mass stars (see, e.g., Humphreys & Davidson 1994; Smith et al. 2011, for reviews on this subject). In both cases, these transients may mimic the spectro-photometric evolution of weak Type IIn supernovae (SNe) and, for this reason, they frequently gained SN designations. As they have not undergone core-collapse and destruction, they are labelled as “SN impostors” (Van Dyk et al. 2000).
We are currently observing an increasing variety of SN impostors: some of them have a single-peaked (SN-like) light curve (e.g., SN 2007sv and PSN J09132750+7627410; Tartaglia et al. 2015, 2016). Other impostors experience a very slow evolution to maximum light lasting years to decades (UGC 2773−2009OT1, Smith et al. 2016a). Finally, an erratic photometric variability is observed for many years in other objects, ranging from the relatively faint SN 2002kg (MR ≈ − 10 mag, Weis & Bomans 2005; Maund et al. 2006; Humphreys et al. 2017) to the much more luminous SN 2000ch (MR ≈ − 13 mag; Wagner et al. 2004; Pastorello et al. 2010) and the 2009–2012 outbursts of SN 2009ip (with MR occasionally exceeding −14 mag, Pastorello et al. 2013).
Recent publications analysed a few gap transients brighter than MV ∼ −13 mag, and characterized by double or even triple-peaked light curves. From their photometric evolution, they are reminiscent of eruptive variables such as V1309 Sco (Mason et al. 2010; Tylenda et al. 2011), V838 Mon (Munari et al. 2002; Bond et al. 2003; Goranskij et al. 2004), V4332 Sgr (Martini et al. 1999), M31RV (Bond et al. 2003; Boschi & Munari 2004), OGLE-2002-BLG-360 (Tylenda et al. 2013), and M 31−2015OT1 (Kurtenkov et al. 2015; Williams et al. 2015). These events, typically fainter than MV ∼ −10 mag, are collectively dubbed “red novae” (RNe)1. They are possibly the observational outcome of stellar coalescences (e.g., Kochanek et al. 2014; Pejcha 2014). However, some objects are much more luminous than RNe: SHhunt248 (Mauerhan et al. 2015; Kankare et al. 2015), M 101−2015OT1 (Blagorodnova et al. 2017; Goranskij et al. 2016), NGC 4490−2012OT1 (Smith et al. 2016b), and SN 2017jfs (Pastorello et al. 2019). They have been proposed to be scaled-up versions of RNe, hence are labelled “luminous red novae” (LRNe). These latter have been proposed to result from merging events involving massive binaries (Smith et al. 2016b; Mauerhan et al. 2018; Barsukova et al. 2017).
Only a handful of appealing merger candidates from non-degenerate stars have been discovered so far (MacLeod et al. 2018, and references therein), and ongoing searches for putative future stellar mergers are in progress (e.g., Pietrukowicz et al. 2017). Constraining the physical and observational parameters of these rare objects and constructing templates is an essential task, also accounting for the expected burst of new discoveries with the next generation of optical and IR instruments, such as the Large Synoptic Survey Telescope (LSST Science Collaboration et al. 2009) and the Wide Field Infrared Survey Telescope (WFIRST; Spergel et al. 2015).
In this paper, we will analyse an extended sample of LRNe. For a few objects (NGC 4490−2011OT1, NGC 3437−2011OT1, and UGC 12307−2013OT1), we will provide the most estensive sets of data available in the literature. We also include M 101−2015OT1 (Blagorodnova et al. 2017; Goranskij et al. 2016) and SNhunt248 (Mauerhan et al. 2015; Kankare et al. 2015) in our sample. For both of them, we will provide new photometric measurements that complement the existing datasets. We will also discuss the case of SN 1997bs (Van Dyk et al. 2000). This object is usually interpreted as an LBV outburst, but possibly shares some similarity with LRNe (see Sect. 3.1). While we are aware that the nature of some objects discussed in this paper is still debated (e.g., SN 1997bs, M 85−2006OT1, or SN 2011ht), our main goal is to provide observational criteria to constrain the LRN class. On the basis of these arguments, we will try to link or unlink controversial cases to this family of transients.
2. The sample
The discovery of NGC 4490−2011OT1 (also known as PSN J12304185+4137498) was announced by Cortini & Antonellini (2011). The discovery epoch is 2011 August 16.83 UT2. The coordinates of the object are:  and
and 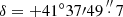 (equinox J2000.0), which is 57″ east and 37″ south of the centre of NGC 4490 (Fig. 1, top-left panel). This galaxy, classified as type SBcd by Hyperleda3, belongs to an interacting pair with NGC 4485 known as Arp 260. NGC 4490 also hosted the peculiar Type II-P SN 1982F (likely similar to SN 1987A, see Tsvetkov 1988; Pastorello et al. 2012) and the Type IIb SN 2008ax (Pastorello et al. 2008; Tsvetkov et al. 2009; Roming et al. 2009; Taubenberger et al. 2011a; Chornock et al. 2011).
Soon after the discovery of NGC 4490−2011OT1, Magill et al. (2011) spectroscopically classified it as an SN impostor. Fraser et al. (2011) analysed pre-SN HST archival images, and found a candidate progenitor with an absolute magnitude of F606W = −6.2 mag (neglecting possible reddening corrections), which is fainter than the expected luminosity of a massive LBV. More recently, Smith et al. (2016b) provided follow-up data of NGC 4490−2011OT1, along with a revised discussion on the candidate progenitor, concluding that the latter was likely an intermediate-mass yellow supergiant or (adopting a higher reddening correction) a moderate luminosity LBV. In agreement with Pastorello et al. (2008) and Smith et al. (2016b), we adopt d = 9.6 Mpc (hence, distance modulus μ = 29.91 ± 0.29 mag) as the distance to NGC 4490, which is the average value of several estimates obtained with different methods and available in the NASA/IPAC Extragalactic Database (NED)4. The Galactic reddening, provided by Schlafly & Finkbeiner (2011), is E(B − V) = 0.02 mag, while the host galaxy extinction is more uncertain. As remarked by Smith et al. (2016b), the total extinction may vary from AV = 0 to AV = 2 mag. In this paper, following Smith et al. (2016b), we will adopt for NGC 4490−2011OT1 their most likely value, E(B − V) = 0.32 mag. Multi-epoch images of the site of NGC 4490−2011OT1 are shown in Fig. 2.
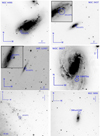 |
Fig. 1. Top-left: NGC 4490−2011OT1 in its host galaxy. The R-band image was obtained on 2012 March 24 with the 2.2 m telescope of the Calar Alto Observatory, equipped with CAFOS. Top-right: NGC 3437−2011OT1 and its host galaxy. The R-band image was obtained on 2011 January 15 with the 2.2 m telescope of the Calar Alto Observatory, with CAFOS. A blow-up showing the transient is in the upper-left inset. Middle-left: UGC 12307−2013OT1 and its host galaxy. The R-band image was obtained on 2013 October 11 with the 3.58 m Telescopio Nazionale Galileo, equipped with LRS. A blow-up with the transient is shown in the upper-left inset. Middle-right: SN 1997bs in NGC 3627. The R-band image was obtained on 1997 April 27 with the 0.91 m Dutch Telescope at ESO – La Silla. Bottom-left: M 101−2015OT1 in the outskirts of its host galaxy. The Sloan-r band image was obtained on 2015 February 18 with the 1.82 m Asiago Copernico Telescope plus AFOSC. Bottom-right: SNhunt248 in NGC 5806. The AFOSC image in the Sloan-r band was obtained on 2014 July 18. |
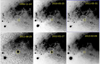 |
Fig. 2. R-band images of the location of NGC 4490−2011OT1 at six representative epochs. The field of view is 1.5′. |
NGC 3437−2011OT1 (also named PSN J10523453+2256052 and SNhunt31) is a discovery of the Catalina Real-time Transient Survey (CRTS)5, made on 2011 January 10.41 (Howerton et al. 2011). The object has coordinates  and
and  (equinox J2000.0), and is located 16″ west and 2″ north of the core of the SABc-type host galaxy NGC 3437 (Fig. 1, top-right panel). That galaxy hosted also the Type Ic SN 2004bm (Armstrong et al. 2004; Foley et al. 2004).
Independent classifications of NGC 3437−2011OT1 as a SN impostor were provided by Vinko et al. (2011) and Taubenberger et al. (2011a) on the basis of its faint absolute magnitude and the presence of narrow emission lines of H superposed on a blue spectral continuum. Weak Fe II emission lines were also detected by Taubenberger et al. (2011a). Adopting the HyperLeda recessional velocity corrected for the Local Group infall onto the Virgo Cluster (vVir = 1351 km s−1), and a standard cosmology (with Hubble Constant H0 = 73 km s−1 Mpc−1, with ΩΛ = 0.73 and ΩM = 0.27), we obtain a luminosity distance d = 18.6 Mpc, hence μ = 31.35 ± 0.15 mag. We note, however, that the above distance is significantly lower than that inferred using other methods (e.g., Tully-Fisher and sosie galaxies, reported by NED), which in fact provide a median d = 23.9 Mpc (μ = 31.89 ± 0.24 mag). In this paper, we adopt the recent Tully-Fisher estimate corrected for selection biases of Sorce et al. (2014) and scaled to H0 = 73 km s−1 Mpc−1, hence d = 20.9 Mpc (μ = 31.60 ± 0.43 mag). As there is no evidence for significant host galaxy dust absorption from the spectra, a total reddening E(B − V) = 0.02 mag is assumed (Schlafly & Finkbeiner 2011).
UGC 12307−2013OT1 (PSN J23011153+1243218) was discovered on 2013 July 17.06 by F. Ciabattari, E. Mazzoni and S. Donati of the Italian Supernova Search Project (ISSP)6. Information on the discovery was posted on the “Transient Object Followup Reports” pages of the Central Bureau for Astronomical telegrams (CBAT). The transient was observed in the irregular galaxy UGC 12307, at the following coordinates:  and
and  (equinox J2000.0). The object’s position is 6″ east of the nucleus of the host galaxy (Fig. 1, middle-left panel). The unfiltered discovery magnitude was about 18.3 mag. From the HyperLeda Virgo-corrected recessional velocity (vVir = 2881 km s−1), we obtain a luminosity distance d = 39.7 Mpc, hence μ = 32.99 ± 0.15 mag. UGC 12307−2013OT1 is significantly affected by line-of-sight Galactic reddening, which is E(B − V) = 0.22 mag according to the tabulated values of Schlafly & Finkbeiner (2011). There is no clear evidence of additional host galaxy reddening in the spectra of the transient.
For completeness, in this paper we will discuss three additional LRNe whose data are available in the literature: SN 1997bs7 (averaging different Cepheid distance estimates available in NED yields d = 9.20 Mpc, hence μ = 29.82 ± 0.07 mag; adopted extinction E(B − V) = 0.21 mag; Van Dyk et al. 2000, see Fig. 1, middle-right panel); M 101−2015OT1 (a.k.a. PSN J14021678+5426205; from the Cepheid distance d = 6.43 Mpc, μ = 29.04 ± 0.19 mag; adopted extinction E(B − V) = 0.01 mag; Shappee & Stanek 2011; Blagorodnova et al. 2017, Fig. 1, bottom-left panel); and SNhunt2488 (PSN J14595947+0154262; from the Tully-Fisher distance d = 22.50 Mpc, we obtain μ = 31.76 ± 0.36 mag; adopted extinction E(B − V) = 0.04 mag; Tully et al. 2009; Kankare et al. 2015; Mauerhan et al. 2015, Fig. 1, bottom-right panel). For all of them, we also present previously unpublished photometric data. A table with a summary of the host galaxy parameters for LRNe is given in Sect. 5.2.
Some similarity with LRNe can also be found with the 2010 outburst observed in UGC 5460 (Fraser et al. 2013, hereafter, UGC 5460−2010OT1). Such a faint transient was followed a few months later by the explosion of the Type IIn SN 2011ht (Roming et al. 2012; Humphreys et al. 2012; Mauerhan et al. 2013). The implications will be discussed in Sect. 5.4.
3. Photometric data
The light curves presented in this paper were obtained through follow-up campaigns started after the discovery announcements of each transient, but were also complemented by unfiltered data collected from amateur astronomers, scaled to the best matching broadband photometry according to the quantum efficiency curves of the CCDs used in these observations. Additional historical data were collected through the analysis of images available in the public archives. Basic information on the instrumental configurations used in the monitoring campaigns are listed in the footnotes of the photometry Tables A.1–A.6.
Photometric images were first processed by applying overscan, bias and flat-field corrections, using specific tasks in the IRAF9 environment. Multiple exposures were median-combined to increase the signal-to-noise ratio (S/N). The source instrumental magnitudes and their subsequent photometric calibrations were measured using a dedicated pipeline (SNOoPY, Cappellaro 2014). The magnitudes of individual ILOTs were obtained through the point spread function (PSF) fitting technique. The procedure allows us to subtract the sky background using a low-order polynomial fit (which – in most cases – was a second-order polynomial). A PSF template was computed using the profiles of a limited number (5 to 10) of isolated stars in the field of the transient. The fitted object is then removed from the original frames, and the residuals at the location of the object are inspected to validate the fit.
For images obtained with Johnson-Cousins filters, the photometric calibration of instrumental data was based on zeropoints and colour terms obtained through observations of standard photometric fields from the Landolt (1992) catalogue performed in photometric nights. When Landolt standards were not available (or the observations of the LRNe were taken in poor transparency conditions), archival instrumental zeropoints and colour terms were used. In order to improve the photometric calibration, we fixed a secondary sequence of stars in the fields of the LRNe. In most cases, photometric sequences were already available in the literature10. When not available in the literature, Johnson-Cousins magnitudes of secondary sequence stars were derived from broadband Sloan magnitudes released by the Sloan Digital Sky Survey (SDSS)11, following the prescriptions of Chronis & Gaskell (2008). These reference stars enabled us to compute zeropoint corrections for each night, to improve the photometric calibration. The Sloan-band photometry of M 101−2015OT1 was directly calibrated using the SDSS catalogue.
Photometric errors were computed through artificial star experiments, by placing fake stars of known magnitude near to the position of the LRNe, and measuring their magnitudes via PSF-fitting photometry. The dispersion of individual artificial star measurements was combined in quadrature with the PSF-fit and the zeropoint calibration errors, giving the final uncertainty of the photometric data. The resulting magnitudes of the transients considered in this paper are given in Tables A.1–A.6, available at the CDS, which contain the date of the observation, the JD, the optical magnitudes and errors, and a numeric code for the instrumental configuration.
3.1. Individual light curves
The multi-band light curves of the six objects are shown in Fig. 3. For most transients, stringent limits obtained before the first detection are not available, and this affects our accuracy in dating the outbursts. The main parameters of the light curves, estimated through low-order polynomial fits, are listed in Table 1. For comparison, we have also included the parameters for the well-monitored LRN AT 2017jfs (Pastorello et al. 2019)12.
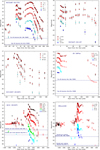 |
Fig. 3. Multi-band light curves of NGC 4490−2011OT1 (top-left), NGC 3437−2011OT1 (top-right), UGC 12307−2013OT1 (middle-left), SN 1997bs (middle-right), M 101−2015OT1 (bottom-left), and SNhunt248 (bottom-right). Empty symbols in the SN 1997bs, M 101−2015OT1 and SNhunt248 light curves are data from the literature (see text). Only the most significant detection limits are shown. All data are calibrated in the Vega system. |
Light curve parameters for the six LRNe discussed in this paper.
The object most extensively followed is NGC 4490−2011OT1. It was discovered during the fast rise to the first peak, reached on Julian Day (JD) = 2 455 798.2 ± 0.9. At this epoch, V = 16.55 ± 0.05 mag, while the colours are B − V ≈ 0.35 mag, V − I ≈ 0.5 mag and R − I ≈ 0.23 mag. The host galaxy reddening contribution is likely significant but very uncertain, as discussed by Smith et al. (2016b), and only the reddening correction due to the Milky Way dust is applied to the colours estimated in this section. For about one month after this early maximum, the light curve declines in all bands, reaching a minimum at V = 18.05 ± 0.22 mag (V − R ≈ 0.4 mag) on JD = 2 455 830.3. Then, the luminosity rises again to a second maximum, reached on JD = 2 455 937.7 ± 3.2 (i.e., about 140 d after the first V-band peak). The magnitude at the second peak is V = 16.36 ± 0.01 mag, with the following observed colours: B − V ≈ 1.15 mag, V − I ≈ 1.1 mag, and R − I ≈ 0.5 mag. Hence, the spectral energy distribution (SED) at the first maximum peaks at shorter wavelengths than at the second maximum. Hereafter, we will label the first and the second peaks as blue and red peaks, respectively. After the red peak, the light curves decline almost linearly in all bands. We monitored the luminosity decline for further ∼4 months, and the object became even redder: on JD = 2 456 048.6, V = 23.35 ± 0.28 mag, V − I = 3.2 ± 0.3 mag and R − I = 1.7 ± 0.1 mag. In our last detection (JD = 2 456 071.5, hence 272 d after the blue peak), the object has a magnitude R = 22.53 ± 0.23 mag, and R − I = 1.6 ± 0.3 mag. The red colours of NGC 4490−2011OT1 at late times along with spectroscopic clues (see Sect. 4.1) suggest that some circumstellar dust is forming. We note that in our latest detection, NGC 4490−2011OT1 is still about 1 mag brighter than the progenitor’s detection reported by Fraser et al. (2011) and Smith et al. (2016b). In fact, the object was detected by Smith et al. (2016b) with the Hubble Space Telescope (HST) at even later stages. On JD = 2 456 595.7 (over two years after the blue peak), the object has magnitude F555W (nearly V) = 25.33 ± 0.05 mag, and the following approximate colours: F438W − F555W (nearly B − V) = 0.1 ± 0.1 mag and F555W − F814W ( ∼ V − I)=1.9 ± 0.1 mag. This very late source is fainter than our latest detection, but the colours are bluer than soon after the red peak. This suggests that additional sources are powering the luminosity of NGC 4490−2011OT1 at very late phases in the Smith et al. images, possibly radiation from shell-shell collisions or light echoes. Incidentally, light echoes were observed after the eruption of V838 Mon (Munari et al. 2002; Goranskij et al. 2002; Kimeswenger et al. 2002; Crause et al. 2003). We will discuss the implications of this analogy with V838 Mon in Sect. 5.2.
The photometric evolution of NGC 3437−2011OT1 is similar to that of NGC 4490−2011OT1. The reference parameters of the blue peak light curve of NGC 3437−2011OT1 reported in Table 1 are those of the earliest multi-band observation. In fact, we assume the object reaches the blue peak on JD = 2 455 574.7, with V = 18.60 ± 0.21 mag, B − V ≈ 0.5 mag, V − I ≈ 1.1 mag, and R − I ≈ 0.4 mag. After peak, a luminosity decline is observed, lasting 24 d, when a local minimum is found at V = 19.20 ± 0.33 mag. Later on, the object experiences another luminosity rise to a red maximum, reached on JD = 2 455 671.6 (i.e., 97 days after the blue peak) in the V band. We note that the time interval between the two V-band peaks in NGC 3437−2011OT1 is shorter than that observed in NGC 4490−2011OT1 (97 d vs. 140 d). At the red peak, the apparent magnitudes are V = 18.33 ± 0.02 mag, with B − V ≈ 1 mag, V − I ≈ 1.3 mag, and R − I ≈ 0.8 mag. After peak, the luminosity declines and in one of our latest detections (on JD = 2 455 738.5) it has the following V-band magnitude and colours: V = 19.97 ± 0.12 mag, B − V ≈ V − I ≈ 1.85 (± 0.2 mag), and R − I = 0.8 ± 0.2 mag. Similar to NGC 4490−2011OT1, the peak of the spectral energy distribution (SED) of NGC 3437−2011OT1 at late phases shifts to longer wavelengths.
The red colour of UGC 12307−2013OT1 at discovery suggests that this object was already at late phases. The rise time to maximum is slow (as inferred from the two earliest CRTS detections), and is slower than the post-peak decline. On the basis of these photometric considerations along with the striking similarity of the first UGC 12307−2013OT1 spectrum with those of the other transients discussed in this paper obtained during the red maximum (see Sect. 4.1), we propose that UGC 12307−2013OT1 was discovered after the blue peak, during the rise to the red maximum. The peak is reached on JD = 2 456 481.9 ± 9.0 in the V band. The earliest multi-band data were obtained on JD = 2 456 508.5 (hence, almost four weeks after the red maximum), with V = 19.34 ± 0.06 mag. At this epoch, we measure the following colours, corrected for Galactic reddening: V − I = 0.9 ± 0.1 mag and R − I = 0.3 ± 0.1 mag. The earliest epoch with B band information is three days later, when the B − V colour is 1.6 ± 0.6 mag. Then, a decline is observed in all bands, and last detection is reported on JD = 2 456 625.3, with the following magnitudes and colours: V = 23.66 ± 0.35 mag, B − V = 1.6 ± 0.4 mag, V − I = 1.3 ± 0.4 mag, and R − I = 0.6 ± 0.3 mag. Hence, also this object becomes redder with time. As we will see in Sect. 4.1, there is spectroscopic evidence for molecular band formation, which suggests possible dust condensation. Nonetheless, all broadband light curves show a flattening at over 90 days after the red peak, which is the opposite than what expected when dust is forming.
We also observed SN 1997bs at three epochs, two around the blue peak and one at late phase. Our early photometry does not add significant information to that published by Van Dyk et al. (2000). If we account for a total reddening of E(B − V) = 0.21 mag for SN 1997bs (in agreement with Van Dyk et al.), we obtain the following colours at the blue peak: B − V ≈ 0.35 mag, V − I ≈ 0.4 mag and R − I ≈ 0.25 mag. Then the object declined to a sort of plateau (similar to that shown in the B-band light curve of AT 2017jfs, Pastorello et al. 2019), with reddening-corrected colours V − I = 1.1 ± 0.1 mag, and R − I = 0.5 ± 0.1 mag. Later, the object disappeared behind the Sun, and was recovered only five months later. For this reason, we cannot definitely assess whether this transient is a LRN or another type of gap transient. However, when recovered from 232 d to 269 d after the blue peak, the average V − I colour was around 3.2 ± 0.1 mag. Our R-band detection limit on JD = 2 450 816.8 (phase = 262 d) allows us to constrain the following colours at that epoch: V − R < 1.34 mag and R − I > 1.41 mag. Further late-measurements in 2004, 2009 and 2014 reported by Adams & Kochanek (2015), indicate the object was then fainter than the magnitude of the progenitor reported by Van Dyk et al. (2000) (V = 22.86 ± 0.16 mag). A more recent reddening-corrected colour of the source at the position of SN 1997bs is estimated from HST images (Adams & Kochanek 2015), providing V − I = 0.86 ± 0.20 mag in 2009, and V − I = 1.11 ± 0.56 mag in 2014 (under the rough assumption that the wide HST bands are similar to Johnson-Cousins filters).
The light curve of M 101−2015OT1 is extensively described in Goranskij et al. (2016) and Blagorodnova et al. (2017), and the new data provided here do not change the main outcomes. There are multiple detections of a stellar source before the main outburst, with the earliest detection being over 20 years before the discovery (B ≈ 22 mag, Goranskij et al. 2016). A subsequent detection in 2000, shows the object roughly at the same luminosity, and with the following colours: B − V = 0.0 ± 0.3 mag and V − R = 0.7 ± 0.4 mag (Blagorodnova et al. 2017). During the following years, the source experienced only minor changes in brightness, although from about 5.5 years before discovery its luminosity began to grow, with the colours becoming slightly redder (B − V = 0.33 ± 0.25 mag and V − R = 0.28 ± 0.24 mag; Gerke et al. 2015). At the time of discovery (on JD = 2 456 972.5), the object was much brighter, at R ∼ 16.6 mag. This point was very likely in the proximity of the first light curve peak (Cao et al. 2015). Later, the light curve of M 101−2015OT1 showed a rapid decline to a minimum 1.6 mag fainter (Gerke et al. 2015). About 100 days after the first maximum, the transient reached the second light curve peak (JD = 2 457 070.8) at V = 17.61 ± 0.03 mag. At this phase, the observed colours were B − V ≈ 1.3 mag, V − I ≈ 1.5 mag, and R − I ≈ 0.6 mag. During the decline after the second maximum, the colours became even redder. The new data presented in this paper are mostly pre-discovery observations of amateur astronomers. However, we also include unfiltered observations of the outburst (converted into V or R band photometry depending on the response curve of the CCDs used by the amateur astronomers). In particular, we report a detection of the first outburst on JD = 2 456 975.34 at R = 15.78 ± 0.13 mag, suggesting that the Cao et al. detection was actually before the blue light curve peak. Later photometric points cover the red peak evolution, and well match the light curve of Blagorodnova et al. (2017).
Finally, the last object in our sample is SNhunt248, widely discussed in Kankare et al. (2015) and Mauerhan et al. (2015). Here we provide additional data, with the most valuable ones obtained by the Palomar Transient Factory (PTF, Law et al. 2009; Laher et al. 2014) survey, and made publicly available through the NASA/IPAC Infrared Science Archive (IRSA)13. For a detailed description of the light curve, we address the reader to the above two papers, and to the parameters listed in Table 1. Briefly, we note that SNhunt248 has a similar colour evolution as other objects of this sample until the second post-outburst maximum (see Sect. 3.2), while the R − I colour is bluer (up to ∼1 mag) at very late phases (200–300 d after the first peak). The time span between the two light curve peaks ranges from 69 to 85 d, depending on the filter. In general, all LRNe reach the second peak later in the redder bands (see Table 1). We targeted SNhunt248 with the 1.82 m Copernico telescope of Mt. Ekar at very late phases (on March 2017, over 1000 d after the blue peak), but we only measured an upper limit (R > 22.3 mag) at the position of the transient. However, Mauerhan et al. (2018) report multiple detections in HST images obtained in June 2015 at F555W = 25.46 ± 0.03 mag and F555W − F814W (nearly V − I) = 0.9 ± 0.1 mag.
3.2. Photometric comparison with similar transients, and pseudo-bolometric light curves
The evolution of the U − B, B − V, V − I, and R − I colours for the six objects of our sample, corrected for the reddening values as discussed in Sect. 2, is shown in Fig. 4. In particular, for NGC 4490−2011OT1, we now account also for the host galaxy reddening, adopting the total value E(B − V) = 0.32 mag, as in Smith et al. (2016b). We note an overall similarity in the colour evolution of these objects at early phases, although with some subtle differences. M 101−2015OT1 (Fig. 4) appears slightly redder than other LRNe, and this is possibly due to lower photospheric temperature or an underestimate of the line-of-sight extinction. On the opposite side, at late epochs, UGC 12307−2013OT1 and SNhunt248 have significantly bluer V − I and R − I colours than other LRNe. In this context, AT 2017jfs (Pastorello et al. 2019) is an outlier, as its B − V rises rapidly to a much redder colour than other LRNe (∼2.7 mag at 4 months past blue maximum).
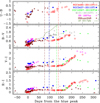 |
Fig. 4. Colour evolution for our sample of LRNe. The phase is in days from the first V band maximum. For UGC 12307−2013OT1, we tentatively adopted JD = 2 456 350 as epoch of the first peak. The dot-dashed vertical lines (plotted maintaining the same colour codes as the symbols) mark the epochs of the red maximum for the different objects. In SN 1997bs, the red maximum was not observed. The B − V colour curve of AT 2017jfs (Pastorello et al. 2019) is also shown as a comparison (solid line). |
Some diversity can also be noticed in the intrinsic luminosities of our LRN sample, which approximately span one order of magnitude. In general, all events have peak absolute magnitudes MV < −12 mag, although none of them reaches MV = −15 mag. We remark that RNe fainter than ∼ − 12 do exist, and have been observed in the Milky Way and in M 31, but their low intrinsic luminosity makes their detection problematic outside the Local Group. As we will see in Sect. 5.2, there is very likely a continuity in the RN and LRN luminosity distribution.
In order to best compare the light curves in our LRN sample, we compute the pseudo-bolometric light curves by integrating the fluxes in the well-sampled BVRI bands (or, when observed, Sloan-gri). When a photometric point is not available at a given epoch for one of the filters, its contribution is estimated through an interpolation of the available data or extrapolating the last available epoch accounting for the colour information. The fluxes at the filter effective wavelengths, corrected for extinction, provide the SED at each epoch, which is integrated using the trapezoidal rule. No flux contribution is assumed outside the extremes of the integration regions. We note, however, that the UV flux is likely significant at the epoch of the first peak, and the IR band contribution may increase with time, becoming predominant at late phases. The observed flux is finally converted to luminosity using the values for the distances of the transients discussed in Sect. 2. The resulting pseudo-bolometric light curves are shown in Fig. 5. For comparison, the pseudo-bolometric light curve of LRN AT 2017jfs (Pastorello et al. 2019) is also reported.
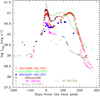 |
Fig. 5. Pseudo-bolometric (optical) light curves for six LRNe presented in this paper. The phase is in days from the first peak. AT 2017jfs data (solid line) are from Pastorello et al. (2019). |
Although there are some differences in the photometric evolution of our transient sample, a double-peaked light curve is clearly observable in most cases. When a double peak is not observed, this is possibly due to an incomplete coverage, or the red peak is shallow resembling a sort of plateau (like in SN 1997bs). The pseudo-bolometric luminosity of the two peaks in NGC 4490−2011OT1 is similar, with Lopt ∼ 1041 erg s−1. The blue peak of SNhunt248 is slightly more luminous than that of NGC 4490−2011OT1, peaking at Lopt ∼ 1.4 × 1041 erg s−1, but it is fainter than AT 2017jfs (Pastorello et al. 2019) that peaks at Lopt ∼ 3 × 1041 erg s−1. However, the former reaches a red light curve maximum one-month earlier than NGC 4490−2011OT1, at a luminosity of 7 × 1040 erg s−1. The pseudo-bolometric light curve of NGC 3437−2011OT1 has a similar shape as NGC 4490−2011OT1, but it is slightly fainter, with both peaks having Lopt ∼ 3−4 × 1040 erg s−1. The other three objects, UGC 12307−2013OT1, SN 1997bs and M 101−2015OT1, have an incomplete photometric coverage. However, a flattening in their light curves and/or spectroscopic considerations (e.g., the identification of molecular bands in the late spectra of UGC 12307−2013OT1, see Sect. 4.2) support their proximity to LRNe. For UGC 12307−2013OT1, light curve monitoring covers only the red peak, which reaches a luminosity of about 1041 erg s−1. SN 1997bs has a blue peak with Lopt ∼ 3.3 × 1040 erg s−1. Then, instead of a clear red peak, its pseudo-bolometric light curve flattens to about 1040 erg s−1 (but the photometric coverage is incomplete in this phase). In contrast, M 101−2015OT1 is much fainter than all other transients: the single detection during its blue peak allows us to constrain its luminosity to ≥1.4 × 1040 erg s−1, while the red peak reaches Lopt = 6.6 × 1039 erg s−1.
3.3. Searching for previous outbursts in archival data
The LRN sites were frequently monitored in past years by a number of amateur astronomers and professional sky surveys. In particular, we collected a large amount of images from the Catalina Sky Survey (CSS), and from PTF (obtained via NASA/IPAC IRSA). Other data were collected from the IsaacNewton Telescope Archive14. Finally, data were provided by a number of amateur astronomers, and sparse pre-outburst images were retrieved through other public archives.
We inspected these images to detect signatures of previous outbursts. Historical detections and upper limits (V-band absolute magnitudes) at the expected positions of the transients are reported in Fig. 6. NGC 4490−2011OT1 was detected about 1.5 months before the blue peak at a magnitude significantly brighter than that of the quiescent progenitor recovered in HST images and discussed by Fraser et al. (2011) and Smith et al. (2016b). Faint detections are measured in archival images (obtained from about 20 years to ∼1 year before the outbursts) in two cases (see Fig. 6): M 101−2015OT1 (with MV in the range from −7.5 to −9.5 mag, see Blagorodnova et al. 2017; Goranskij et al. 2016) and SNhunt248 (with MV ≈ −10.5 mag, and MR in the range from −9.5 to −11 mag, Kankare et al. 2015).
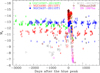 |
Fig. 6. Long-term photometric monitoring (specifically, V-band absolute magnitudes) for extra-Galactic LRNe discussed in this paper, covering about a decade of their evolution. Pre- and post-discovery detection limits are indicated with “down-arrow” symbols. The phase is in days from the first (blue) peak in the V band. The absolute light curves of LRN outbursts are compared in detail in Sect. 5.2. |
The remaining three LRNe were not detected prior to their discoveries. We note, however, that only NGC 4490−2011OT1 has sparse detection limits down to about −8 or −9 mag, while the detection limits for both UGC 12307−2013OT1 and NGC 3437−2011OT1 are typically less stringent (MV > −12.5 mag and −13 mag, respectively). In order to increase the depth of the detection limits, for NGC 3437−2011OT1 we have created some deep seasonal stacks, obtaining more stringent limits down to MV ≈ − 9.8 mag. Therefore, with the available archival data, it is unlikely that the objects discussed in this paper experienced major outbursts in the past few years before their discoveries.
4. Spectroscopic data
Our spectral sequences of NGC 4490−2011OT1, NGC 3437−2011OT1, and UGC 12307−2013OT1 were obtained using a number of telescopes available to our collaboration, including the 3.58 m Telescopio Nazionale Galileo (TNG) equipped with LRS, the 2.56 m Nordic Optical Telescope (NOT) with ALFOSC, the 4.2 m William Herschel Telescope (WHT) with ISIS, and the 10.4 m Gran Telescopio Canarias (GTC) + OSIRIS. All of them are hosted at the Roque de los Muchachos Observatory (La Palma, Canary Islands, Spain). Additional spectra were taken with the 1.82 m Copernico Telescope plus AFOSC of the INAF – Osservatorio Astronomico di Asiago (Ekar1.82; Mt. Ekar, Asiago, Italy), the 2.2 m reflector telescope of the Calar Alto Observatory with CAFOS (CAHA2.2; Almeria, Spain), the 3.58 m New Technology Telescope (NTT) + EFOSC2 (ESO – La Silla Observatory, Chile), the 1.93 m telescope of the Observatoire de Haute-Provence plus CARELEC (OHP1.93; Alpes-de-Haute-Provence département, France), the 2 × 8.4 m Large Binocular Telescope (LBT) with MODS of the Mount Graham International Observatory (Arizona, US), and the 4.1 m Southern Astrophysical Research (SOAR) telescope plus the Goodman Spectrograph of the Cerro Tololo Inter-American Observatory (Cerro Pachón, Chile).
The spectra were reduced following standard procedures in IRAF. We first corrected the 2-D spectra for bias, overscan and flat-field. Then, the 1-D spectra of the targets were extracted and calibrated in wavelength using arc lamp spectra obtained during the same night and with the same instrumental configuration as our targets. The flux calibration was performed using spectra of spectro-photometric standard stars. To check the accuracy of the flux-calibration of the LRN spectra, we compared the spectro-photometric data derived from our spectra with the broadband photometry obtained during the same night and, in case of discrepancy, a correction factor was applied to the spectra. Occasionally, when a wavelength-dependent flux loss was found, a linear flux correction was applied to the spectrum. The spectra of standard stars were also used to remove the strongest telluric absorption bands (O2 and H2O) from the LRN spectra. We remark that an incomplete removal of these telluric bands may occasionally affect the profile of individual spectral features.
Basic information on the spectra is given in Table 2, while the final spectra are shown in Fig. 7. A blow-up of the region between 4250 and 5450 Å is shown for a sub-sample of LRN spectra in Fig. 8. While Hγ, Hβ and numerous Fe II multiplets are visible in emission during the blue light-curve peak (left panel) the same features are mostly in absorption during the broad red peak (right panel). The spectral evolution of our LRN sample will be illustrated in detail in Sect. 4.1.
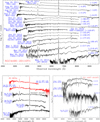 |
Fig. 7. Top: spectral evolution of NGC 4490−2011OT1. Bottom-left: spectra of NGC 3437−2011OT1 shown with those of SN 2007bs available in the literature (Van Dyk et al. 2000; Tartaglia et al. 2015). Bottom-right: spectral evolution of UGC 12307−2013OT1 during and after the red light-curve peak. A low S/N SOAR spectrum of UGC 12307−2013OT1 obtained on 2013 August 26 is shown for completeness. |
Log of spectroscopic observations of NGC 4490−2011OT1, NGC 3437−2011OT1, and UGC 12307−2013OT1.
4.1. Spectroscopic evolution of individual objects
The spectroscopic follow-up of NGC 4490−2011OT1 covers all crucial phases of its evolution (Fig. 7, top panel). Early spectra (from 2011 August 18 to September 2, obtained at the time of the blue light curve peak; Fig. 9, top-left panel) resemble those of other SN impostors (e.g., Van Dyk et al. 2000; Pastorello et al. 2010) and Type IIn SNe. These spectra are characterized by a blue continuum with superposed prominent narrow lines of the Balmer series. The H features are in emission and have a Lorentzian profile, with a full-width at half-maximum (FWHM) velocity vFWHM ∼ 400−500 km s−1 and wings extending up to about 3200 km s−1. The flux measured for Hα is of the order of 10−13 erg s−1 cm−2. In addition, a number of lines of Fe II, O I, and Ca II with P Cygni profiles are detected, and become more prominent with time. In this period, the continuum temperature, estimated through a blackbody fit, drops from about 18 000–14 000 K.
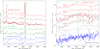 |
Fig. 8. Detail of region 4250−5450 Å for selected LRN spectra presented in this paper. Left: early-time LRN spectra, obtained during the first luminosity peak. Right: LRN spectra during the second, red peak. The vertical dot-dashed lines mark the rest wavelengths of Hβ and Hγ. |
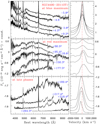 |
Fig. 9. Left panels: spectral evolution of NGC 4490−2011OT1, with only higher S/N spectra shown. Right panels: evolution of Hα in velocity space. The spectra obtained at the blue peak are shown in the top panels, those obtained at the red peak are in the middle panels, and the late spectra are in the bottom panels. The spectra were reported to the rest frame applying a Doppler correction (the redshift z = 0.002265 is determined from a nearby H II region, and was corrected accounting for the heliocentric velocity); no reddening correction was applied to the spectra. |
Later spectra (from 2011 November 21 to 2012 January 30; roughly covering the early evolution around the second peak, Fig. 9, middle-left panel) become much redder, and the line profiles drastically change: at these epochs, a forest of metal lines in absorption is observed. In particular, many lines of Fe II are observed, with the multiplet 42 being very strong. Ti II lines are likely responsible for the flux deficit at blue wavelengths15. Along with these metal lines, we now identify also Sc II, Ba II, and Na I. The O I (λλ7772−7775 and λ8446), and Ca II features (both H&K and the NIR triplet) are now seen in absorption. He lines are not detected at any phase. With time, the Balmer lines become much weaker, and are dominated by the absorption component. Only Hα still has a moderately prominent emission component, whose flux decreases by one order of magnitude with reference to the early epochs. The wind velocity, as inferred from the minimum of isolated Fe II lines, is about 300–350 km s−1, while from Hα (that has now a Gaussian profile) we estimate vFWHM ∼ 200−300 km s−1 from our highest resolution spectra16. The continuum temperature declines from about 7000 K to 4500 K. Comprehensive line identification in two spectra of NGC 4490−2011OT1 obtained in the proximity of the first and the second light curve peaks is shown in Fig. 10 (top and bottom panels, respectively), while a detailed view of the two spectra in selected spectral regions is shown in Fig. 11. We note that Smith et al. (2016b) extensively monitored the object in spectroscopy during the second light curve peak. From their highest resolution spectrum (obtained on January 12), they infer a velocity of 280 km s−1 from the middle of the blueshifted Hα absorption component (consistent with our estimates), with a maximum velocity of 650 km s−1 from the blue edge of the absorption feature.
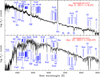 |
Fig. 10. Line identification in two spectra of NGC 4490−2011OT1, at the first (top) and the second peaks (bottom). |
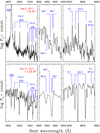 |
Fig. 11. Blow-up of selected spectral windows in two spectra of NGC 4490−2011OT1, at first peak (top panels) and during second maximum (bottom panels). The regions at 4750–5350 Å (left panels), 5800–5950 Å (middle panels) and 8300–8800 Å (right panels) are shown. The positions marked in the bottom panels are those of the P Cygni minima, obtained assuming an average expansion velocity of 300 km s−1 (see text). The position of He I λ5876 is also marked, although that feature is not clearly detected. |
At later phases, after 2012 February 18 and during the light curve decline following the second peak, the narrow Balmer lines in emission become quite prominent, with vFWHM increasing to about 700–900 km s−1. In our latest spectrum (2012 May 15), the Ca II NIR triplet along with O I λ8446 are also clearly detected in emission. At the same time, the very red continuum (T ≈ 3000–4000 K) is characterized by broad molecular absorption bands (Fig. 9, bottom-left panel), as will be discussed in Sect. 4.2. The overall spectral evolution of NGC 4490−2009OT1 closely resemple that of LRN AT017jfs (Pastorello et al. 2019).
The complete evolution of the Hα line profile (in velocity space) is shown in the right panels of Fig. 9. In particular, the middle-left panel emphasizes the weakness of Hα during the second peak. We also note that the Hα emission peak is slightly blueshifted in the late spectra of NGC 4490−2011OT1 (bottom-right panel of Fig. 9). This is usually interpreted as a signature of dust condensation.
Using the information available for the bolometric light curve17 and the continuum temperature, we can compute the radius evolution of the emitting photosphere, which is 700–1000 R⊙ at the time of the first peak. It rises to ∼5000–6000 R⊙ at around 100 d after the first maximum, and peaks to almost 17 000 R⊙ (R ≈ 1.17 × 1015 cm) soon after the second (red) light curve maximum. Later on (70 days after), the radius steadily declines by a factor ∼2. The overall evolution of the bolometric and Hα line luminosities, the continuum temperature and the radius of the emitting region in NGC 4490−2011OT1 are shown in Fig. 12. We note that the temperatures inferred for NGC 4490−2011OT1 at the time of the red maximum are comparable to those estimated by Blagorodnova et al. (2017) for M 101−2015OT1. The radius of the emitting photosphere at the red maximum is a factor 3 higher in NGC 4490−2011OT1 than in M 101−2015OT1. All of this favours a more massive progenitor for NGC 4490−2011OT1. Another interesting comparison is with SNhunt248 (Kankare et al. 2015). In this case, while the radius of SNhunt248 at the time of the blue peak is one order of magnitude larger than NGC 4490−2011OT1, at the time of the red peak the radii are very similar.
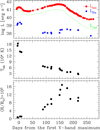 |
Fig. 12. Evolution of the bolometric, optical (BVRI) and Hα luminosities (top panel), continuum temperature (middle panel) and photospheric radius (bottom panel) in our spectra of NGC 4490−2011OT1. A conservative error of 500 K is estimated for the blackbody continuum temperature. |
The spectral evolution of NGC 3437−2011OT1 (Fig. 7, bottom-left panel) is similar to that of NGC 4490−2011OT1. The three early spectra (from January to February 2011) are representative of the blue peak phase, with Hα having a Lorentzian profile. The spectrum of NGC 3437−2011OT1 taken on 2011 May 4 is very similar to those of NGC 4490−2011OT1 at the second maximum, with a red continuum, a low-contrast Hα in emission with a Gaussian profile, and a number of metal lines visible in absorption. The spectra of NGC 3437−2011OT1 in Fig. 7 are shown along with those of SN 1997bs available in the literature (Van Dyk et al. 2000; Tartaglia et al. 2015) obtained at the time of blue light curve peak. In both objects, an indicative vFWHM ∼ 700 km s−1 is estimated for Hα. We also note that none of these objects show the [Ca II] doublet emission which usually characterizes other types of gap transients, including the intermediate-luminosity red transients (ILRTs, Botticella et al. 2009; Kasliwal et al. 2011) and S Dor-type LBV outbursts (e.g., Walborn et al. 2017, and references therein).
The first two spectra of UGC 12307−2013OT1 (taken on 2013 August 1 and 8) cover the evolution of the transient during the second (red) light curve maximum18 (see Fig. 7, bottom-right panel). For the narrow Hα emission, we measure vFWHM ∼ 800–1000 km s−1. The last spectrum of UGC 12307−2013OT1, obtained on 2013 October 24 is reminiscent of the very late spectra of NGC 4490−2011OT1 shown in the top panel, with a very red continuum, a strong Hα in emission, and broad molecular bands in absorption (see Sect. 4.2).
4.2. Detection of molecules and dust formation
Late-time spectra of NGC 4490−2011OT1, UGC 12307−2013OT1, and M 101−2015OT1 (Blagorodnova et al. 2017) are extremely red, and show broad absorption bands, along with the usual Hα emission (Fig. 13). These absorptions are identified with molecular bands (see, e.g., Pastorello et al. 2019), and are frequently observed in RNe and in late-type stars. Late spectra of the two objects mentioned above are compared in Fig. 13 with late spectra of the RNe V838 Mon and V1309 Sco. The prominent Hα and Hβ features have been cut in the spectrum of V838 Mon to emphasize the absorption bands. Following Kamiński et al. (2009), we identify a number of features due to VO and TiO. However, also H2O and CrO are very likely present.
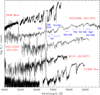 |
Fig. 13. Detection of molecules in late spectra of NGC 4490−2011OT1, UGC 12307−2013OT1 and M 101−2015OT1 (Blagorodnova et al. 2017), and comparison with late spectra of RNe V838 Mon (Kamiński et al. 2009) and V1309 Sco (Mason et al. 2010). Hα and Hβ are excised in the spectrum of V838 Mon to emphasize the broad molecular absorption bands. |
We note that RNe usually experience a metamorphosis from a bluer spectral type at the epoch of the light curve peak to an M-type at late phases, and all their spectra transition from being continuum-dominated to a configuration characterized by broad and strong molecular absorption features (see, e.g., V4332 Sgr, Martini et al. 1999). Barsukova et al. (2014) suggested that the spectrum of V4332 Sgr observed over a decade after the outburst, showing simultaneously a late M-type continuum, molecular bands and emission features of metals, was due the contribution of a third, red companion that was dynamically destroying the expanding envelope produced in the merging event.
The detection of molecular bands in the optical spectra is an argument frequently used to support the dust formation at late phases. In fact, a strong IR flux excess was measured by Smith et al. (2016b) in Spitzer images of NGC 4490−2011OT1 obtained about three years after the outburst. From their analysis, Smith et al. determined the presence of cool (725 K) circumstellar dust, at ∼80 AU and an emitting dust mass of at least 10−9 M⊙. This dust shell may have formed in the ejected material after the eruptive event, or was possibly already present in the circumstellar environment. The strong IR excess can be more likely explained as dust heated by a survived stellar source (e.g., the outcome of a stellar merger), otherwise it may be the signature of an IR echo (Smith et al. 2016b). Another object of this family showing a clear NIR excess about one year after the outburst is SNhunt248. Mauerhan et al. (2018) estimated the presence of dust (650 K–1450 K) at the location of SNhunt248. Using similar arguments as Smith et al. (2016b), Mauerhan et al. (2018) favoured a scenario with the dust being heated by a surviving star rather than an IR echo. A somewhat different interpretation was given by Evans et al. (2003) for V838 Mon, from the inspection of a NIR spectrum obtained almost 10 months after discovery. The stellar radius exceeding 800 R⊙ and the extremely red continuum, with Teff ≲ 2300 K as constrained by the strength of some molecular bands (in particular, H2O and CO) and the absence of CH4, were considered as an evidence for the presence of a very cool supergiant (a late L-type star), without necessarily linking these observables with dust signatures.
As a support for the newly formed dust scenario in NGC 4490−2011OT1, we note that the large photospheric radius estimated at the time of the second (red) peak (17–20 × 103 R⊙, which is about 80–90 AU; see mid panel in Fig. 12) suggests that pre-existing dust at ∼80 AU would have been swept away by the fast expanding material ejected during the outburst. In addition, the late-time blueshift of the Hα emission peak is a further argument that supports the formation of new dust.
Thus, the presence of previously existing or new dust may be a common property in double-peaked transients, including known RNe (e.g., Banerjee et al. 2015; Exter et al. 2016, and references therein). The origin of the dust is controversial also for RNe, and plausible scenarios include interstellar (e.g., Tylenda 2004; Crause et al. 2005; Tylenda et al. 2005; Kamiński et al. 2011) vs. circumstellar dust (Bond et al. 2003; Van Loon et al. 2004; Bond 2007; Wisniewski et al. 2008), or even a combination of both (see Banerjee et al. 2006). Tylenda & Kamiński (2016) found that dust was present before the outburst of V1309 Sco, but new dust also formed soon after the outburst in the expanding envelope. Due to the presence of dusty environments, these objects are expected to contribute to the rich population of IR transients recently discovered in nearby galaxies by the SPitzer InfraRed Intensive Transients Survey (SPIRITS; Kasliwal et al. 2017). We will discuss the implications in Sect. 5.
5. On the nature of double-peaked SN impostors
As reported previous sections, the six LRNe studied in this paper form a small family of transients with well-defined observational properties, that can be summarized as follows.
– Their light curves are reminiscent of those of RNe, with an initial blue light curve maximum, followed by a broader red peak which, in some cases (e.g., SN 1997bs), is stretched to become a sort of plateau. However, LRNe are significantly more luminous than RNe, ranging between MV = −12 and −15 mag at maximum.
– From the inspection of archival images, the precursors of this family of transients do not show further major outbursts (with luminosity comparable with those of the blue and red peaks) in the years prior to their discovery.
– Early spectra (during the blue peak) are similar to those of Type IIn SNe, with a blue continuum and prominent Balmer lines in emission. During the red light-curve peak, the spectra become similar to those of mid to late spectral-type stars, with a forest of narrow absorption metal features and Balmer lines being barely visible.
– Finally, at very late phases (from ∼4 to 6 months after the blue maximum), their optical spectra display evident absorption features due to molecular bands, and – at least in some cases – there are indications (in the IR domain) of a dusty circumstellar medium (CSM).
– The LRN properties at very late phases, as detailed for NGC 4490−2011OT1 (Fig. 12), suggest that a luminous stellar-like source is still visible, having a very extended (R ∼ 104 R⊙) optically thick photosphere which is radiating L ≈ 6 × 1039 erg s−1 (hence log L/L⊙ ∼ 6.2). This very red source is powered by a combination of radiated energy from the survived stellar merger (which has still a burning core), plus residual thermal energy released during the merging event, and perhaps interaction between colliding shells.
– As we will see in Sect. 5.1, when the progenitor stars are observed in a pseudo-quiescent stage in deep HST archival images, none of them is very luminous or has a very large mass. These recovered progenitor stars (or stellar systems) are preferentially moderate luminosity, relatively massive and hot supergiants.
In the forthcoming sections, we will summarize what is known on the progenitor stars of LRNe (Sect. 5.1), we will characterize them in the context of RNe (Sect. 5.2) and will offer interpretations for their observables, providing insights on plausible end-of-life scenarios (Sect. 5.3 and Sect. 5.4).
5.1. Progenitors of luminous double-peaked transients
So far, direct information on the progenitor stars is available for four of the transients discussed in this paper. The stellar precursor of NGC 4490−2011OT1 was recovered in a putative quiescent stage by Smith et al. (2016b) only in one band (in 1994 HST images), at MV ≈ −6.4 mag (consistent with the absolute magnitude determined by Fraser et al. 2011). Two non-detections from Spitzer images obtained in 2004 (assuming little or no photometric variability in ten years) help in constraining the spectral type. Nonetheless, a precise colour estimate is impossible because of the single band detection and the large uncertainty in the line-of-sight reddening to NGC 4490−2011OT1. Smith et al. (2016b) discussed three reddening scenarios: 1) The luminosity of the star is attenuated by Milky Way reddening only (E(B − V) = 0.02 mag; Schlafly & Finkbeiner 2011). Adopting this low reddening value, the putative progenitor is a yellow star with effective temperature Teff = 7500 K and a luminosity of about 104 L⊙, implying an F-type moderate-mass supergiant star of around 10 M⊙. 2) Assuming E(B − V) = 0.32 mag, Smith et al. (2016b) obtained Teff = 15 000 K and L ∼ 105 L⊙. In this case, the progenitor would be a more massive mid-B supergiant. Assuming a single-star model, the resulting progenitor mass is about 20–30 M⊙, still consistent with a relatively low mass LBV. 3) Finally, adopting as total reddening the upper limit of E(B − V) = 0.67 mag19, Smith et al. (2016b) obtained a very hot (Teff ≥ 50 000 K) and luminous (L ∼ 106 L⊙) progenitor, which would be an extremely massive O-type main sequence or a Wolf-Rayet star. Smith et al. suggested that the non-detection of a source at the position of NGC 4490−2011OT1 in 2004 deep Spitzer observations allowed us to safely rule out a late spectral type for the progenitor of this LRN. On the other hand, a high reddening scenario is not plausible because this would imply the progenitor to be a very hot, luminous O-type or Wolf-Rayet star of around 80–100 M⊙ (to explain its enormous luminosity), difficult to reconcile with the remote location of the transient in NGC 4490. The above arguments led Smith et al. (2016b) to favour scenario number 2. If the lower mass binary companion does not give a significant contribution to the total luminosity, the progenitor is more likely to be an intermediate-mass yellow supergiant to a moderate-mass LBV. However, a binary system with a significant contribution to the global luminosity from the companion star cannot be ruled out. This would lead to a different mass and spectral type for the progenitor of NGC 4490−2011OT1.
An object having more stringent information on the quiescent progenitor star is M 101−2015OT1. Blagorodnova et al. (2017) argued that the progenitor was a binary system with a primary F-type yellow supergiant (Teff ≈ 7000 K), with a luminosity of 8.7 × 10⁴ L⊙, hence with M ≈ 16−18 M⊙, and a modest-mass secondary companion. Goranskij et al. (2016), on the basis of its proximity with nearby OB-supergiant associations, proposed a somewhat bluer progenitor. While a common envelope was surely ejected by the binary progenitor of M 101−2015OT1, the post-outburst fate is uncertain, as the outcome can be either a merger or a surviving close binary (Blagorodnova et al. 2017). In the latter scenario, we would expect to detect signs of photometric variability in future IR photometric observations.
The pre-outburst history of SNhunt248 is somewhat different, as there is evidence of significant photometric oscillations (of the order of 1 mag) in the pre-outburst phase (Kankare et al. 2015). Adopting only the Milky Way reddening contribution, from observations obtained about 2 years before the outburst, Kankare et al. find Teff ≈ 6700 K and L ≈ 106 L⊙ for the progenitor. Mauerhan et al. (2015) computed Teff ≈ 6500 K and L ≈ 4 × 10⁵ L⊙ for the stellar precursor detected in images obtained over 9 years before the outburst, which are consistent with the above estimates accounting for the past variability history. In both estimates, the progenitor is consistent with being a luminous yellow (late F-type to early G-type) hypergiant of M ≈ 30 M⊙. A super-Eddington outburst of an LBV-like star or close stellar encounters with a binary companion are alternative explanations for the observed outburst (Mauerhan et al. 2015). However, the above mass value should be taken with a bit of caution, as the magnitude estimates of the progenitor star (or stellar system) were possibly obtained in a non-quiescent stage.
Finally, progenitor mass estimates are available also for SN 1997bs. Van Dyk et al. (1999) found a MV ≈ −7.4 mag source in 1994 December HST images. As there is a single-band detection, no information is provided on the intrinsic colour and variability, although the authors favoured a super-outburst of an LBV as the most likely explanation for the outburst. Van Dyk & Matheson (2012) estimated Teff > 6300 K (hence a spectral type hotter than F6) and a mass exceeding 20 M⊙ for the progenitor of SN 1997bs; Adams & Kochanek (2015) favoured a marginally lower mass star, of about 20 M⊙, rather than a massive LBV. Post-eruption HST imaging obtained in March 2001 revealed the source to be still marginally visible, about 3 mag fainter than the 1994 detection (and with a relatively blue colour, V − I < 0.8 mag), initially leading Li et al. (2002) to doubt that the star had survived the outburst. However, Van Dyk & Matheson (2012) argued that the formation of large dust grains produces obscuration without a significant reddening. This would explain the relatively blue colour of the post-outburst source, hence favouring the survival of the star. On the other hand, Adams & Kochanek (2015) reached a different conclusion, and argued that SN 1997bs was a faint SN explosion rather than a SN impostor, although they could not rule out a surviving star embedded in a dusty massive shell. Clearly, the controversial interpretation of the nature of SN 1997bs does not allow us to firmly constrain its progenitor.
Despite the large uncertainty on the information inferred for the LRN progenitors, a usual interpretation favours blue to yellow spectral type stars, although likely in a wide mass range. It is plausible that the erupting star is the primary member of a close, interacting binary system, although an outburst of a more massive single star cannot be definitely ruled out. The evolution of the binary system leading to double-peaked events will be further discussed in Sect. 5.3.
5.2. A continuum of properties from RNe to LRNe?
Known Galactic RNe from the sub-luminous V1309 Sco (Mason et al. 2010; Tylenda et al. 2011) to much brighter events such as V4332 Sgr (which erupted in 1994, Martini et al. 1999) and the famous V838 Mon (e.g., Munari et al. 2002), as well as extra-Galactic transients such as two well-studied RNe in M31 (M31−RV and M31−LRN2015). Although a number of authors proposed that RNe were peculiar thermonuclear-driven novae (e.g., Shara et al. 2010), they are usually interpreted as the result of the common envelope ejection and/or gravitational merging process in low to moderate mass systems (e.g. Soker & Tylenda 2003; Ivanova et al. 2013; Tylenda & Kamiński 2016; MacLeod et al. 2017). This will be discussed in Sect. 5.3.
Smith et al. (2016b) emphasized the similarity of NGC 4490−2011OT1 with RNe. Here we compare the observational properties of RNe and LRNe to eventually correlate their physical parameters and shed light on the nature of their progenitors. In particular, we measure the faintest pre-outburst detection of the progenitor (or its detection limit), from which we derive the bona fide absolute magnitude MV of the quiescent progenitors. Then, we estimate MV of the minor pre-outburst brightening, and those of the blue and the red peaks. The photometric parameters for all proposed merger candidates are reported in Table 3.
Main parameters of known merger candidates.
We note that the LRN (or RN) labelling was proposed in the past for two gap transients, M85−2006OT1 and V1148 Sgr. The classification of M85−2006OT1 as a peculiar RN was first proposed by Kulkarni et al. (2007). However, this was questioned by Pastorello et al. (2007) and Thompson et al. (2009), who noted similarities with SN 2008S-like transients and faint core-collapse SNe (see also Kochanek et al. 2014). In particular, observational arguments can be used to disfavour the RN/LRN classification. Firstly, the spectra of M85−2006OT1 show a quite prominent [Ca II] λλ 7291,7324 feature, which is typical of ILRTs, such as SN 2008S (Botticella et al. 2009). In addition, molecular bands have not been detected in the latest spectrum. The above spectroscopic properties support its classification as an ILRT (Kasliwal et al. 2011, and references therein). Hence, we will not further discuss this transient in the context of the merger candidates.
V1148 Sgr is another possible RN, although this claim is not supported by an accurate photometric monitoring. However, the spectrum described by Mayall (1949) is that of a K-type star, with strong H&K absorption lines along with possible TiO bands. A few days later, a prominent Hα was clearly detected. The description of the spectra closely matches the spectral appearance of double-peaked events, during their transition from the red light curve peak to very late phases (Fig. 13). For sake of completeness, the modest information available for this object is reported in Table 3.
In Fig. 14, we show the V-band absolute magnitudes of the quiescent progenitors of the objects of Table 3 vs. the absolute magnitudes of the pre-outburst brightening (top-right panel), the blue peak (bottom-left panel) and the red peak (bottom-right panel). Although this analysis may be affected by selection biases (e.g., RNe have not been detected in the Local Group), progenitor and outburst luminosities seems to be somewhat correlated, with more luminous quiescent progenitors are producing brightest outbursts20. This qualitative trend suggests that all outbursts of Table 3 may have been triggered by a similar mechanism.
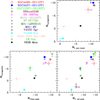 |
Fig. 14. Absolute V-band magnitudes of putatively quiescent progenitors of merger candidates vs. absolute V band magnitudes of brightest pre-outburst detection (top-right), blue peak (bottom-left) and red peak (bottom-right). The absolute magnitudes of the progenitor and the light-curve red peak of V4332 Sgr are indicated as lower limits, as only a lower limit is known for its distance (Table 3). |
The available B, V, R and I absolute light curves of our RN/LRN sample are compared in Fig. 15. Within the framework of the common envelope scenario, then the intrinsic photometric heterogeneity of the objects likely depends on the time of the common envelope ejection, the total mass of the binary system (Kochanek et al. 2014), and the mass ratio between the two stellar components. Assuming that the mass and luminosity of the quiescent progenitor system are correlated, the qualitative comparison in Fig. 14 also supports a major result of Kochanek et al. (2014), with higher mass systems producing more luminous outbursts. V4332 Sgr, OGLE-2002−BLG-360, and V1309 Sco are expected to arise from systems formed by low-mass (1−2 M⊙) stars, while the two RNe in M31 are likely associated to more massive binaries (3−6 M⊙, e.g., Lipunov et al. 2017; MacLeod et al. 2017)21, and V838 Mon was produced by an even more massive system, with a primary of 5−10 M⊙ (Tylenda et al. 2005). According to this view, the progenitor systems of the objects discussed in this paper are even more extreme, with the total mass likely being between 15 and 30 M⊙ (Smith et al. 2016b).
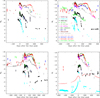 |
Fig. 15. B (top-left), V (top-right), R (bottom-left), and I-band (bottom-right) absolute light curves of merger candidates listed in Table 3. The approximate time of the common envelope ejection in the I-band light curve of V1309 Sco is also marked. |
5.3. Common envelope ejection and merger scenario for double-peaked transients
5.3.1. Current understanding of the red nova phenomenon
Although thermonuclear runaway (e.g., Iben & Tutukov 1992, for M31−RV), or post-asymptotic giant branch (AGB) He-shell flash scenarios (Munari et al. 2002; Kimeswenger et al. 2002) have been proposed in the past for RNe (see, also, Van Loon et al. 2004), there are growing evidences that these gap transients originate from binary stellar systems. In particular, while the initial decrease of the photospheric temperature is expected near to the outburst maxima, no thermonuclear models comfortably explain the very late-time temperature evolution of RNe towards cooler and cooler temperatures (Soker & Tylenda 2003).
Most massive stars exchange material with a binary companion during their life (about 70%, according to Sana et al. 2012), and this strongly affects the evolutionary path of the two components. This interaction may, in fact, change the relative masses and the spins of the two stars, and trigger mixing processes in the inner stellar layers, affecting their chemical evolution. In addition, a significant fraction of massive stars (up to one-fourth, Sana et al. 2012) are expected to merge. Hence, merging events are very likely common (Kochanek et al. 2014). For example, stellar mergers are a natural explanation for peculiar stars such as the blue stragglers (e.g., Perets & Fabrycky 2009; Naoz & Fabrycky 2014). This has been recently proposed by Ferreira et al. (2019) as the outcome of V1309 Sco. Other studies suggested that a large fraction of massive stars are the outcome of past merging events (de Mink et al. 2014). Ofek et al. (2008) set relatively high rates of stellar mergers in the Milky Way, providing a lower limit of 0.019 yr−1, later revised by Kochanek et al. (2014) who estimated a rate of about 0.5 yr−1 for events brighter than MV = −3 mag, and fading to ∼0.1 yr−1 for objects brighter than MV = −7 mag. For this reason, it is not surprising that we are finding a number of merger candidates in the Local Group. Two Galactic objects gave fundamental insight to our knowledge on RNe: V838 Mon and V1309 Sco.
Firstly, V838 Mon is one of the best-studied Galactic variables in the past decade. The variable lies in a young environment, with numerous hot stars, rich in gas and dust (Afşar & Bond 2007). A B-type companion was revealed by spectroscopy, and its wide separation makes implausible an active role in the V838 Mon outburst (see, Barsukova et al. 2017, and references therein). The luminosity of the progenitor system of V838 Mon remained approximately constant at a visual brightness of about 15.6 mag for over half a century, until early 199422 (Goranskij et al. 2004). Unfortunately, while after January 2002 the outburst was well monitored, the field was not targeted from March 1994 to December 2001, and the evolution of the source during this critical phase was not observed. Although a core stellar instability cannot be definitely ruled out, the merging model is favoured to explain the structured light curve of V838 Mon (e.g., Soker & Tylenda 2003). This scenario is also supported by new observational constraints from similar objects (see below). Thus, the progenitor stellar system of V838 Mon would be formed by three stars. Along with the detached B-type companion mentioned above, a close binary system formed by another blue star of a few M⊙ plus a lower-mass (a few × 10−1M⊙) companion likely produced the outburst.
When the primary inflated, filling its Roche lobe, mass flowed to the other star, with the system becoming dynamically unstable. Unfortunately, this phase was not directly observed in V838 Mon. However, with the loss of angular momentum, the orbital distance is expected to diminish, and a series of minor photometric oscillations superposed on a longer-term moderate brightening have likely occurred. The modulation of the light curve would be the consequence of subsequent passages of the secondary star to the periastron (Tylenda et al. 2005). This unobserved approaching phase was followed by a major encounter which partially disrupted the companion star and produced a luminous pre-outburst event reaching 10th mag in January 2002 (Munari et al. 2002). This model would explain the entire photometric evolution of V838 Mon.
Following Tylenda et al. (2005), Tylenda & Soker (2006), the primary star violently ejected the envelope producing an initial, low-luminosity light curve peak. Then, the secondary star accreted onto the primary component within the extended, common envelope. The complex merging process, along with ejecta-shell collisions, likely gave rise to the double-peaked light curve. This peculiar light curve shape is actually observed both in the Galactic comparison objects, and in more luminous extra-Galactic transients presented in this paper. The final outcome of this process was the production of a late-type star.
Secondly, V1309 Sco is another key object. It provided unequivocal proofs of the final merging event. This RN was monitored for a long period (and with high-cadence observations) before the outburst (Tylenda et al. 2011, see their Fig. 1), allowing us to directly observe the courtship dance of the two stars leading to the final coalescence. Its pre-outburst photometric evolution initially showed a slow trend of increasing luminosity (approximately from 2002 to mid-2007), which was probably due to increased mass loss that moved the photospheric radius (Pejcha et al. 2016b) outwards. The slow (but moderate) luminosity increase was characterized by frequent oscillations superposed to the main brightening trend. The period of these oscillations decreased with time following an exponential trend. This evolution was due to the inspiraling orbital motion (Tylenda et al. 2011) reducing the distance of the two stars, and an anisotropical obscuration of the binary from one direction (Pejcha et al. 2016a). During this phase, the mass-loss rate of the system increased progressively, settling onto a value of about 10−4M⊙ yr−1 (Pejcha 2014). Then, the light curve of V1309 Sco reached a minimum in late 2007 to early 2008, in coincidence with the disappearance of its short timescale variability (e.g., Pejcha et al. 2017). This can be explained with the expanding envelope progressively obscurating the binary system, with only the gas outflow remaining visible (Pejcha et al. 2016a), or with the formation of a dusty excretion disk (Tylenda et al. 2011; Nicholls et al. 2013). This feature in the V1309 Sco light curve is marked with a down-arrow in Fig. 15 (bottom-right panel). Later on, a steep luminosity rise was observed from March to late August 2008, without the unequivocal photometric modulations due to the relative motion of the two stars. This brightening was very likely due to an optically thick gas outflow from the primary star which enwrapped the secondary companion and produced a common envelope (Tylenda et al. 2011; Pejcha 2014). During this 5-months period, the mass-loss increased from about 10−3 to a few ×10−1M⊙ yr−1 (see Pejcha et al. 2017, their Fig. 5). Then, the huge brightening of ∼3.5 mag in less than two weeks is likely due to the final coalescence of the secondary star’s core onto the primary (see, also, Nandez et al. 2014). A similar photometric evolution of the outburst, although less densely sampled, was also observed in the RNe V4332 Sgr (Kimeswenger 2006) and M31−LRN2015 (Dong et al. 2015; MacLeod et al. 2017). In general, simulations of merger events show that the runaway orbital decay with escalating mass ejection followed by the stellar coalescence may produce a luminous transient flare with a duration similar to that of the binary orbital period (MacLeod et al. 2018).
We note that, while the arguments provided to support the merger scenario for V1309 Sco are robust, the physical mechanisms leading to the rapid stellar coalescence are still debated. The increasing mass loss rate from the primary through the outer Langrangian point (L2) may trigger the decrease of angular momentum (Pejcha et al. 2017). In this case, the formation of a circum-binary disc is expected. Alternatively, Nandez et al. (2014) propose the Darwin instability, with dissipation of orbital momentum to the rotation of the stellar components, as a primary responsible of the merging event. Finally, the presence of a third companion can lead a binary system to lose momentum, as suggested above for V838 Mon. However, the presence of a third star has been ruled out for V1309 Sco.
After the early blue peak, a plateau or a redder secondary peak is observed in RNe (see Fig. 15), followed by a steep luminosity decline, possibly accompanied by dust formation. The optical luminosity at very late phases can be significantly fainter than the integrated luminosity of the original binary system, and shows no evidence of modulation in the light curve (Nicholls et al. 2013). As mentioned in Sect. 4.2, signatures of dust formation are also observed in the late-time evolution of the luminous double-peaked events discussed in this paper (Blagorodnova et al. 2017; Smith et al. 2016b, see also Sect. 5.3.2).
Although the binary evolution described above is globally consistent with the observables of RNe before and after the main outburst, the process powering the light curve of the outburst with the characteristic double-peak is still debated. Barsukova et al. (2014) suggested that the most luminous, blue peak was produced by the strong, shock-induced photospheric heating triggered by the rapid coalescence process, while the broader red peak was due to the slow thermal energy release following the adiabatic expansion of the envelope. A reasonable explanation for the double peak is also provided by Lipunov et al. (2017) for M31−LRN2015. With the expansion, the temperature decreases and a cooling front eventually recombines the hydrogen envelope. This may produce a plateau-like photometric evolution after the blue peak or a shallow, longer-duration red peak. The presence of multiple H shells and a more complex density profile of the gas may complicate the scenario, generating a light curve with a more pronounced red maximum or even multiple peaks. However, as pointed out by MacLeod et al. (2017), the H recombination alone cannot explain the first, luminous and blue light curve peak.
Metzger & Pejcha (2017) modelled the whole RN evolution, proposing that the first peak was due to the release of thermal emission from hot gas, which is basically freely expanding in the polar direction23. The observed properties are somewhat similar to those produced by the cooling gas in core-collapse SNe, in particular the early blue peak of the light curve. The subsequent (quite heterogeneous) light curve evolution of RNe can be explained, according to Metzger & Pejcha (2017), in terms of interaction of the ejecta with lower-velocity equatorial wind, with the shock-heated material producing the second peak. The gas shell swept up by the shock front would generate a cool dense shell, consistent with the red colours observed after the second peak, and would be the ideal site for the rapid dust condensation observed in most of these transients. This explanation hence comfortably accomodates all the observables of both RNe and (very likely) their higher-luminosity counterparts.
The aspherical nature of RNe, inferred mostly by previous polarimetric and spectro-polarimetric observations (see, e.g., Kamiński & Tylenda 2013), has been recently confirmed by submillimetre observations of V4332 Sgr and V1309 Sco (Kamiński et al. 2018), that have unequivocally revealed the existence of bipolar molecular outflows resulting from the merger event.
5.3.2. Massive merger scenario for LRNe
Events brighter than V838 Mon (MV ∼ −10 mag) are rare, and have a Galactic rate of only 0.03 yr−1 (Kochanek et al. 2014), hence we expect that luminous transient events, like those presented in this paper, are extremely rare. In fact, Kochanek et al. (2014) estimate integral event rates of ∼1 to 5 × 10⁻³ yr−1 for events with MV ∼ −15 and −13 mag, respectively. Despite their rarity, the physical mechanisms producing luminous double-peaked outbursts are very likely the same as RNe. From an observational point of view, LRNe are in fact scaled-up clones of RNe (Sect. 5.2). In addition, signatures of the slow pre-outburst brightening that might be attributed to the orbital shrinkage have been observed in a few objects presented in this paper (see Sect. 5.3.1). We speculate that these brightenings can be related to the common envelope phase, in analogy with RNe.
– In NGC 4490−2011OT1, a modest brightening was observed in 2011 June-July, about 3 months before the blue peak. In this phase, the object was about 5 mag fainter than at the blue peak, but 3.5−4 mag brighter than the 1994 HST detection reported by Fraser et al. (2011) and Smith et al. (2016b).
– In SNhunt248, the pre-outburst phase was monitored with sparse observations over about 15 years before the blue peak. During this period, its R-band magnitude was variable, ranging from about 22.2 to 20.5 mag. The object significantly brightened ∼1.5 months before the blue peak, but remained ∼3.4 mag fainter than the peak (Fig. 3, bottom-right).
– In M 101−2015OT1, the Sloan r-band light curve remained below 21 mag until (at least) early 2008. From August 2009 to August 2014 the object showed a minor erratic photometric variability superposed to a general trend of slow luminosity increase (from r ∼ 20.5 to 19.6 mag). The brightest magnitude of the pre-outburst phase was reached about three months before the blue peak, like in NGC 4490−2011OT1.
Recent papers have proposed that LRNe are the consequence of common envelope ejections in relatively massive contact binary systems (e.g., Blagorodnova et al. 2017), likely followed by the stellar coalescence (Smith et al. 2016b; Mauerhan et al. 2018; Lipunov et al. 2017). Following this interpretation, we suggest that all transients analysed in this paper underwent a similar fate. The main differences with RNe are in the values of the parameters involved, with NGC 4490−2011OT-like transients having faster outflows, longer duration outbursts and higher luminosities. Furthermore, LRNe are likely produced by more massive binaries (Kochanek et al. 2014) than RNe. The typical range of systemic mass of the faintest RNe is in fact ∼1–5 M⊙, that of the intermediate-luminosity V838 Mon is 5−10 M⊙ (Munari et al. 2002; Tylenda et al. 2005), and in LRNe masses are likely up to a few tens of M⊙ (see Table 1 of Metzger & Pejcha 2017, and references therein).
At the highest-mass boundary, Smith (2009) proposed that the fluctuations visible in the 19th century light curve of the Giant Eruption (GE) of η Car were produced by periastron encounters of two stellar components (see, also, Mauerhan et al. 2018). The high luminosity of the GE, along with the high mass (over 10 M⊙, according to Smith et al. 2003) ejected during the event, are consistent with a very large systemic mass for η Car. The GE of η Car and the formation of the Homunculus Nebula have also been explained with a merger event of a massive (90 M⊙) close binary, triggered by the gravitational interaction of a 30 M⊙ companion (Portegies Zwart & van den Heuvel 2016).
Alternative explanations for double-peaked transients, explored for instance by Soker & Tylenda (2003), invoke other types of eruptive events from stars in a wide range of masses (AGBs to blue-to-yellow supergiants and hypergiants) or interacting systems where the common envelope ejections may prevent the merging event. However, these can not be easily reconciled with the peculiar light curve shape and the spectral evolution towards a late-type star. These similar observational properties link transients spanning an enormous range of luminosities (and, hence, masses), and are more comfortably explained with a common envelope ejection. Whether the final outcome of the binary interaction process in LRNe is a merger, or alternatively the system rearranges into a new stable binary configuration is still debated, and only late-time photometric observations - especially in the IR domain – may solve this puzzle.
5.4. Post-LRN evolution: a link with SN 2011ht-like events?
In this section, we explore a possible evolutionary channel for LRNe, inspired by their photometric similarity with the outburst (named UGC 5460−2010OT1) observed a few months before the explosion of the interacting SN 2011ht, and discussed by Fraser et al. (2013). The evolution of UGC 5460−2010OT1/SN 2011ht will be studied in detail in a forthcoming paper (Pastorello et al., in prep.).
For UGC 5460, we adopt a distance d = 17.9 Mpc (from the HyperLeda Virgo-corrected recessional velocity and a standard cosmology), hence μ = 31.26 ± 0.15 mag. The interstellar extinction within the host galaxy is negligible, as expected from the location of the object in the outskirts of UGC 5460, hence the modest total reddening is only due to the Milky Way contribution, E(B − V) = 0.01 mag (Fraser et al. 2013). The R-band absolute light curve comparison of UGC 5460−2010OT1 (plus SN 2011ht) with a sub-sample of the objects discussed in Sect. 3.2 is shown in Fig. 16. The data of UGC 5460−2010OT1 are from Fraser et al. (2013) and Ofek et al. (2014).
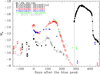 |
Fig. 16. Comparison of absolute light curves between a sample of LRNe and UGC 5460−2010OT1, precursor of SN 2011ht. The light curve of the SN is also shown (from Mauerhan et al. 2013, and Pastorello et al., in prep.). The phase is in days from the R-band blue peak. Only significant detection limits are shown for the different objects. The dot-dashed vertical line marks the epoch of the earliest available spectrum of SN 2011ht. |
The UGC 5460−2010OT1 outburst started about 300 days before the discovery of SN 2011ht. Although slightly fainter than the LRNe discussed in this paper, this event shares many photometric analogies with them. In particular, although UGC 5460−2010OT1 was poorly monitored and lacks precise colour information, we note an appealing similarity of its light curve with LRNe. Unfortunately, no spectrum was obtained during the UGC 5460−2010OT1 observational campaign to be compared with the spectra of our sample. The first spectrum of the source in UGC 5460 (whose epoch is marked with a vertical dot-dashed line in Fig. 16) was obtained at time of the putative SN explosion (Pastorello et al. 2011), during the early SN rising phase24. We note the similarity of this spectrum of SN 2011ht with those of the LRN NGC 4490−2009OT1 obtained at the red maximum (Fig. 17), suggesting similar properties of their circumstellar environments. In particular, the line velocities inferred from the position of the blueshifted absorption of Hα in the two spectra of Fig. 17 are comparable25, indicating that the wind outflows from the progenitor star (or progenitor’s binary system) occurred at nearly identical rates for the two transients.
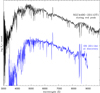 |
Fig. 17. Comparison of a spectrum of LRN NGC 4490−2009OT1 taken on 2011 December 21 (hence around red light curve peak) with classification spectrum of SN 2011ht obtained on 2011 September 30 (Pastorello et al. 2011). The SN 2011ht spectrum was taken at the early SN luminosity rise (∼−54 d from the V-band maximum), and before it showed the classical Type IIn spectral features. |
The circumstellar cocoon was likely produced by the UGC 5460−2010OT1 event, and was embedding the progenitor star at the time of the SN 2011ht discovery. The presence of high density surrounding material initially produced a spectrum similar to that of an intermediate-type hypergiant. It evolved towards that of a more classical SN IIn after a few days, when the SN 2011ht ejecta started the interaction with the CSM. Whether SN 2011ht was a genuine (but weak) interacting SN explosion, or it was the outcome of gas shell collisions produced in non-terminal outbursts is still an open issue. However, some clues favour the terminal SN explosion for SN 2011ht, including the late-time luminosity decline marginally consistent with the 56Co decay rate (Mauerhan et al. 2013; Smith 2013, see also below).
Proving a connection of UGC 5460−2010OT1/SN 2011ht with LRNe would have important implications to our understanding of these gap transients. Hence, two scenarios are proposed to explain the UGC 5460−2010OT1/SN 2011ht sequence of outbursts:
1. UGC 5460−2010OT1 as an eruption of a single massive star. The UGC 5460−2010OT1 event was interpreted by a number of authors (e.g., Mauerhan et al. 2013; Smith 2013; Fraser et al. 2013) as a major instability of a massive star approaching the core-collapse. The chain of events is either consistent with the outburst of a super-AGB star followed by an electron-capture SN explosion (Barkat 1971; Nomoto 1984; Wanajo et al. 2009; Pumo et al. 2009), or that of a more massive star (Mauerhan et al. 2013, with M > 25 M⊙), which ends its life as a fall-back SN (Woosley & Weaver 1995; Zampieri et al. 1998; Fryer 1999). In both cases, the outcome is expected to be a 56Ni-poor (10−3 to 10−2M⊙) core-collapse SN, whose ejecta interact with H-rich CSM, consistent with the observables of SN 2011ht (see, e.g., Smith 2013; Moriya et al. 2014; Chugai 2016). However, the above interpretations were questioned by Humphreys et al. (2012), who stated that the 2010 event was the initial manifestation of an eruptive phase lasting many months, then producing the shell-shell collision event known as SN 2011ht. Hence, according to the later interpretation, SN 2011ht was a non-terminal event. We note, however, that the existence of a remarkably homogeneous family of SN 2011ht-like events (sometimes dubbed SNe IIn-P)26 would favour a faint, 56Ni-poor SN scenario for all of them (Mauerhan et al. 2013).
2. UGC 5460−2010OT1 as a common envelope or a merging event in a binary system. As an alternative to the single-star eruption for UGC 5460−2010OT1 (followed by a possible SN explosion), one may propose a common envelope ejection scenario involving a massive binary system, eventually (although not necessarily) followed by a merging event. This is analogous to the scenario suggested for NGC 4490−2011OT1 and LRNe, with the main difference being that the merger producing UGC 5460−2010OT1 is followed a few months later by a much more luminous outburst, SN 2011ht. Again, SN 2011ht can be interpreted as a shell-shell collision event or as a terminal core-collapse SN. According to the latter interpretation, the primary star of the binary progenitor system of UGC 5460−2010OT1 would be an evolved massive star likely exploding as a SN soon after the binary interaction outburst or the coalescence27. A physical explanation for the UGC 5460−2010OT1 outburst as a LRN-like event would have important implications, and UGC 5460−2010OT1/SN 2011ht would become a reference object in predicting the latest evolution of massive binary systems.
Only a continued post-outburst monitoring will shed light to the final fate of LRN progenitors and, most importantly, if they will encounter a sequence of outbursts similar to those of the progenitor of UGC 5460−2010OT1/SN 2011ht. A sketch outlining the scenarios described above for double-peak transients and their possible evolutionary paths is in Fig. 18. Whether these predictions are realistic should be tested through detailed data modelling, post-outbursts follow-up and surveying known pre-merger candidates (Sect. 5.5).
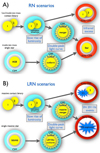 |
Fig. 18. Sketch showing possible evolutionary paths for RNe (top) and LRNe (bottom). Plausible scenarios for double-peak transients include eruptive phases of the evolution of moderate to high mass stars (with a shell ejection impacting pre-existing CSM), a common envelope ejection in a binary system formed by non-degenerate stars, and eventually (though not necessarily) a merging event with gas outflow interacting with a circumstellar shell. If the primary is an evolved high-mass star, a supergiant (SG) or an hypergiant (HG) with a MMS > 7−8 M⊙, or the resulting merger is massive enough, the final outcome may be a core-collapse SN explosion, likely similar to SN 2011ht. |
5.5. Chronicle of an embrace foretold
We have seen that a growing number of merger candidates are discovered and studied after the coalescence outburst. However, very little is known about their precursor systems. Contact eclipsing binaries such as TY Pup have been proposed as RN progenitor candidates (Sarotsakulchai et al. 2018). In this context, we should mention a couple of stellar systems which might merge in very short time scales (a few years).
KIC 9832227 is a complex stellar system formed by a contact binary with total mass of about 1.7 M⊙, with a mass ratio q ∼ 0.23, plus a possible very low-mass third component of ∼0.1 M⊙ (Molnar et al. 2017a). Calculations based on light curve information have predicted with a surprisingly high precision that the contact binary in KIC 9832227 should merge on year 2022.2 ± 0.6 (Molnar et al. 2015, 2017a,b). The coalescence involving low-mass stars is expected to generate a low-luminosity RN event, similar to V1309 Sco (Mason et al. 2010; Tylenda et al. 2011). We note, however, that the coalescence prediction of Molnar et al. has been questioned by a recent study (Socia et al. 2018).
On the other extreme of the mass/luminosity function, an approaching merging has been proposed for another stellar system, VFTS 352 in 30 Dor (in the Large Magellanic Cloud). It is formed by two O-type stars, and the two components have nearly identical masses (28−29 M⊙ each; Almeida et al. 2015). The most likely outcome for this system is a stellar merger producing a transient more luminous than a RN (Soker & Tylenda 2006). This is very similar to the scenario proposed by Smith et al. (2016a) for the LRN NGC 4490−2011OT1.
The different scenarios discussed in Sect. 5.4 can also be proposed for VFTS 352. If the chemical evolution of the binary remains homogeneous, the two stellar components would remain blue, luminous and compact, avoiding the coalescence but maintaining a fast rotation rate (de Mink et al. 2009). The two stars of the system are expected to individually evolve as WRs, finally exploding as stripped-envelope SNe, possibly generating a double black hole system (Almeida et al. 2015).
Alternatively, the outcome of the coalescence of the two VFTS 352 components might also be an initially fast-rotating massive star in a low-metallicity environment. The resulting star is expected to end its life producing a SN, possibly associated with a long gamma-ray burst (L-GRB, Yoon & Langer 2005; Woosley & Heger 2006); but see discussion in Almeida et al. (2015). However, if the merger embedded in a dense CSM also retains a significant fraction of its H envelope, this would produce a normal core-collapse SN without a L-GRB. In this case, the ejecta would interact with the H-rich CSM, likely producing an event similar to SN 2011ht (Mauerhan et al. 2013).
Although none of the NGC 4490−2011OT1-like objects presented in this paper has been followed so far by a SN explosion, long-duration, post-outburst photometric monitoring is necessary to verify if they will eventually produce an ejecta-CSM interacting SN like SN 2011ht in relatively short time scales.
6. Conclusions
We have presented new optical observations of a sample of LRNe showing a characteristic double-peaked light curve. Their intrinsic colours are very blue during the first peak, typically ranging from B − V ≈ 0−0.8 mag. The second peak has a much redder colour, with B − V ≈ 0.6–1.5 mag. The time span between the blue and red peaks depends on the filter considered, and is different among the objects of our sample, ranging from about 2.5 to over 4 months in the V band. During the blue peak, the spectra show a blue continuum and prominent Balmer lines in emission, with typical vFWHM of a few hundreds km s−1. During the red peak, the spectra become remarkably similar to those of a late-G to K star, with a redder continuum and a forest of metal lines, while H features are only barely detected. At late phases, molecular bands are shown by the optical spectra of at least four LRNe (NGC 4490−2011OT1, UGC 12307−2013OT1, M 101−2015OT1, and AT 2017jfs), in analogy to that observed in some Galactic RNe (V838 Mon, V4332 Sgr, and V1309 Sco). In contrast with the lower-mass stellar systems producing RNe, the progenitors of LRNe are likely massive binaries, although both RNe and LRNe are probably the consequence of a common envelope ejection plus a stellar merging event (Smith et al. 2016b; Blagorodnova et al. 2017; Mauerhan et al. 2018).
On the other hand, we have also found remarkable analogies between LRNe and UGC 5460−2010OT1, the outburst precursor of the Type IIn-P SN 2011ht: the double-peaked light curve, and the first spectrum of SN 2011ht closely resembles that of LRNe at the epoch of the red light curve peak. A pre-SN eruption followed by a core-collapse SN was a reasonable explanation proposed by a number of authors (e.g., Mauerhan et al. 2013), although others suggested that the whole cycle of UGC 5460−2010OT1/SN 2011ht variability was the display of a long-duration eruptive phase of a still-living massive star (Humphreys et al. 2012), with the SN IIn-P observables being consistent with circumstellar shell-shell interaction (as suggested by Dessart et al. 2009, for the Type IIn-P SN 1994W). We speculate that this striking similarity may connect UGC 5460−2010OT1 with LRNe, hence to a pre-SN merging event.
A massive star resulting from a merging event is predicted to explode with some delay with respect the lifetime of a single star with the same mass (Zapartas et al. 2017). For this reason, studying the stellar population in galaxies hosting LRNe is necessary to test the robustness of the merger channel proposed in this paper for massive stars. Combining an increased sample of LRNe with high-cadence photometric monitoring in the optical and IR domains, good resolution spectroscopy, and detailed studies of their environments is crucial to clarify the nature of LRNe, hence predicting their fate.
Although the acronym RNe is frequently used for “recurrent novae”, it will be adopted in this paper for discriminating dimmer red novae from their more luminous extra-galactic counterparts.
UT dates will be used throughout this paper.
http://crts.caltech.edu/; CRTS data can be obtained using the CRTS Data Release 3 (CSDR3) web service interface: http://crts.iucaa.in/CRTS/
M 66−1997OT1, according to the naming code adopted in this paper.
This object should be named as NGC 5806−2014OT1, adopting the naming code of this paper. However, we will maintain the SNhunt designation for this object, in agreement with other published papers.
We used reference star magnitudes available in the literature for the following objects: SN 1997bs (from Van Dyk et al. 2000), NGC 4490−2011OT1 (from Taubenberger et al. 2011b), SNhunt248 (from Kankare et al. 2015), and M 101−2015OT1 (from Blagorodnova et al. 2017).
An finder chart showing the field of AT 2017jfs is reported in Fig. A.1.
http://casu.ast.cam.ac.uk/casuadc/ingarch/query, maintained by the Cambridge Astronomical Survey Unit (CASU), which is part of the Institute of Astronomy, Cambridge University.
Although not securely identified, transitions due to V II may also affect the spectral continuum below about 3600 Å.
We note, however, that the narrow features are marginally resolved in our best resolution spectra, so these estimates are only indicative.
For this purpose, the bolometric light curve of NGC 4490−2011OT1 was computed from the quasi-bolometric light curve presented in Sect. 3.2 (calculated from the B to the I bands), applying a correction that accounts for the U-band and IR contributions. The correction was estimated using the bolometric data of M 101−2015OT1.
Very little information can be inferred from the third spectrum (2013 August 26) because of its poor S/N, and it is shown only for completeness.
This extinction value was estimated for the star nearest to the location of NGC 4490−2011OT1.
A promising correlation between peak luminosity of the outburst and the wind outflow velocity was found by Pejcha et al. (2016a) and Mauerhan et al. (2018).
A best-fit model obtained by Lipunov et al. (2017) using an adapted version of the radiative hydrodynamical STELLA code (Blinnikov et al. 2006), reproduced the light curve of M31−LRN 2015 through a merging event, in which the total merger’s mass was only 3 M⊙.
The S/N of these old observations on photographic plates and the accuracy of the light curve calibration do not allow us to support (neither to rule out) a photometric modulation during the monitoring period.
A polar gas outflow in RNe is supported by spectro-polarimetric observations (e.g., Kamiński & Tylenda 2013, for V4332 Sgr).
This remarkable spectrum, obtained on 2011 September 30, is to our knowledge the earliest available in the literature, 25 days before that shown by Mauerhan et al. (2013).
From the highest S/N spectrum of NGC 4490−2009OT1 obtained by Smith et al. (2016a) on 2012 January 19 (which is very close to the epoch of the red light curve peak), the core velocity of the blueshifted narrow absorption of Hα is about 400 km s−1, extended to 650 km s−1 for the blue edge. This value is consistent with the core velocity of the blueshifted absorption measured in our Echelle spectra of SN 2011ht (Pastorello et al. in prep.).
This subclass of SNe IIn, first defined by Mauerhan et al. (2013), is characterized by narrow P Cygni line spectra and optical light curves resembling those of SNe II-P, especially in the red-to-NIR bands. The group, along with SN 2011ht (Roming et al. 2012; Mauerhan et al. 2013) includes: SN 1994W (Sollerman et al. 1998; Chugai et al. 2004), SN 2005cl (Kiewe et al. 2012), and SN 2009kn (Kankare et al. 2012).
The evolutionary channel here discussed is somewhat similar to that proposed by a number of authors for the Type II SN 1987A (see Morris 2018, and references therein), although occurring in different time scales, as in that case the merging event occurred 20 000 years ago (Morris & Podsiadlowski 2007).
Acknowledgments
We dedicate this work to our friend Alex Dimai. His enthusiasm and competence will remain as a precious gift for those who had the priviledge of working with him. We thank the referee Elena Barsukova for the insightful comments that improved the manuscript. We are grateful to Marco Fiaschi for his observations at the Asiago Telescopes, Stefano Valenti and Mattias Ergon for their observations at ESO-La Silla, and Avet Harutyunyan for his support with the observations with TNG. We also acknowledge M. MacLeod and O. Pejcha for helpful discussions, and N. Blagorodnova for providing the data of M 101−2015OT1, and for useful suggestions. SB, LT, PO, MT, MTB are partially supported by the PRIN-INAF 2017 “Towards the SKA and CTA era: discovery, localisation and physics of transient sources” (PI M. Giroletti). NER acknowledges support from the Spanish MICINN grant ESP2017-82674-R and FEDER funds. YC is supported by the China Scholarship Council. KM is supported by STFC through an Ernest Rutherford Fellowship. ST is supported by TRR33 “The Dark Universe” of the German Research Foundation. SJS acknowledges funding from ERC Grant 291222 and STFC grant Grant Ref: ST/P000312/1. SGS, AJD, and the CRTS survey have been supported by the NSF grants AST-1313422, AST-1413600, and AST-1749235. KM acknowledges support from H2020 through an ERC Starting Grant (758638). Support for GP is provided by the Ministry of Economy, Development, and Tourism’s Millennium Science Initiative through grant IC120009, awarded to The Millennium Institute of Astrophysics, MAS. This article is based on observations made with the following facilities: the Italian Telescopio Nazionale Galileo operated on the island of La Palma by the Fundación Galileo Galilei of the INAF (Istituto Nazionale di Astrofisica) at the Spanish Observatorio del Roque de los Muchachos of the Instituto de Astrofísica de Canarias; the Nordic Optical Telescope, operated by the Nordic Optical Telescope Scientific Association at the Observatorio del Roque de los Muchachos, La Palma, Spain, of the Instituto de Astrofísica de Canarias; the William Herschel Telescope and the Isaac Newton Telescope, which are operated on the island of La Palma by the Isaac Newton Group of Telescopes in the Spanish Observatorio del Roque de los Muchachos of the Instituto de Astrofísica de Canarias; the Gran Telescopio Canarias, installed at the Spanish Observatorio del Roque de los Muchachos of the Instituto de Astrofísica de Canarias, in the island of La Palma; the Calar Alto 2.2 m Telescope of the Centro Astronómico Hispano-Alemán, Almería, Spain; the 1.93 m OHP telescope of the Observatoire de Haute-Provence; the 3.56 m New Technology Telescope and the Dutch 0.9 m telescopes at ESO-La Silla; the Copernico and the Schmidt telescopes (Asiago, Italy) of the INAF – Osservatorio Astronomico di Padova; the 8.4 m Large Binocular Telescope at Mt. Graham (Arizona, USA); the Southern Astrophysical Research (SOAR) telescope, which is a joint project of the Ministério da Ciência, Tecnologia, Inovaçãos e Comunicações do Brasil (MCTIC/LNA), the U.S. National Optical Astronomy Observatory (NOAO), the University of North Carolina at Chapel Hill (UNC), and Michigan State University (MSU); the Liverpool Telescope which is operated on the island of La Palma by Liverpool John Moores University in the Spanish Observatorio del Roque de los Muchachos of the Instituto de Astrofísica de Canarias with financial support from the UK Science and Technology Facilities Council; the 2 m Faulkes North Telescope of the Las Cumbres Observatory Global Telescope Network (LCOGTN). This paper used data obtained with the MODS spectrographs built with funding from NSF grant AST-9987045 and the NSF Telescope System Instrumentation Program (TSIP), with additional funds from the Ohio Board of Regents and the Ohio State University Office of Research. The LBT is an international collaboration among institutions in the United States, Italy and Germany. LBT Corporation partners are: The University of Arizona on behalf of the Arizona university system; Istituto Nazionale di Astrofisica, Italy; LBT Beteiligungsgesellschaft, Germany, representing the Max-Planck Society, the Astrophysical Institute Potsdam, and Heidelberg University; The Ohio State University, and The Research Corporation, on behalf of The University of Notre Dame, University of Minnesota and University of Virginia. This paper is also based on observations collected at the European Organisation for Astronomical Research in the Southern Hemisphere under ESO programmes 184.D-1140 and 184.D-1151. This research has made use of the NASA/ IPAC Infrared Science Archive, which is operated by the Jet Propulsion Laboratory, California Institute of Technology, under contract with the National Aeronautics and Space Administration. This research has also made use of the NASA/IPAC Extragalactic Database (NED) which is operated by the Jet Propulsion Laboratory, California Institute of Technology, under contract with the National Aeronautics and Space Administration. We acknowledge the usage of the HyperLeda database (http://leda.univ-lyon1.fr).
References
- Adams, S. M., & Kochanek, C. S. 2015, MNRAS, 452, 2195 [NASA ADS] [CrossRef] [Google Scholar]
- Afşar, M., & Bond, H. E. 2007, AJ, 113, 387 [NASA ADS] [CrossRef] [Google Scholar]
- Almeida, L. A., Sana, H., de Mink, S. E., et al. 2015, ApJ, 812, 102 [NASA ADS] [CrossRef] [Google Scholar]
- Armstrong, M., Singer, D., Burket, J., & Li, W. 2004, IAU Circ., 8335, 1 [NASA ADS] [Google Scholar]
- Banerjee, D. P. K., Su, K. Y. L., Misselt, K. A., et al. 2006, ApJ, 644, L57 [NASA ADS] [CrossRef] [Google Scholar]
- Banerjee, D. P. K., Nuth, III., J. A., Misselt, K. A., et al. 2015, ApJ, 814, 109 [NASA ADS] [CrossRef] [Google Scholar]
- Barkat, Z. 1971, ApJ, 163 [Google Scholar]
- Barsukova, E. A., Goranskij, V. P., Valeev, A. F., & Zharova, A. V. 2014, Astrophys. Bull., 69, 67 [NASA ADS] [CrossRef] [Google Scholar]
- Barsukova, E. A., Goranskij, V. P., & Valeev, A. F. 2017, ASPC, 510, 401 [NASA ADS] [Google Scholar]
- Berger, E., Soderberg, A. M., Chevalier, R. A., et al. 2009, ApJ, 699, 1850 [NASA ADS] [CrossRef] [Google Scholar]
- Blagorodnova, N., Kotak, R., Polshaw, J., et al. 2017, ApJ, 834, 107 [NASA ADS] [CrossRef] [Google Scholar]
- Blinnikov, S. I., Röpke, F. K., Sorokina, E. I., et al. 2006, A&A, 453, 229 [NASA ADS] [CrossRef] [EDP Sciences] [Google Scholar]
- Bond, H. E., Henden, A., Levay, Z. G., et al. 2003, Nature, 422, 405 [NASA ADS] [CrossRef] [PubMed] [Google Scholar]
- Bond, H. E. 2007, in The Nature of V838 Mon and Its Light Echo, eds. R. L. M. Corradi, & U. Munari, ASP Conf. Ser., 363, 130 [NASA ADS] [Google Scholar]
- Botticella, M. T., Pastorello, A., Smartt, S. J., et al. 2009, MNRAS, 398, 1041 [NASA ADS] [CrossRef] [Google Scholar]
- Boschi, F., & Munari, U. 2004, A&A, 418, 869 [NASA ADS] [CrossRef] [EDP Sciences] [Google Scholar]
- Cao, Y., Kasliwal, M. M., Chen, G., & Arcavi, I. 2015, A. Tel., 7070 [Google Scholar]
- Cappellaro, E. 2014, SNOoPy: a package for SN photometry, http://sngroup.oapd.inaf.it/snoopy.html [Google Scholar]
- Chornock, R., Filippenko, A. V., Li, W., et al. 2011, ApJ, 739, 41 [NASA ADS] [CrossRef] [Google Scholar]
- Chronis, T. S., & Gaskell, C. M. 2008, AJ, 135, 264 [NASA ADS] [CrossRef] [Google Scholar]
- Chugai, N. N. 2016, Astron. Lett., 42, 82 [NASA ADS] [CrossRef] [Google Scholar]
- Chugai, N. N., Blinnikov, S. I., Cumming, R. J., et al. 2004, MNRAS, 352, 1213 [NASA ADS] [CrossRef] [Google Scholar]
- Cortini, G., & Antonellini, S. 2011, CBET, 2789, 1 [NASA ADS] [Google Scholar]
- Crause, L. A., Lawson, W. A., Kilkenny, D., et al. 2003, MNRAS, 341, 785 [NASA ADS] [CrossRef] [Google Scholar]
- Crause, L. A., Lawson, W. A., Menzies, J. W., & Marang, F. 2005, MNRAS, 358, 1352 [NASA ADS] [CrossRef] [Google Scholar]
- de Mink, S. E., Cantiello, M., & Langer, N. 2009, A&A, 497, 243 [NASA ADS] [CrossRef] [EDP Sciences] [Google Scholar]
- de Mink, S. E., Sana, H., Langer, N., Izzard, R. G., & Schneider, F. R. N. 2014, ApJ, 782, 7 [NASA ADS] [CrossRef] [Google Scholar]
- Dessart, L., Hillier, D. J., Gezari, S., Basa, S., & Matheson, T. 2009, MNRAS, 394, 21 [NASA ADS] [CrossRef] [Google Scholar]
- Dong, S., Kochanek, C. S., Adams, S., & Prieto, J.-L. 2015, A. Tel., 7173 [Google Scholar]
- Drake, A. J., Catelan, M., Djorgovski, S. G., et al. 2013, ApJ, 763, 32 [NASA ADS] [CrossRef] [Google Scholar]
- Evans, A., Geballe, T. R., Rushton, M. T., et al. 2003, MNRAS, 343, 1054 [NASA ADS] [CrossRef] [Google Scholar]
- Exter, K. M., Cox, N. L. J., Swinyard, B. M., et al. 2016, A&A, 596, A96 [NASA ADS] [CrossRef] [EDP Sciences] [Google Scholar]
- Ferreira, T., Saito, R. K., Minniti, D., et al. 2019, MNRAS, 486, 1220 [NASA ADS] [CrossRef] [Google Scholar]
- Foley, R. J., Wong, D. S., Ganeshalingam, M., Filippenko, A. V., & Chornock, R. 2004, IAU Circ., 8339, 2 [NASA ADS] [Google Scholar]
- Fraser, M., Kotak, R., Magill, L., Smartt, S. J., & Pastorello, A. 2011, A. Tel., 3574 [Google Scholar]
- Fraser, M., Magee, M., Kotak, R., et al. 2013, ApJ, 779, L8 [NASA ADS] [CrossRef] [Google Scholar]
- Fryer, C. L. 1999, ApJ, 522, 413 [NASA ADS] [CrossRef] [Google Scholar]
- Gaia Collaboration (Prusti, T., et al.) 2016, A&A, 595, A1 [NASA ADS] [CrossRef] [EDP Sciences] [Google Scholar]
- Gaia Collaboration (Brown, A. G. A., et al.) 2018, A&A, 616, A1 [NASA ADS] [CrossRef] [EDP Sciences] [Google Scholar]
- Gerke, J., Adams, S. M., Kochanek, C. S., & Stanek, K. Z. 2015, A. Tel., 7069 [Google Scholar]
- Goranskij, V. P., & Barsukova, E. A. 2007, Astron. Rep., 51, 126 [NASA ADS] [CrossRef] [Google Scholar]
- Goranskij, V. P., Kusakin, A. V., Metlova, N. V., et al. 2002, Ast. Lett., 28, 691 [NASA ADS] [CrossRef] [Google Scholar]
- Goranskij, V. P., Shugarov, S. Y., Barsukova, E. A., & Kroll, P. 2004, IBVS, 5511 [Google Scholar]
- Goranskij, V. P., Barsukova, E. A., Spiridonova, O. I., et al. 2016, Astrophys. Bull., 71, 82 [NASA ADS] [CrossRef] [Google Scholar]
- Horiuchi, S., Beacom, J. F., Kochanek, C. S., et al. 2011, ApJ, 738, 154 [NASA ADS] [CrossRef] [Google Scholar]
- Howerton, S., Drake, A. J., Djorgovski, S. G., et al. 2011, CBET, 2637, 1 [NASA ADS] [Google Scholar]
- Humphreys, R. M., & Davidson, K. 1994, PASP, 106, 1025 [NASA ADS] [CrossRef] [Google Scholar]
- Humphreys, R. M., Davidson, K., Jones, T. J., et al. 2012, ApJ, 760, 93 [NASA ADS] [CrossRef] [Google Scholar]
- Humphreys, R. M., Davidson, K., Van Dyk, S. D., et al. 2017, ApJ, 848, 86 [NASA ADS] [CrossRef] [Google Scholar]
- Iben, Jr., I., & Tutukov, A. V. 1992, ApJ, 389, 369 [NASA ADS] [CrossRef] [Google Scholar]
- Ivanova, N., Justham, S., Avendano Nandez, J. L., & Lombardi, J. C. 2013, Science, 339, 433 [NASA ADS] [CrossRef] [Google Scholar]
- Jester, S., Schneider, D. P., Richards, G. T., et al. 2005, AJ, 130, 873 [NASA ADS] [CrossRef] [Google Scholar]
- Hajduk, M., Zijlstra, A. A., van Hoof, P. A. M., et al. 2007, MNRAS, 378, 1298 [NASA ADS] [CrossRef] [Google Scholar]
- Kamiński, T., & Tylenda, R. 2013, A&A, 558, A82 [NASA ADS] [CrossRef] [EDP Sciences] [Google Scholar]
- Kamiński, T., Schmidt, M., Tylenda, R., Konacki, M., & Gromadzki, M. 2009, ApJS, 182, 33 [NASA ADS] [CrossRef] [Google Scholar]
- Kamiński, T., Tylenda, R., & Deguchi, S. 2011, A&A, 529, A48 [NASA ADS] [CrossRef] [EDP Sciences] [Google Scholar]
- Kamiński, T., Mason, E., Tylenda, R., & Schmidt, M. R. 2015, A&A, 580, A34 [NASA ADS] [CrossRef] [EDP Sciences] [Google Scholar]
- Kamiński, T., Steffen, W., Tylenda, R., et al. 2018, A&A, 617, A129 [NASA ADS] [CrossRef] [EDP Sciences] [Google Scholar]
- Kankare, E., Ergon, M., Bufano, F., et al. 2012, MNRAS, 424, 855 [NASA ADS] [CrossRef] [Google Scholar]
- Kankare, E., Kotak, R., Pastorello, A., et al. 2015, A&A, 581, L4 [NASA ADS] [CrossRef] [EDP Sciences] [Google Scholar]
- Kasliwal, M. M. 2012, PASA, 29, 482 [NASA ADS] [CrossRef] [Google Scholar]
- Kasliwal, M. M., Kulkarni, S. R., Arcavi, I., et al. 2011, ApJ, 730, 134 [NASA ADS] [CrossRef] [Google Scholar]
- Kasliwal, M. M., Bally, J., Masci, F., et al. 2017, ApJ, 839, 88 [NASA ADS] [CrossRef] [EDP Sciences] [Google Scholar]
- Kiewe, M., Gal-Yam, A., Arcavi, I., et al. 2012, ApJ, 744, 10 [NASA ADS] [CrossRef] [Google Scholar]
- Kimeswenger, S. 2006, Astron. Nachr., 327, 44 [NASA ADS] [CrossRef] [Google Scholar]
- Kimeswenger, S., Lederle, C., Schmeja, S., & Armsdorfer, B. 2002, MNRAS, 336, L43 [NASA ADS] [CrossRef] [EDP Sciences] [Google Scholar]
- Kochanek, C. S. 2012, ApJ, 758, 142 [NASA ADS] [CrossRef] [Google Scholar]
- Kochanek, C. S., Adams, S. M., & Belczynski, K. 2014, MNRAS, 443, 1319 [NASA ADS] [CrossRef] [PubMed] [Google Scholar]
- Kulkarni, S. R., Ofek, E. O., Rau, A., et al. 2007, Nature, 447, 458 [Google Scholar]
- Kurtenkov, A., Pessev, P., Tomov, T., et al. 2015, A&A, 578, L10 [NASA ADS] [CrossRef] [EDP Sciences] [Google Scholar]
- Landolt, A. U. 1992, AJ, 104, 340 [NASA ADS] [CrossRef] [Google Scholar]
- Law, N. M., Kulkarni, S. R., Dekany, R. G., et al. 2009, PASP, 121, 1395 [NASA ADS] [CrossRef] [Google Scholar]
- Laher, R. R., Surace, J., Grillmair, C. J., et al. 2014, PASP, 126, 674 [NASA ADS] [Google Scholar]
- Li, W., Filippenko, A. V., Van Dyk, S. D., et al. 2002, PASP, 114, 403 [NASA ADS] [CrossRef] [Google Scholar]
- Lipunov, V. M., Blinnikov, S., Gorbovskoy, E., et al. 2017, MNRAS, 470, 2339 [NASA ADS] [CrossRef] [Google Scholar]
- LSST Science Collaboration (Abell, P. A., et al.) 2009, ArXiv eprints [arXiv:0912.0201] [Google Scholar]
- Magill, L., Kotak, R., Fraser, M., et al. 2011, CBET, 2789, 2 [NASA ADS] [Google Scholar]
- Martini, P., Wagner, R. M., Tomaney, A., et al. 1999, AJ, 119, 1034 [Google Scholar]
- Mason, E., Diaz, M., Williams, R. E., Preston, G., & Bensby, T. 2010, A&A, 516, A108 [NASA ADS] [CrossRef] [EDP Sciences] [Google Scholar]
- Maund, J. R., Smartt, S. J., Kudritzki, R.-P., et al. 2006, MNRAS, 369, 390 [NASA ADS] [CrossRef] [Google Scholar]
- Mauerhan, J. C., Smith, N., Silverman, J. M., et al. 2013, MNRAS, 431, 2599 [NASA ADS] [CrossRef] [Google Scholar]
- Mauerhan, J. C., Van Dyk, S. D., Graham, M. L., et al. 2015, MNRAS, 447, 1922 [NASA ADS] [CrossRef] [Google Scholar]
- Mauerhan, J. C., Van Dyk, S. D., Johansson, J., et al. 2018, MNRAS, 473, 3765 [NASA ADS] [CrossRef] [Google Scholar]
- Mayall, M. W. 1949, AJ, 54, 191 [NASA ADS] [CrossRef] [Google Scholar]
- MacLeod, M., Macias, P., Ramirez-Ruiz, E., et al. 2017, ApJ, 835, 282 [NASA ADS] [CrossRef] [Google Scholar]
- MacLeod, M., Ostriker, E. C., & Stone, J. M. 2018, ApJ, 868, 136 [NASA ADS] [CrossRef] [Google Scholar]
- Minniti, D. 1995, AJ, 109, 1663 [NASA ADS] [CrossRef] [Google Scholar]
- Metzger, B. D., & Pejcha, O. 2017, MNRAS, 471, 3200 [NASA ADS] [CrossRef] [Google Scholar]
- Molnar, L. A., Van Noord, D. M., Steenwyk, S. D., Spedden, C. J., & Kinemuchi, K. 2015, AAS Meeting, 225 [Google Scholar]
- Molnar, L. A., Van Noord, D. M., Kinemuchi, K., et al. 2017a, ApJ, 840, 1 [NASA ADS] [CrossRef] [Google Scholar]
- Molnar, L. A., Van Noord, D. M., Kinemuchi, K., et al. 2017b, AAS Meeting, 229 [Google Scholar]
- Moriya, T. J., Tominaga, N., Langer, N., et al. 2014, A&A, 569, A57 [NASA ADS] [CrossRef] [EDP Sciences] [Google Scholar]
- Morris, T. 2018, JAVSO, 46, 192 [NASA ADS] [Google Scholar]
- Morris, T., & Podsiadlowski, P. 2007, Science, 315, 1103 [NASA ADS] [CrossRef] [Google Scholar]
- Munari, U., Henden, A., Kiyota, S., et al. 2002, A&A, 389, L51 [NASA ADS] [CrossRef] [EDP Sciences] [Google Scholar]
- Munari, U., Henden, A., Vallenari, A., et al. 2005, A&A, 434, 1107 [NASA ADS] [CrossRef] [EDP Sciences] [Google Scholar]
- Nandez, J. L. A., Ivanova, N., & Lombardi, Jr., J. C. 2014, ApJ, 786, 39 [NASA ADS] [CrossRef] [Google Scholar]
- Nataf, D. M., Gould, A., Fouqué, P., et al. 2013, ApJ, 769, 88 [NASA ADS] [CrossRef] [Google Scholar]
- Naoz, S., & Fabrycky, D. C. 2014, ApJ, 793, 137 [NASA ADS] [CrossRef] [Google Scholar]
- Nicholls, C. P., Melis, C., Soszynski, I., et al. 2013, MNRAS, 431, L33 [NASA ADS] [CrossRef] [Google Scholar]
- Nomoto, K. 1984, ApJ, 277, 791 [NASA ADS] [CrossRef] [Google Scholar]
- Ofek, E. O., Kulkarni, S. R., Rau, A., et al. 2008, ApJ, 674, 447 [NASA ADS] [CrossRef] [Google Scholar]
- Ofek, E. O., Sullivan, M., Shaviv, N. J., et al. 2014, ApJ, 789, 104 [NASA ADS] [CrossRef] [Google Scholar]
- Özdönmez, A., Güver, T., Cabrera-Lavers, A., & Ak, T. 2016, MNRAS, 461, 1170 [Google Scholar]
- Pastorello, A., & Fraser, M. 2019, Nat. Astron., 3, 676 [NASA ADS] [CrossRef] [Google Scholar]
- Pastorello, A., Della Valle, M., Smartt, S. J., et al. 2007, Nature, 449, 1 [Google Scholar]
- Pastorello, A., Kasliwal, M. M., Crockett, R. M., et al. 2008, MNRAS, 389, 955 [NASA ADS] [CrossRef] [Google Scholar]
- Pastorello, A., Botticella, M. T., Trundle, C., et al. 2010, MNRAS, 408, 181 [NASA ADS] [CrossRef] [Google Scholar]
- Pastorello, A., Stanishev, V., Smartt, S. J., Fraser, M., & Lindborg, M. 2011, CBET, 2851, 2 [NASA ADS] [Google Scholar]
- Pastorello, A., Pumo, M. L., Navasardyan, H., et al. 2012, A&A, 537, A141 [NASA ADS] [CrossRef] [EDP Sciences] [Google Scholar]
- Pastorello, A., Cappellaro, E., Inserra, C., et al. 2013, ApJ, 767, 1 [NASA ADS] [CrossRef] [Google Scholar]
- Pastorello, A., Chen, T.-W., Cai, Y.-Z., et al. 2019, A&A, 625, L8 [NASA ADS] [CrossRef] [EDP Sciences] [Google Scholar]
- Pejcha, O. 2014, ApJ, 788, 22 [NASA ADS] [CrossRef] [Google Scholar]
- Pejcha, O., Metzger, B. D., & Tomida, K. 2016a, MNRAS, 455, 4351 [NASA ADS] [CrossRef] [Google Scholar]
- Pejcha, O., Metzger, B. D., & Tomida, K. 2016b, MNRAS, 461, 2539 [Google Scholar]
- Pejcha, O., Metzger, B. D., Tyles, B. D., & Tomida, K. 2017, MNRAS, 471, 3200 [NASA ADS] [CrossRef] [Google Scholar]
- Perets, H. B., & Fabrycky, D. C. 2009, ApJ, 697, 1048 [NASA ADS] [CrossRef] [Google Scholar]
- Pietrukowicz, P., Soszyński, I., Udalski, A., et al. 2017, Acta Astron., 67, 115 [NASA ADS] [Google Scholar]
- Portegies Zwart, S. F., & van den Heuvel, E. P. J. 2016, MNRAS, 456, 3401 [NASA ADS] [CrossRef] [Google Scholar]
- Pumo, M. L., Turatto, M., Botticella, M. T., et al. 2009, ApJ, 705, L138 [NASA ADS] [CrossRef] [Google Scholar]
- Roming, P. W. A., Pritchard, T. A., Brown, P. J., et al. 2009, ApJ, 704, L118 [NASA ADS] [CrossRef] [Google Scholar]
- Roming, P. W. A., Pritchard, T. A., Prieto, J. L., et al. 2012, ApJ, 751, 92 [NASA ADS] [CrossRef] [Google Scholar]
- Sarotsakulchai, T., Quian, S.-B., Soonthornthum, B., et al. 2018, AJ, 156, 199 [NASA ADS] [CrossRef] [Google Scholar]
- Schlafly, E. F., & Finkbeiner, D. 2011, ApJ, 737, 103 [NASA ADS] [CrossRef] [Google Scholar]
- Shara, M. M., Moffat, A. F. J., & Webbink, R. F. 1985, ApJ, 294, 271 [NASA ADS] [CrossRef] [Google Scholar]
- Shara, M. M., Yaron, O., Prialnik, D., Kovetz, A., & Zurek, D. 2010, ApJ, 725, 831 [NASA ADS] [CrossRef] [Google Scholar]
- Shappee, B. J., & Stanek, K. Z. 2011, ApJ, 733, 124 [NASA ADS] [CrossRef] [Google Scholar]
- Smith, N. 2013, MNRAS, 434, 102 [NASA ADS] [CrossRef] [Google Scholar]
- Smith, N. 2009, MNRAS, 415 [Google Scholar]
- Smith, N., Gehrz, R. D., Hinz, P. M., et al. 2003, AJ, 125, 1458 [NASA ADS] [CrossRef] [Google Scholar]
- Smith, N., Li, W., Silverman, J. M., Ganeshalingam, M., & Filippenko, A. V. 2011, MNRAS, 415, 773 [NASA ADS] [CrossRef] [Google Scholar]
- Smith, N., Andrews, J. E., Mauerhan, J. C., et al. 2016a, MNRAS, 455, 3546 [NASA ADS] [CrossRef] [Google Scholar]
- Smith, N., Andrews, J. E., Van Dyk, S. D., et al. 2016b, MNRAS, 458, 950 [NASA ADS] [CrossRef] [Google Scholar]
- Sana, H., de Mink, S. E., de Koter, A., et al. 2012, Science, 337, 444 [Google Scholar]
- Socia, Q. J., Welsh, W. F., Short, D. R., et al. 2018, ApJ, 864, L32 [NASA ADS] [CrossRef] [Google Scholar]
- Soker, N., & Kashi, A. 2012, ApJ, 746, 100 [NASA ADS] [CrossRef] [Google Scholar]
- Soker, N., & Tylenda, R. 2003, ApJ, 582, L105 [NASA ADS] [CrossRef] [Google Scholar]
- Soker, N., & Tylenda, R. 2006, MNRAS, 373, 733 [NASA ADS] [CrossRef] [Google Scholar]
- Sollerman, J., Cumming, R. J., & Lundqvist, P. 1998, ApJ, 493, 933 [NASA ADS] [CrossRef] [Google Scholar]
- Sorce, J. G., Tully, R. B., Courtois, H. M., et al. 2014, MNRAS, 444, 527 [Google Scholar]
- Sparks, W. B., Bond, H. E., Cracraft, M., et al. 2008, AJ, 135, 605 [NASA ADS] [CrossRef] [Google Scholar]
- Spergel, D., Gehrels, N., Baltay, C., et al. 2015, ArXiv e-prints [arXiv:1503.03757] [Google Scholar]
- Tartaglia, L., Pastorello, A., Taubenberger, S., et al. 2015, MNRAS, 447, 117 [NASA ADS] [CrossRef] [Google Scholar]
- Tartaglia, L., Elias-Rosa, N., Pastorello, A., et al. 2016, ApJ, 836, L12 [Google Scholar]
- Taubenberger, S., Pastorello, A., Elias-Rosa, N., Benetti, S., & Bufano, F. 2011a, CBET, 2637, 3 [NASA ADS] [Google Scholar]
- Taubenberger, S., Navasardyan, H., Maurer, J. I., et al. 2011b, MNRAS, 413, 2140 [NASA ADS] [CrossRef] [Google Scholar]
- Thompson, T. A., Prieto, J. L., Stanek, K. Z., et al. 2009, ApJ, 705, 1364 [NASA ADS] [CrossRef] [Google Scholar]
- Tsvetkov, D. Y. 1988, PZ, 22, 653 [NASA ADS] [Google Scholar]
- Tsvetkov, D. Y., Volkov, I. M., Baklanov, P., Blinnikov, S., & Tuchin, O. 2009, Peremenn. Zvezd., 29, 2 [NASA ADS] [Google Scholar]
- Tully, R. B., Rizzi, L., Shaya, E. J., et al. 2009, AJ, 138, 323 [NASA ADS] [CrossRef] [Google Scholar]
- Tylenda, R. 2004, A&A, 414, 223 [NASA ADS] [CrossRef] [EDP Sciences] [Google Scholar]
- Tylenda, R., & Soker, N. 2006, A&A, 451, 223 [NASA ADS] [CrossRef] [EDP Sciences] [Google Scholar]
- Tylenda, R., & Kamiński, T. 2016, A&A, 592, A134 [NASA ADS] [CrossRef] [EDP Sciences] [Google Scholar]
- Tylenda, R., Soker, N., & Szczerba, R. 2005, A&A, 441, 1099 [NASA ADS] [CrossRef] [EDP Sciences] [Google Scholar]
- Tylenda, R., Hajduk, M., Kamiński, T., et al. 2011, A&A, 528, A114 [NASA ADS] [CrossRef] [EDP Sciences] [Google Scholar]
- Tylenda, R., Kamiński, T., Udalski, A., et al. 2013, A&A, 555, A16 [NASA ADS] [CrossRef] [EDP Sciences] [Google Scholar]
- Tylenda, R., Górny, S. K., Kamiński, T., & Schmidt, M. 2015, A&A, 578, A75 [NASA ADS] [CrossRef] [EDP Sciences] [Google Scholar]
- Van Dyk, S. D., & Matheson, T. 2012, in Eta Carinae and the Supernova Impostors, eds. K.Davidson, & R. M.Humphreys, Astrophys. Space Sci. Libr., 384 (New York: Springer-Verlag), 249 [NASA ADS] [CrossRef] [Google Scholar]
- Van Dyk, S. D., Peng, C. Y., Barth, A. J., & Filippenko, A. V. 1999, AJ, 118, 2331 [NASA ADS] [CrossRef] [Google Scholar]
- Van Dyk, S. D., Peng, C. Y., King, J. Y., et al. 2000, PASP, 112, 1532 [NASA ADS] [CrossRef] [Google Scholar]
- Van Loon, J. T., Evans, A., Rushton, M. T., & Smalley, B. 2004, A&A, 427, 193 [NASA ADS] [CrossRef] [EDP Sciences] [Google Scholar]
- Vinko, J., Wheeler, J. C., Chatzopoulos, E., & Caldwell, J. 2011, CBET, 2637, 2 [NASA ADS] [Google Scholar]
- Walborn, N. R., Gamen, R. C., Morrell, N. I., et al. 2017, AJ, 154, 15 [NASA ADS] [CrossRef] [Google Scholar]
- Walter, F. M., Battisti, A., Towers, S. E., Bond, H. E., & Stringfellow, G. S. 2012, PASP, 124, 1057 [NASA ADS] [CrossRef] [Google Scholar]
- Wagner, R. M., Vrba, F. J., Henden, A. A., et al. 2004, PASP, 116, 326 [NASA ADS] [CrossRef] [Google Scholar]
- Wanajo, S., Nomoto, K., Janka, H.-T., Kitaura, F. S., & Müller, B. 2009, ApJ, 695, 208 [NASA ADS] [CrossRef] [Google Scholar]
- Weis, K., & Bomans, D. J. 2005, A&A, 429, L12 [NASA ADS] [CrossRef] [EDP Sciences] [Google Scholar]
- Wisniewski, J. P., Clampin, M., Bjorkman, K. S., & Barry, R. K. 2008, ApJ, 863, L171 [NASA ADS] [CrossRef] [Google Scholar]
- Williams, S. C., Darnley, M. J., Bode, M. F., & Steele, I. A. 2015, ApJ, 805, L18 [NASA ADS] [CrossRef] [Google Scholar]
- Woosley, S., & Weaver, T. A. 1995, ApJS, 101, 181 [NASA ADS] [CrossRef] [Google Scholar]
- Woosley, S., & Heger, A. 2006, ApJ, 637, 914 [NASA ADS] [CrossRef] [Google Scholar]
- Yoon, S.-C., & Langer, N. 2005, A&A, 443, 643 [NASA ADS] [CrossRef] [EDP Sciences] [Google Scholar]
- Zampieri, L., Colpi, M., Shapiro, S. L., & Wasserman, I. 1998, ApJ, 505, 876 [NASA ADS] [CrossRef] [Google Scholar]
- Zapartas, E., de Mink, S. E., Izzard, R. G., et al. 2017, A&A, 601, A29 [NASA ADS] [CrossRef] [EDP Sciences] [Google Scholar]
Appendix A: Supplementary figure
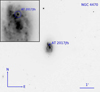 |
Fig. A.1. Finder chart of reference LRN AT 2017jfs in NGC 4470, published in Pastorello et al. (2019). The Sloan r-band image was obtained on 2018 May 19 with the NOT telescope, equipped with ALFOSC. |
All Tables
Log of spectroscopic observations of NGC 4490−2011OT1, NGC 3437−2011OT1, and UGC 12307−2013OT1.
All Figures
|
Fig. 1. Top-left: NGC 4490−2011OT1 in its host galaxy. The R-band image was obtained on 2012 March 24 with the 2.2 m telescope of the Calar Alto Observatory, equipped with CAFOS. Top-right: NGC 3437−2011OT1 and its host galaxy. The R-band image was obtained on 2011 January 15 with the 2.2 m telescope of the Calar Alto Observatory, with CAFOS. A blow-up showing the transient is in the upper-left inset. Middle-left: UGC 12307−2013OT1 and its host galaxy. The R-band image was obtained on 2013 October 11 with the 3.58 m Telescopio Nazionale Galileo, equipped with LRS. A blow-up with the transient is shown in the upper-left inset. Middle-right: SN 1997bs in NGC 3627. The R-band image was obtained on 1997 April 27 with the 0.91 m Dutch Telescope at ESO – La Silla. Bottom-left: M 101−2015OT1 in the outskirts of its host galaxy. The Sloan-r band image was obtained on 2015 February 18 with the 1.82 m Asiago Copernico Telescope plus AFOSC. Bottom-right: SNhunt248 in NGC 5806. The AFOSC image in the Sloan-r band was obtained on 2014 July 18. |
| In the text | |
|
Fig. 2. R-band images of the location of NGC 4490−2011OT1 at six representative epochs. The field of view is 1.5′. |
| In the text | |
|
Fig. 3. Multi-band light curves of NGC 4490−2011OT1 (top-left), NGC 3437−2011OT1 (top-right), UGC 12307−2013OT1 (middle-left), SN 1997bs (middle-right), M 101−2015OT1 (bottom-left), and SNhunt248 (bottom-right). Empty symbols in the SN 1997bs, M 101−2015OT1 and SNhunt248 light curves are data from the literature (see text). Only the most significant detection limits are shown. All data are calibrated in the Vega system. |
| In the text | |
|
Fig. 4. Colour evolution for our sample of LRNe. The phase is in days from the first V band maximum. For UGC 12307−2013OT1, we tentatively adopted JD = 2 456 350 as epoch of the first peak. The dot-dashed vertical lines (plotted maintaining the same colour codes as the symbols) mark the epochs of the red maximum for the different objects. In SN 1997bs, the red maximum was not observed. The B − V colour curve of AT 2017jfs (Pastorello et al. 2019) is also shown as a comparison (solid line). |
| In the text | |
|
Fig. 5. Pseudo-bolometric (optical) light curves for six LRNe presented in this paper. The phase is in days from the first peak. AT 2017jfs data (solid line) are from Pastorello et al. (2019). |
| In the text | |
|
Fig. 6. Long-term photometric monitoring (specifically, V-band absolute magnitudes) for extra-Galactic LRNe discussed in this paper, covering about a decade of their evolution. Pre- and post-discovery detection limits are indicated with “down-arrow” symbols. The phase is in days from the first (blue) peak in the V band. The absolute light curves of LRN outbursts are compared in detail in Sect. 5.2. |
| In the text | |
|
Fig. 7. Top: spectral evolution of NGC 4490−2011OT1. Bottom-left: spectra of NGC 3437−2011OT1 shown with those of SN 2007bs available in the literature (Van Dyk et al. 2000; Tartaglia et al. 2015). Bottom-right: spectral evolution of UGC 12307−2013OT1 during and after the red light-curve peak. A low S/N SOAR spectrum of UGC 12307−2013OT1 obtained on 2013 August 26 is shown for completeness. |
| In the text | |
|
Fig. 8. Detail of region 4250−5450 Å for selected LRN spectra presented in this paper. Left: early-time LRN spectra, obtained during the first luminosity peak. Right: LRN spectra during the second, red peak. The vertical dot-dashed lines mark the rest wavelengths of Hβ and Hγ. |
| In the text | |
|
Fig. 9. Left panels: spectral evolution of NGC 4490−2011OT1, with only higher S/N spectra shown. Right panels: evolution of Hα in velocity space. The spectra obtained at the blue peak are shown in the top panels, those obtained at the red peak are in the middle panels, and the late spectra are in the bottom panels. The spectra were reported to the rest frame applying a Doppler correction (the redshift z = 0.002265 is determined from a nearby H II region, and was corrected accounting for the heliocentric velocity); no reddening correction was applied to the spectra. |
| In the text | |
|
Fig. 10. Line identification in two spectra of NGC 4490−2011OT1, at the first (top) and the second peaks (bottom). |
| In the text | |
|
Fig. 11. Blow-up of selected spectral windows in two spectra of NGC 4490−2011OT1, at first peak (top panels) and during second maximum (bottom panels). The regions at 4750–5350 Å (left panels), 5800–5950 Å (middle panels) and 8300–8800 Å (right panels) are shown. The positions marked in the bottom panels are those of the P Cygni minima, obtained assuming an average expansion velocity of 300 km s−1 (see text). The position of He I λ5876 is also marked, although that feature is not clearly detected. |
| In the text | |
|
Fig. 12. Evolution of the bolometric, optical (BVRI) and Hα luminosities (top panel), continuum temperature (middle panel) and photospheric radius (bottom panel) in our spectra of NGC 4490−2011OT1. A conservative error of 500 K is estimated for the blackbody continuum temperature. |
| In the text | |
|
Fig. 13. Detection of molecules in late spectra of NGC 4490−2011OT1, UGC 12307−2013OT1 and M 101−2015OT1 (Blagorodnova et al. 2017), and comparison with late spectra of RNe V838 Mon (Kamiński et al. 2009) and V1309 Sco (Mason et al. 2010). Hα and Hβ are excised in the spectrum of V838 Mon to emphasize the broad molecular absorption bands. |
| In the text | |
|
Fig. 14. Absolute V-band magnitudes of putatively quiescent progenitors of merger candidates vs. absolute V band magnitudes of brightest pre-outburst detection (top-right), blue peak (bottom-left) and red peak (bottom-right). The absolute magnitudes of the progenitor and the light-curve red peak of V4332 Sgr are indicated as lower limits, as only a lower limit is known for its distance (Table 3). |
| In the text | |
|
Fig. 15. B (top-left), V (top-right), R (bottom-left), and I-band (bottom-right) absolute light curves of merger candidates listed in Table 3. The approximate time of the common envelope ejection in the I-band light curve of V1309 Sco is also marked. |
| In the text | |
|
Fig. 16. Comparison of absolute light curves between a sample of LRNe and UGC 5460−2010OT1, precursor of SN 2011ht. The light curve of the SN is also shown (from Mauerhan et al. 2013, and Pastorello et al., in prep.). The phase is in days from the R-band blue peak. Only significant detection limits are shown for the different objects. The dot-dashed vertical line marks the epoch of the earliest available spectrum of SN 2011ht. |
| In the text | |
|
Fig. 17. Comparison of a spectrum of LRN NGC 4490−2009OT1 taken on 2011 December 21 (hence around red light curve peak) with classification spectrum of SN 2011ht obtained on 2011 September 30 (Pastorello et al. 2011). The SN 2011ht spectrum was taken at the early SN luminosity rise (∼−54 d from the V-band maximum), and before it showed the classical Type IIn spectral features. |
| In the text | |
|
Fig. 18. Sketch showing possible evolutionary paths for RNe (top) and LRNe (bottom). Plausible scenarios for double-peak transients include eruptive phases of the evolution of moderate to high mass stars (with a shell ejection impacting pre-existing CSM), a common envelope ejection in a binary system formed by non-degenerate stars, and eventually (though not necessarily) a merging event with gas outflow interacting with a circumstellar shell. If the primary is an evolved high-mass star, a supergiant (SG) or an hypergiant (HG) with a MMS > 7−8 M⊙, or the resulting merger is massive enough, the final outcome may be a core-collapse SN explosion, likely similar to SN 2011ht. |
| In the text | |
|
Fig. A.1. Finder chart of reference LRN AT 2017jfs in NGC 4470, published in Pastorello et al. (2019). The Sloan r-band image was obtained on 2018 May 19 with the NOT telescope, equipped with ALFOSC. |
| In the text | |
Current usage metrics show cumulative count of Article Views (full-text article views including HTML views, PDF and ePub downloads, according to the available data) and Abstracts Views on Vision4Press platform.
Data correspond to usage on the plateform after 2015. The current usage metrics is available 48-96 hours after online publication and is updated daily on week days.
Initial download of the metrics may take a while.