Fig. 16.
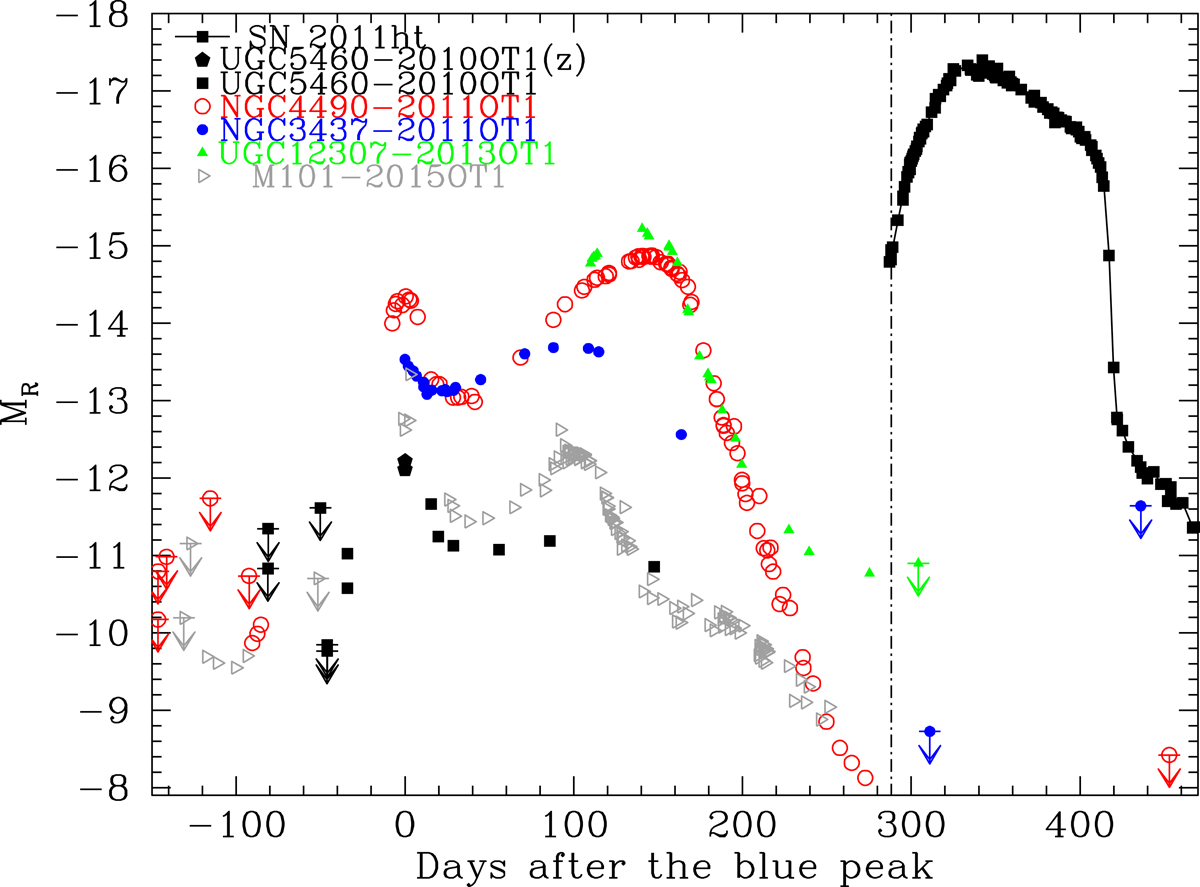
Comparison of absolute light curves between a sample of LRNe and UGC 5460−2010OT1, precursor of SN 2011ht. The light curve of the SN is also shown (from Mauerhan et al. 2013, and Pastorello et al., in prep.). The phase is in days from the R-band blue peak. Only significant detection limits are shown for the different objects. The dot-dashed vertical line marks the epoch of the earliest available spectrum of SN 2011ht.
Current usage metrics show cumulative count of Article Views (full-text article views including HTML views, PDF and ePub downloads, according to the available data) and Abstracts Views on Vision4Press platform.
Data correspond to usage on the plateform after 2015. The current usage metrics is available 48-96 hours after online publication and is updated daily on week days.
Initial download of the metrics may take a while.