Fig. 9.
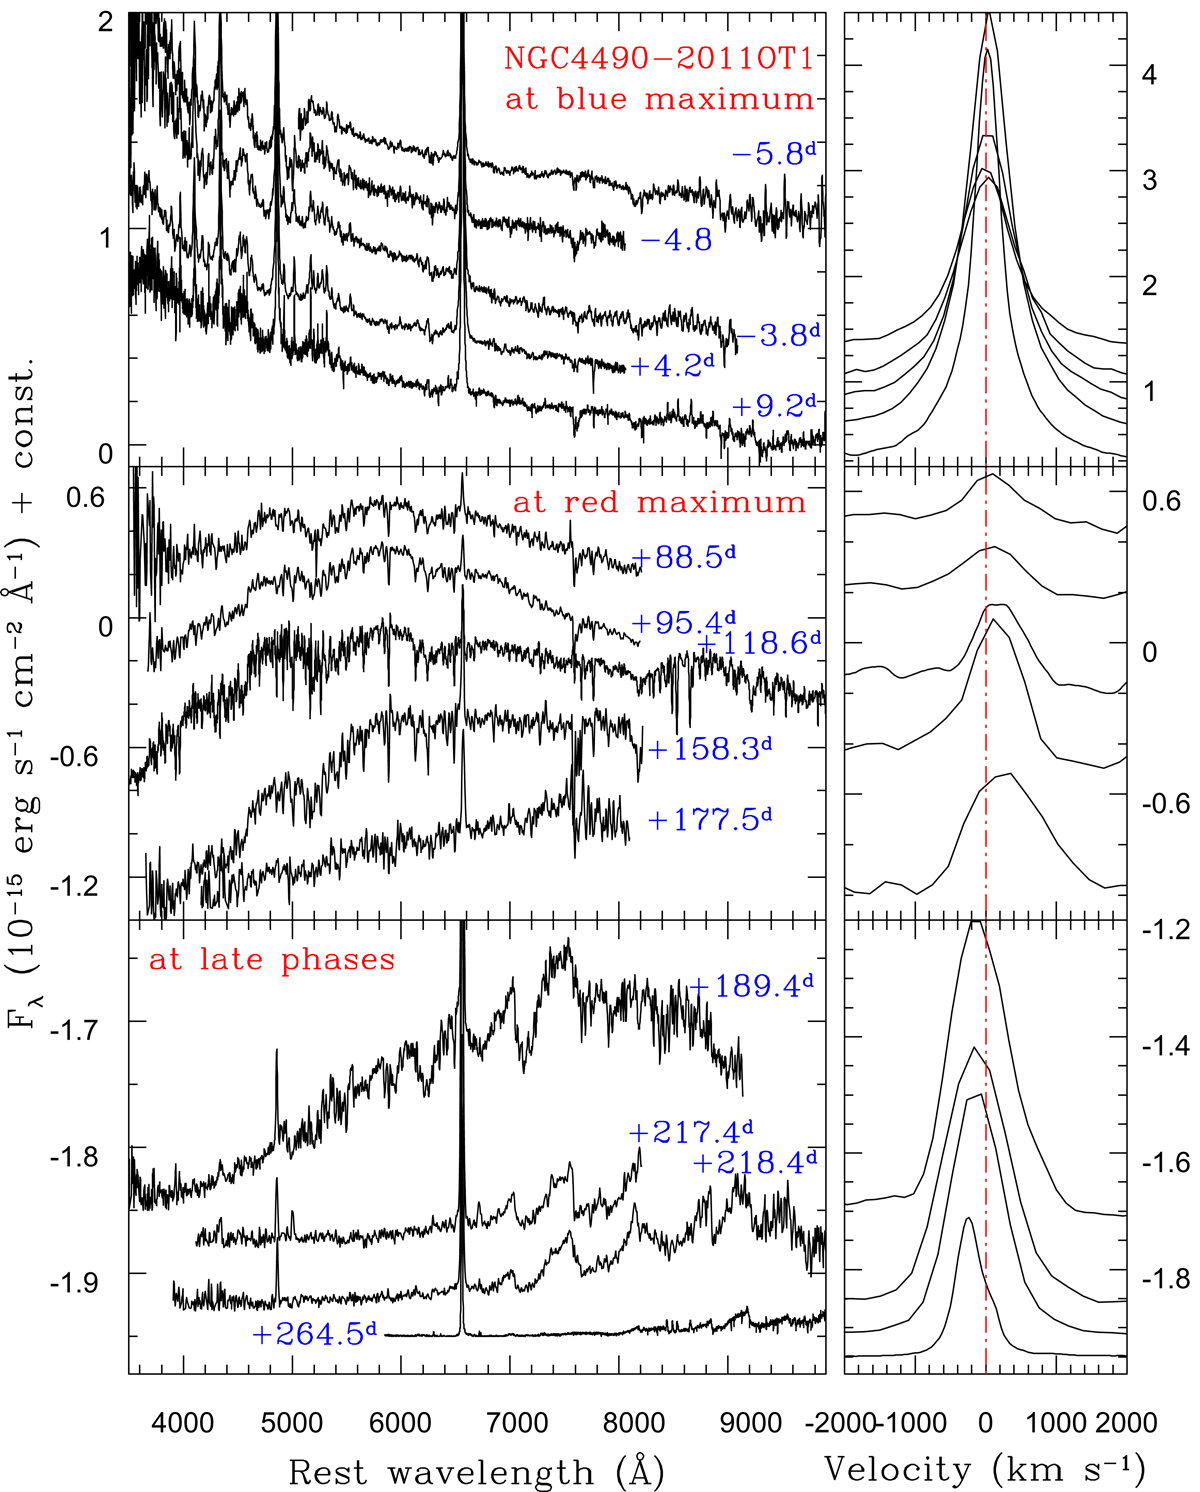
Left panels: spectral evolution of NGC 4490−2011OT1, with only higher S/N spectra shown. Right panels: evolution of Hα in velocity space. The spectra obtained at the blue peak are shown in the top panels, those obtained at the red peak are in the middle panels, and the late spectra are in the bottom panels. The spectra were reported to the rest frame applying a Doppler correction (the redshift z = 0.002265 is determined from a nearby H II region, and was corrected accounting for the heliocentric velocity); no reddening correction was applied to the spectra.
Current usage metrics show cumulative count of Article Views (full-text article views including HTML views, PDF and ePub downloads, according to the available data) and Abstracts Views on Vision4Press platform.
Data correspond to usage on the plateform after 2015. The current usage metrics is available 48-96 hours after online publication and is updated daily on week days.
Initial download of the metrics may take a while.