Fig. 4.
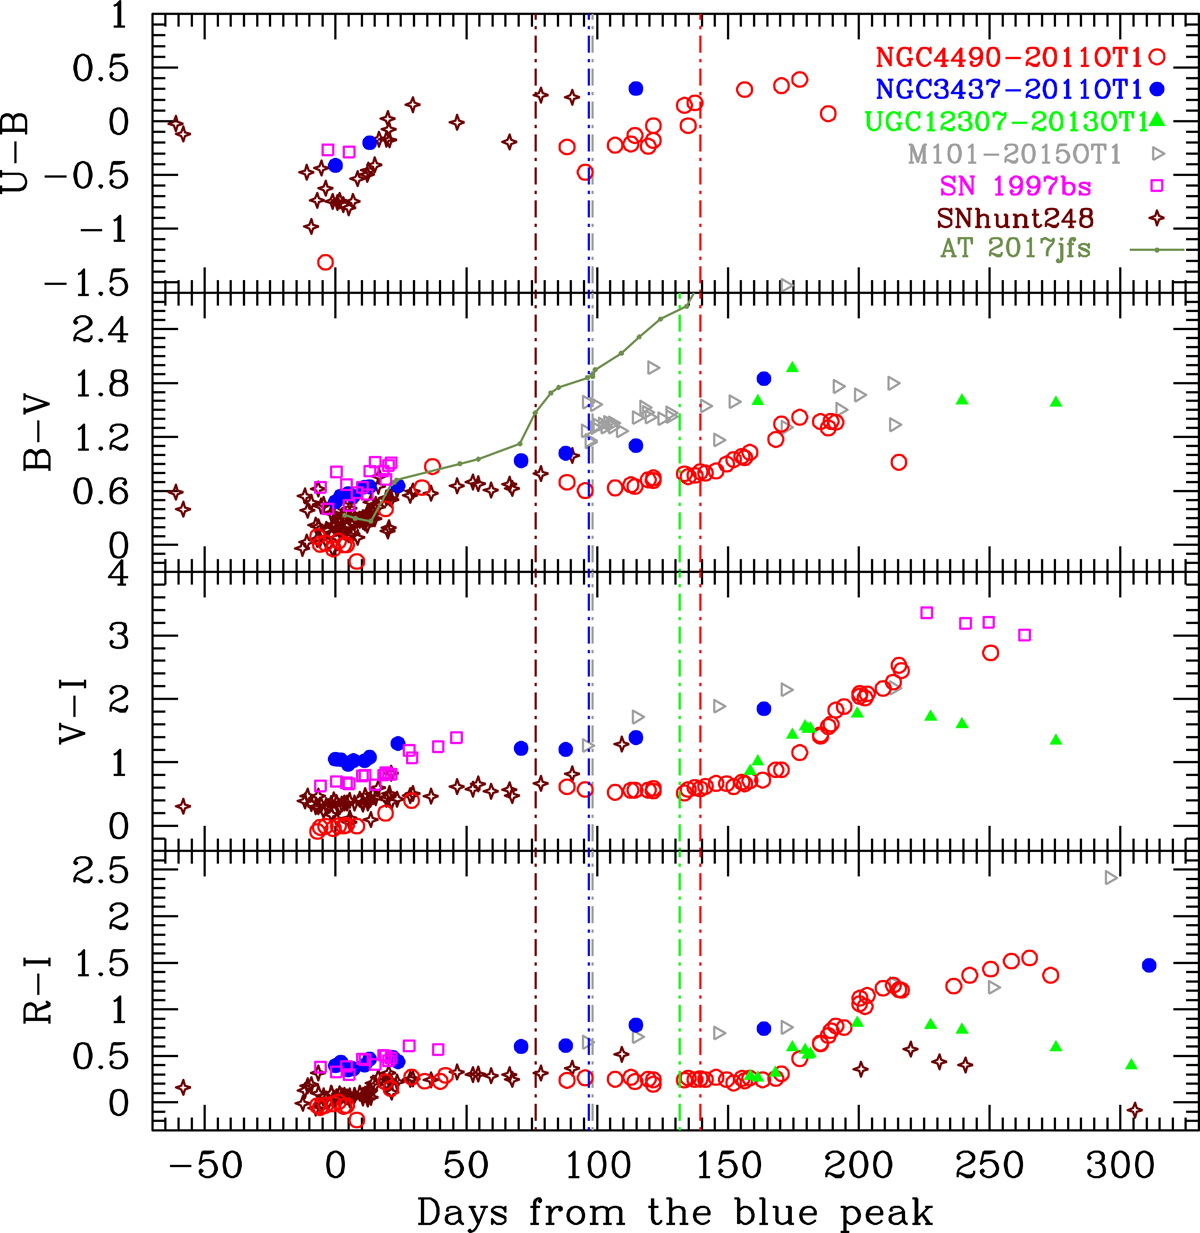
Colour evolution for our sample of LRNe. The phase is in days from the first V band maximum. For UGC 12307−2013OT1, we tentatively adopted JD = 2 456 350 as epoch of the first peak. The dot-dashed vertical lines (plotted maintaining the same colour codes as the symbols) mark the epochs of the red maximum for the different objects. In SN 1997bs, the red maximum was not observed. The B − V colour curve of AT 2017jfs (Pastorello et al. 2019) is also shown as a comparison (solid line).
Current usage metrics show cumulative count of Article Views (full-text article views including HTML views, PDF and ePub downloads, according to the available data) and Abstracts Views on Vision4Press platform.
Data correspond to usage on the plateform after 2015. The current usage metrics is available 48-96 hours after online publication and is updated daily on week days.
Initial download of the metrics may take a while.