Fig. 7.
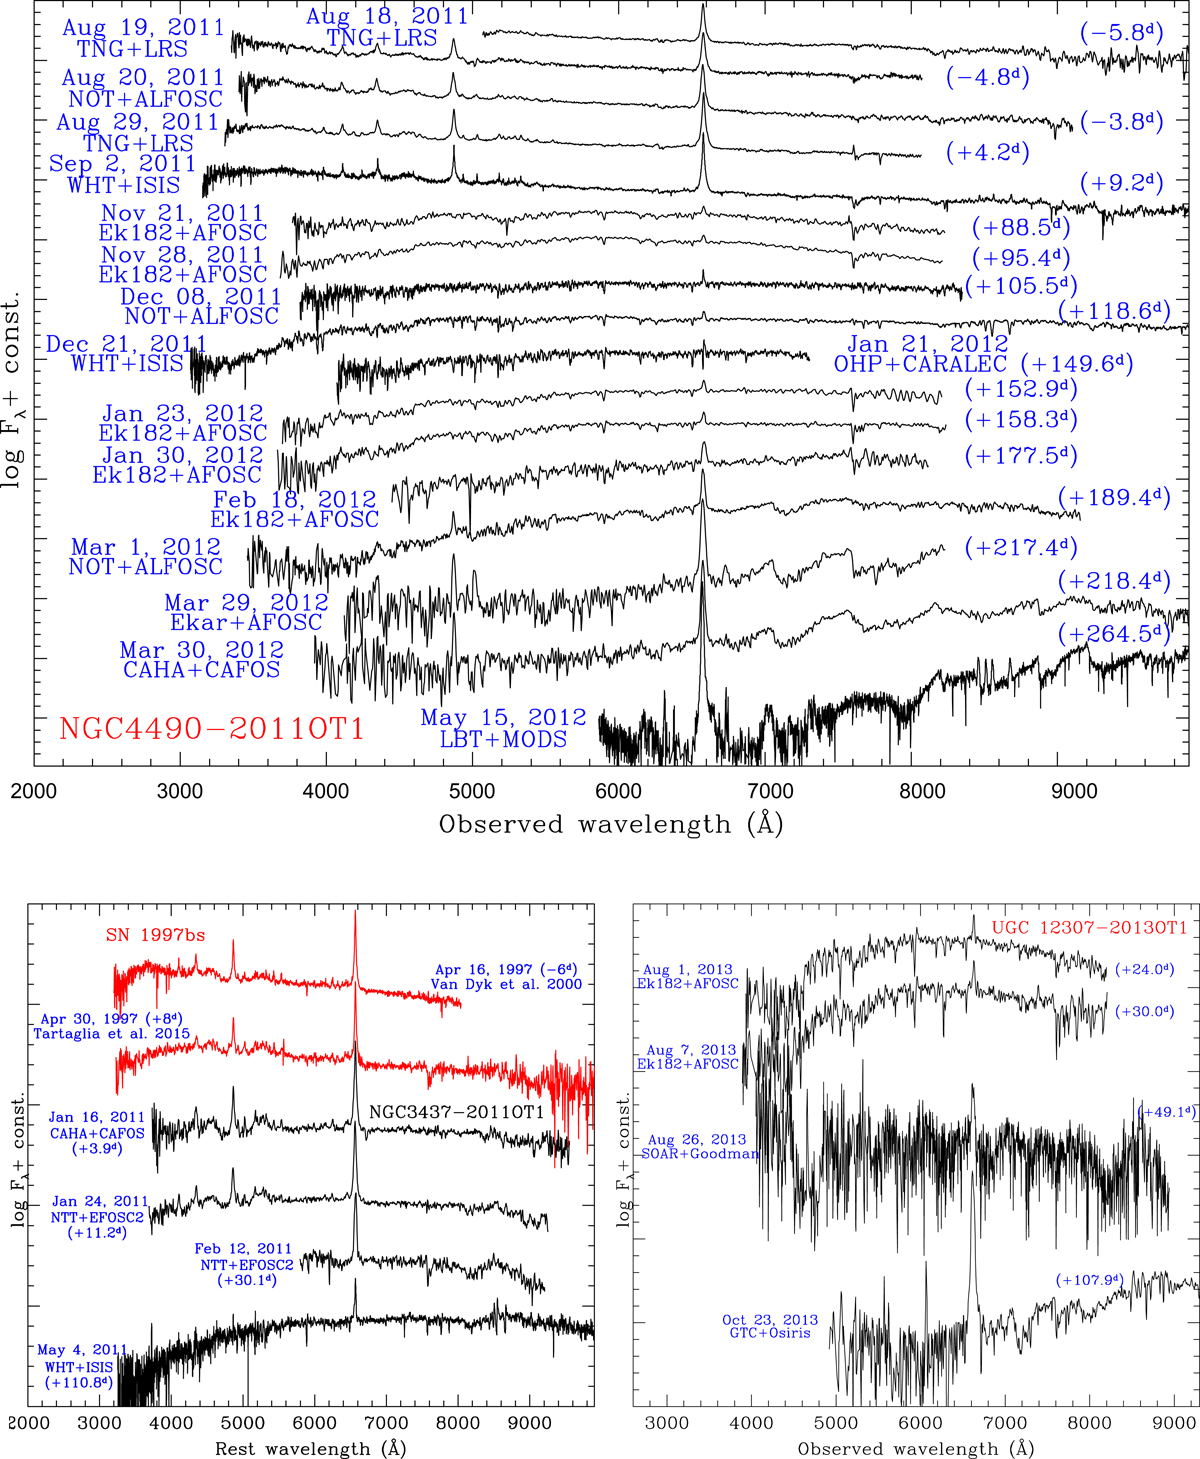
Top: spectral evolution of NGC 4490−2011OT1. Bottom-left: spectra of NGC 3437−2011OT1 shown with those of SN 2007bs available in the literature (Van Dyk et al. 2000; Tartaglia et al. 2015). Bottom-right: spectral evolution of UGC 12307−2013OT1 during and after the red light-curve peak. A low S/N SOAR spectrum of UGC 12307−2013OT1 obtained on 2013 August 26 is shown for completeness.
Current usage metrics show cumulative count of Article Views (full-text article views including HTML views, PDF and ePub downloads, according to the available data) and Abstracts Views on Vision4Press platform.
Data correspond to usage on the plateform after 2015. The current usage metrics is available 48-96 hours after online publication and is updated daily on week days.
Initial download of the metrics may take a while.