Fig. 11.
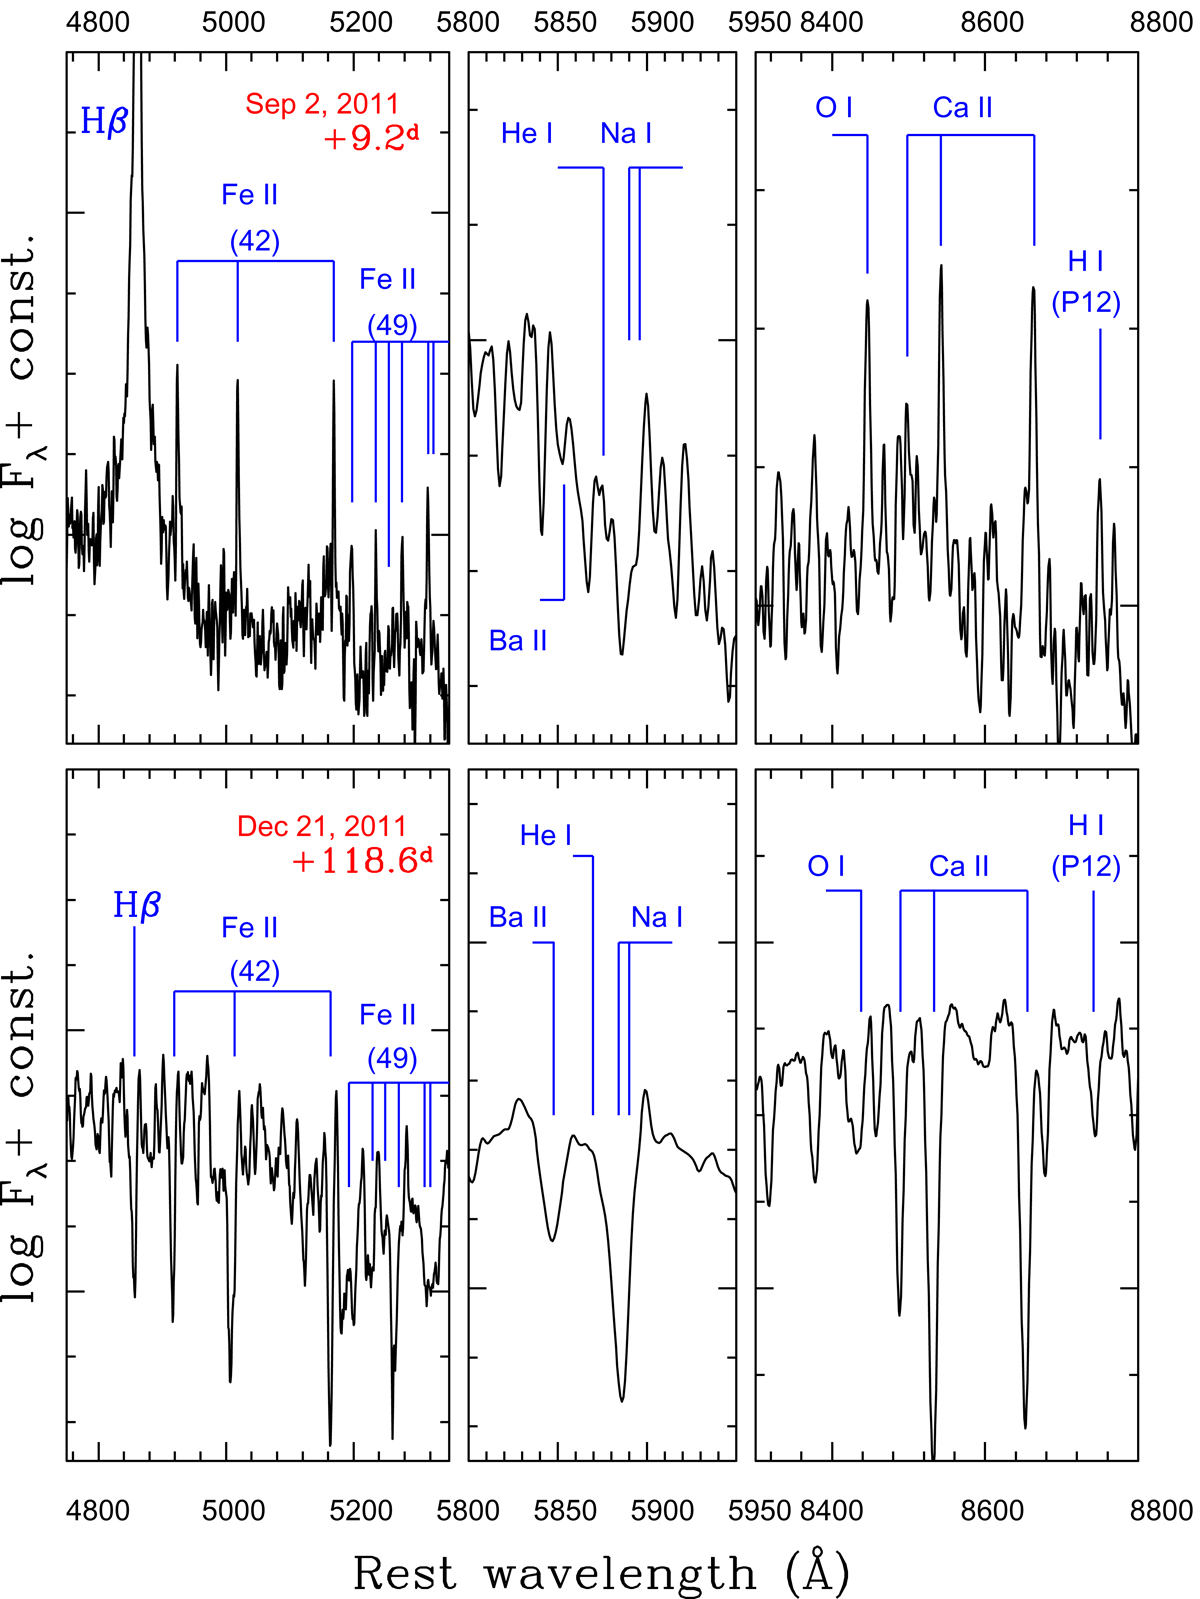
Blow-up of selected spectral windows in two spectra of NGC 4490−2011OT1, at first peak (top panels) and during second maximum (bottom panels). The regions at 4750–5350 Å (left panels), 5800–5950 Å (middle panels) and 8300–8800 Å (right panels) are shown. The positions marked in the bottom panels are those of the P Cygni minima, obtained assuming an average expansion velocity of 300 km s−1 (see text). The position of He I λ5876 is also marked, although that feature is not clearly detected.
Current usage metrics show cumulative count of Article Views (full-text article views including HTML views, PDF and ePub downloads, according to the available data) and Abstracts Views on Vision4Press platform.
Data correspond to usage on the plateform after 2015. The current usage metrics is available 48-96 hours after online publication and is updated daily on week days.
Initial download of the metrics may take a while.