| Issue |
A&A
Volume 629, September 2019
|
|
|---|---|---|
| Article Number | A136 | |
| Number of page(s) | 20 | |
| Section | Interstellar and circumstellar matter | |
| DOI | https://doi.org/10.1051/0004-6361/201936057 | |
| Published online | 18 September 2019 | |
A rotating fast bipolar wind and disk system around the B[e]-type star MWC 922★
1
Centro de Astrobiología (CSIC-INTA), ESAC, Camino Bajo del Castillo s/n, Urb. Villafranca del Castillo,
28691
Villanueva de la Cañada,
Madrid,
Spain
e-mail: This email address is being protected from spambots. You need JavaScript enabled to view it.
2
Centro de Astrobiología (CSIC-INTA), Ctra de Torrejón a Ajalvir,
km 4,
28850
Torrejón de Ardoz,
Madrid,
Spain
3
Observatorio Astronómico Nacional (IGN),
Alfonso XII No 3,
28014
Madrid, Spain
4
Institut de Radioastronomie Millimetrique,
300 rue de la Piscine,
38406
Saint Martin d’Heres,
France
5
Observatorio Astronómico Nacional (IGN),
Ap 112,
28803
Alcalá de Henares,
Madrid, Spain
6
Department of Space, Earth and Environment, Chalmers University of Technology, Onsala Space Observatory,
439 92
Onsala,
Sweden
Received:
10
June
2019
Accepted:
12
July
2019
Abstract
We present interferometric observations with the Atacama Large Millimeter Array (ALMA) of the free–free continuum and recombination line emission at 1 and 3 mm of the Red Square Nebula surrounding the B[e]-type star MWC 922. The distance to the source, which is unknown, is usually taken to be d = 1.7–3 kpc. The unprecedented angular resolution (up to ~0.′′02) and exquisite sensitivity of these data reveal for the first time the structure and kinematics of the nascent compact ionized region at its center. We imaged the line emission of H30α and H39α, previously detected with single-dish observations, and of H51ɛ, H55γ, and H63δ, detected for the first time in this work. The line emission is seen over a full velocity range of ~180 km s−1 arising in a region of diameter <0.′′14 (less than a few hundred au) in the maser line H30α, which is the most intense transition reported here. We resolve the spatio-kinematic structure of a nearly edge-on disk rotating around a central mass of ~10 M⊙ (d = 1.7 kpc) or ~18 M⊙ (d = 3 kpc), assuming Keplerian rotation. Our data also reveal a fast (~100 km s−1) bipolar ejection (possibly a jet) orthogonal to the disk. In addition, a slow (<15 km s−1) wind may be emanating from the disk. Both, the slow and the fast winds are found to be rotating in a similar manner to the ionized layers of the disk. This represents the first empirical proof of rotation in a bipolar wind expanding at high velocity (~100 km s−1). The launching radius of the fast wind is found to be <30–51 au (i.e., smaller than the inner rim of the ionized disk probed by our observations). We believe that the fast wind is actively being launched, probably by a disk-mediated mechanism in a (possibly accretion) disk around a possible compact companion. We have modeled our observations using the radiative transfer code MORELI. This enables us to describe with unparalleled detail the physical conditions and kinematics in the inner layers of MWC 922, which has revealed itself as an ideal laboratory for studying the interplay of disk rotation and jet-launching. Although the nature of MWC 922 remains unclear, we believe it could be a ~15 M⊙ post-main sequence star in a mass-exchanging binary system. If this is the case, a more realistic value of the distance may be d ~ 3 kpc.
Key words: stars: emission-line, Be / circumstellar matter / stars: winds, outflows / stars: individual: MWC 922 / HII regions / radio lines: stars
The reduced images and datacubes are only available at the CDS via anonymous ftp to cdsarc.u-strasbg.fr (130.79.128.5) or via http://cdsarc.u-strasbg.fr/viz-bin/cat/J/A+A/629/A136
© ESO 2019
1 Introduction
Jets are one of the most intriguing phenomena in astrophysics, yet their formation and interaction with their surroundings remains a challenging topic mainly due to the lack observational data of the relevant regions. Our recent pilot study of millimeter radio recombination lines (mm-RRLs) in a sample of young planetary nebula (yPN) candidates with the IRAM-30 m radiotelescope (Sánchez Contreras et al. 2017, hereafter CSC+17), shows that mm-RRLs are optimal tracers to probe the deepest regions at the heart (≲150 au) of these objects, from where collimated fast winds, presumably responsible for the onset of asphericity and polar acceleration in these late evolutionary stages, are launched (see, e.g., Balick & Frank 2002, for a review).
Studying the jet-launching sites is difficult due to their small (subarcsec) angular sizes and because they are usually heavily obscured by optically thick circumstellar dust. For this reason, the wind collimation mechanism in yPNe and related objects (supposedly hosting mass-exchanging binaries and disks) remains largely unknown. Progress in this field requires sensitive, high angular resolution observations at millimeter and submillimeter wavelengths of key objects, for example objects that harbor ongoing fastbipolar ejections and other structures with an essential role in jet formation, such as rotating disks. The results presented in this work demonstrate that the IR excess B[e] star MWC 922 is one of the very few such objects.
MWC 922 was dubbed the Red Square Nebula after the discovery of a large-scale nebulosity (~5′′) in the near-infrared with a remarkable X-shaped morphology surrounding the central star (Tuthill & Lloyd 2007). This nebular structure has its symmetry axis oriented nearly along the NW-SE direction and is crossed by a dark band at its center, an equatorial dusty disk oriented along the NE-SW direction. An evolved nature has been suggested for MWC 922 based on the similarities of its nebular morphology and spectral energy distribution (SED) with those of the Red Rectangle, a well-known post-asymptotic giant branch (post-AGB) nebula (e.g., Cohen et al. 1975; Jura et al. 1995; Waters et al. 1998; Bujarrabal et al. 2016). For a comprehensive description of the MWC 922 characteristics, see, e.g., CSC+17 and references therein, or the most recent studies by Wehres et al. (2017) and Bally & Chia (2019). These works report on 300 nm–2.5 μm spectroscopy of the rich emission line spectrum in this target, including the detection of polycyclic aromatic hydrocarbons (PAHs) and CO first and second overtone emission (Wehres et al. 2017), and deep narrowband optical imaging showing the presence of a ~[0.8–10] × 104 yr old, pc-scale jet perpendicular to the disk and expanding at ~500 km s−1 (Bally & Chia 2019).
MWC 922 readily revealed itself as an outstanding source in our pilot mm-RRLs study (CSC+17). The drastic transition from single-peaked mm-RRL profiles at 3 mm (H39α and H41α) to double-peaked profiles at 1 mm (H31α and H30α) indicated maser amplification of the highest frequency lines. To our knowledge, only a few other sources with mm-RRLs masers are known in the literature, namely MWC 349A,η Carinae, Cepheus A HW2, MonR2-IRS2, the PN Mz3 (Martín-Pintado et al. 1989a; Cox et al. 1995; Jiménez-Serra et al. 2011, 2013; Abraham et al. 2014; Aleman et al. 2018) and tentatively towards the starburst galaxy NGC 253 (Báez-Rubio et al. 2018). The mm-RRL profiles in MWC 922 suggested rotation of the ionized gas, probably arranged in a disk plus wind system around a ~8 M⊙ central mass (CSC+17). The ionized core of MWC 922 was modeled using the non-local thermodynamical equilibrium (non-LTE) radiative transfer core MOdel for REcombination LInes (MORELI; Báez-Rubio et al. 2013), adopting a double-cone geometry for the ionized disk and wind system. The size of the millimeter-continuum and the mm-RRLs emitting region was inferred to be ≲150 au, containing a total mass of ionized gas of MH II ~ 4 × 10⁻⁵ M⊙ (adopting d = 1.7 pc).
As is the case of many gas and dust enshrouded B-type emission line stars, the nature of MWC 922 is uncertain. This is partially due to the unknown distance to the source. The latter is usually taken to be in the range d = 1.7–3 pc, where the low and high ends are respectively the distance to the nearby Ser OB1 association1 (to which MWC 922 may or may not be related) and the near kinematic distance deduced from the Galactic rotation curve and the systemic radial velocity of the source, VLSR = 32–33 km s−1 (CSC+17). For this range of distances the total luminosity of MWC 922, after extinction correction, is L⋆ ~ [1.8–5.9] × 104 L⊙ (CSC+17). The effective temperature of MWC 922 is also not well established, although it probably lies within the range Teff ~ 20 000–30 000 K (Rudy et al. 1992).
Throughout this paper we use d = 1.7 kpc by default because this is the most commonly used value in the literature and the one adopted in our original model of MWC 922 (CSC+17), which facilitates comparison. However, as a result of our analysis, we believe that a value of d ~ 3 kpc may be more realistic see “Position in the HR diagram” in Sect. 5.2.
2 Observations and data reduction
The observations were performed with the ALMA 12 m array as part of our projects 2016.1.00161.S and 2017.1.00376.S. A total of 12 different spectral windows (SPWs) within Band 3 (3 mm) and Band 6 (1 mm) were observed to map the emission of several mm-RRLs and the continuum towards the B[e] star MWC 922 (Table 1). The Band 3 and 6 observations were done separately in two different ≲2 h execution blocks in September and October 2017, respectively. The data were obtained with 44–48 antennas, with baselines ranging from 41.4 m to 14.9 km for Band 3 and from 113.0 m to 13.9 km for Band 6. The maximum recoverable scale is ~0.′′8 and ~0.′′35 at 3 and 1 mm, respectively.
The total time spent on the science target, MWC 922, was about 49 min in Band 3 and 33 min in Band 6. A number of sources (J 1733-1304, J 1825-1718, J 1828-2123, J 1830-1606, J 1835-1513, and J1924-2914) were also observed as bandpass, complex gain, and flux calibrators. The flux density adopted for J 1733-1304 is 2.958 Jy at 108.983 GHz and for J 1924-2919 is 3.717 Jy at 231.868 GHz.
An initial calibration of the data was performed using the automated ALMA pipeline of the Common Astronomy Software Applications (CASA2, versions 4.7.2 and 5.1.1). Calibrated data were used to identify the line-free channels and to obtain initial images of the lines and continuum in the different SPWs. When strong source emission was detected, the noise in those channel maps was dominated by secondary lobes triggered by residual calibration errors. Therefore, given the high signal-to-noise ratio (S/N > 100) achieved in the continuum images and the absence of significant or complex large-scale structure in MWC 922 in our observations (see Sect. 3), we self-calibrated our data using the initial model of the source derived from the standard calibration to improve the sensitivity and fidelity of the images. Self-calibration, and image restoration and deconvolution was done using the GILDAS3 software MAPPING.
We created continuum images for each of the 12 SPWs using line-free channels. Line emission cubes were produced after subtracting the corresponding continuum (i.e., the continuum of the SPW containing the line). We used a spectral resolution of Δv = 1.5–4.5 km s−1, depending on the S/N of the maps, typically Δv = 1.5 km s−1 for the H30α and H39α transitions and Δv = 4.5 km s−1 for the non-α lines. By default, we used the Hogbom deconvolution method with a robust weighting scheme, which results in angular resolutions down to ~ 22 × 32 mas at 1 mm and ~50 × 65 mas at 3 mm. The typical rms noise level in the line-free Δ v = 1.5 km s−1 (Δv = 4.5 km s−1) channels of our spectral cubes is σ ~ 1.1 mJy beam−1 (σ ~ 0.4 mJy beam−1). The rms noise level range in the continuum maps is ~0.10–0.15 and 0.04–0.09 mJy beam−1 for the individual SPWs within Band 3 and Band 6, respectively.
Finally, to better characterize some of the small-scale structural details of the compact source, we analyzed the distribution of clean components by producing an even higher angular resolution version of the images (referred to as super-resolution images) by imposing a circular restoring beam of 15 and 30 mas at 1 and 3 mm, respectively. These figures are used to discern between similar models with slightly different input parameters, and are shown in the appendix.
Central frequency, bandwidth, velocity resolution, spectral lines, and continuum fluxes in the different spectral windows.
3 Observational results
3.1 Continuum
Continuum emission maps at frequencies near the H30α (231.9 GHz) and H39α (106.7 GHz) lines are shown in Fig. 1. No significant differences in the surface brightness distribution of the continuum at other SPWs within the same band (not shown) were found. The 3 mm continuum surface brightness peaks at coordinates RA = 18h21m16. s0570 and Dec = −13°01′25.′′72 (J2000). Throughout this paper these coordinates have been adopted to define the (0′′, 0′′) positional offsets in all figures illustrating image data.
The continuum emission, which is spatially resolved, appears as a square- or rectangular-like nebulosity of full dimensions (~3σ level) ~0.′′12 × 0.′′16 (convolved with the beam) at 1 mm. Its long axis is oriented along PA ~ 45°, similarly to the dark equatorial band crossing the center of the near-IR (NIR) nebula (Sect. 1). The central brightest parts of the 1 mm-continuum nebulosity are elongated orthogonally to the equator where it exhibits a subtle waist. The ALMA continuum maps with super-resolution (15 and 30 mas at 1 and 3 mm, respectively) are shown in Fig. A.1. These maps reveal an X-shaped morphology of the continuum emitting region reminiscent of the NIR and mid-IR nebulae observed at much larger angular scales (from ≈1′′ to ≈100′′, Tuthill & Lloyd 2007; Lagadec et al. 2011). The X-shape of the millimeter-continuum maps is consistent with the free–free emission arising in a biconical shell inscribed in a larger and predominantly neutral rotating disk that is illuminated and photoionized by the central source, as we hypothesized in CSC+17.
The total continuum fluxes integrated over the whole source at 12 different frequencies are given in Table 1. These fluxes are shown in Fig. 2 together with the SED of MWC 922 from the near-IR to the radio domain. The comparison of the ALMA fluxes with those obtained at similar frequencies with the IRAM-30 m single-dish telescope (CSC+17) indicates that there are no significant interferometric flux losses in our data. The spectral index deduced from our ALMA 1 to 3 mm data is α ~ 0.65 (Fig. 2, right), which is consistent with predominantly free–free continuum from an ionized wind, as already known (CSC+17). The spectral slope of the continuum is rather different if we compute it using separately Band 3 (3 mm) and Band 6 (1 mm) continuum fluxes (Sν ∝ ν0.83 and Sν ∝ ν0.340.34, respectively).
As can be seen in the left panel of Fig. 2, there is a significant contribution (~15–20%) of dust emission to the total flux at 1 mm. The dust emission in MWC 922 in the mid- to far-IR (from ~12 to ~300 μm) is nicely represented by a modified blackbody at ~162 K with a dust opacity frequency dependence of ~ ν1.1 (dotted line in Fig. 2, left). After subtraction of the dust emission contribution to the total continuum flux measured with ALMA (blue symbols in Fig. 2, right), the spectral index of theremaining free–free emission at 3 mm is smaller than, but similar to, the initial value (α = 0.77 ± 0.04). However, at 1 mm the free–free continuum flattens notably and even appears to reach a negative spectral index (α = −0.16 ± 0.3). Although the spectral index at 1 mm is poorly determined, mainly due to the uncertainties in the fit of the underlying dust emission and the scatter of the ALMA data points, this behavior suggests that the free–free emission is optically thin around 1 mm. The positive spectral index at 3 mm, however, is consistent with partially optically thick free–free emission. We thus expect the free-free turnover frequency to be somewhere between these two wavelengths.
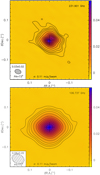 |
Fig. 1 Maps of the continuum emission adjacent to the H30α (231.9 GHz) and H39α (106.7 GHz)lines. Contour levels are at 1, 2, 3, and 5%, and from 10 to 100% in steps of 10% of the peak (53.0 and 54.5 mJy beam−1 at 1 and 3 mm,respectively). The central cross marks the 3 mm-continuum surface brightness peak. |
3.2 Radio recombination lines
We have mapped with ALMA a total of five radio recombination lines in the millimeter wavelength range: H30α (231.9 GHz) and H39α (106.7 GHz), previously detected and reported by CSC+17, as well as H51ɛ (215.7 GHz), H55γ (109.5 GHz), and H63δ (96.0 GHz), which are first-time detections. The observational results from our ALMA data of the H30α and H39α lines are summarized in Figs. 3–5. The complete velocity-channel maps of these transitions are reported in Figs. A.3 and A.4.
The H30α maser shows a double-horn line profile, with two prominent peaks of emission at VLSR ~ 15.3 and 50.3 km s−1 (Fig. 3). The high sensitivity of ALMA reveals weak wings of ~180 km s−1 in width in the H30α profile, within the velocity range VLSR ~ [−60,120] km s−1.
As expected, the H30α line emission arises from a region that is comparable in shape and dimensions to the continuum-emitting area. The emission from the red and blue peaks are displaced to the NE (which we define as the y-axis) and SW side of the nebula, respectively (i.e., along the equatorial waist of the large-scale NIR nebula; Fig. 3c). This is consistent with an equatorial structure in rotation, which is also apparent in the position velocity cut shown in the bottom left panel of Fig. 3. The relative separation between the red- and blue-peak emitting areas along the equator is about δy = 0.′′03. For an edge-on rotating disk, the velocity gradient observed implies a rotation velocity of ~17 km s−1 at a radial distance of about 25 au . Assuming Keplerian rotation, this implies a value for the central mass of ~8 M⊙
 , in agreement with the value inferred from our pilot study of single-dish mm-RRLs (CSC+17).
The spatial distribution of the red and blue emission peaks is extended along the direction perpendicular to the disk plane (PA ~ 135°, which we define as the x-axis), with an angular size at half-intensity (at 3σ level) of ~0.′′04 (~0.′′09). This indicates that the H30α line emission, as the continuum, is produced over a range of latitudes in a biconical shell and not in a flat equatorially thin disk, in agreement with our initial model of the source presented in CSC+17. This is also directly visible in the maps of the valley of the H30α transition (i.e., the spectral region between the two emission peaks; Fig. 3d). The pinched-waist rectangular shape of these maps denotes an underlying X-shaped morphology, which is expected from a biconical emitting surface and that indeed becomes evident in our super-resolution maps (Fig. A.6). Rotation in the intermediate- to high-latitude regions is also visible in the PV cuts along the direction of the disk-plane at different δx offsets shown in Fig. 4.
The H30α wing emission arises from a ~0.′′095 × 0.′′065 peanut-shaped region elongated in the direction perpendicular to the disk-plane (Fig. 3b). This is consistent with the presence of a fast bipolar wind orthogonal to the rotating disk. The distribution of the wing emission, concentrated towards the disk rotation axis, indicates that the opening angle of the fast wind is smaller than that of the biconical surface of the disk; that is, the fast wind runs through the interior of (occupies higher latitudes than) the disk, where the red and blue emission peaks are predominantly formed. The position-velocity cut along the polar axis of the wind (PA = 135°, Fig. 3, bottom right) does not present a significant velocity gradient in this direction, which is consistent with the polar axis of the fast flow lying in the plane of the sky or very close to it. The full width of the wings (~180 km s−1) indicates a lower limit to the expansion velocity of the fast polar wind of ~90 km s−1.
As we can see in Fig. 3b, the two relative maxima of the H30α red- and blue-wing emitting regions are ~0.′′036 apart (~61 au at 1.7 kpc). This is compatible with the presence of a central cavity of radius ≲30 au at the center of the ionized region that surrounds MWC 922 (see Sect. 4). The peanut-shaped emitting regions of the red and blue wings do not lie exactly on the disk’s revolution axis (PA = 135°). In fact, the red- and blue-wing emitting region is slightly offset (by ~0.′′01) towards the NE and SW direction, respectively. The overall offset of these two features denotes a velocity gradient perpendicular to the outflow axis that is an explicit indication of rotation in the fast wind. This is also visible in the PV cuts along the disk-plane (Fig. 3, bottom left, and Fig. 4) and it is corroborated by our model (as we show in Sect. 4).
The ALMA observations of the H39α line are shown in Figs. 5 and A.4. In contrast to the H30α transition, the profile of the H39α line has a nearly Gaussian core, as already known from our previous single-dish observations (CSC+17). The angular resolution at 3 mm is a factor of ~2 poorer than at 1 mm. Even so, the spatial emission distribution of the H39α transition definitively corroborates the presence of both the rotating disk and the fast bipolar outflow in MWC 922.
We detect with ALMA broad H39α emission wings that extend over a full velocity range of ~140 km s−1. The rotation of the fast wind is not evident in the maps of the H39α line wings (Fig. 5b); in this case, the lower S/N precludes identifying the relative offset along the y-axis between the red- and blue-wing emitting regions. The smaller width of the H39α wings compared with that of the H30α line is probably simply a result of the lower S/N of the H39α maps. Alternatively or additionally, this could be a sign of outward deceleration of the fast wind since, due to opacity effects, the H39α line is expected to trace layers of the ionized gas that are slightly more distant from the center than the H30α transition. Higher sensitivity and angular resolution observations are needed to investigate this.
The comparison of the source-integrated H30α profile as observed with ALMA and with the IRAM-30 m single-dish antenna two years earlier reveals apparent differences (Fig. 3a). In addition to an overall brightening and slight profile broadening, we observe a notable increase of the asymmetry between the blue and the red peak, with the blue peak almost doubling the intensity of the red peak in the ALMA data. These changes cannot be due to calibration errors, but instead point to variations with time of the physical properties within the emitting volume. Given the maser nature of the H30α transition, even small changes in the physical conditions of the ionized core will be nonlinearly amplified in a significant amount. Variability as well as strongly asymmetric profiles of maser mm-RRLs have been reported in other ultracompact H II regions (Martín-Pintado et al. 1989b; Thum et al. 1992; Gordon et al. 2001; Jiménez-Serra et al. 2013).
Differences in the ALMA and IRAM-30 m H39α profiles are also perceived (Fig. 5a); for example, the ALMA spectrum is slightly more intense and wider than the IRAM-30 m line. However, in this case, these small discrepancies could be due, in principle, to pointing and absolute flux calibration errors of the single-dish spectrum (of up to ~30%, CSC+17).
Finally, as already mentioned, other non-α mm-RRLs lines have been detected with ALMA, namely H55γ, H63δ, and H51ɛ. These transitions are intrinsically weak and therefore the S/N of the obtained maps is rather low, which prevents discerning structural or kinematical details of the emitting region. Integrated intensity maps and total emission profiles of these transitions are shown in Fig. A.5.
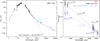 |
Fig. 2 Left: SED of MWC 922 as in CSC+17, after adding PACS and SPIRE data (Molinari et al. 2016; Ramos-Medina et al. 2018), and including our ALMA continuum flux measurements (cyan, Table 1). Right: ALMA millimeter-continuum fluxes before (black) and after (blue) subtraction of the ~162 K dust emission contribution (dotted line in left panel). The red stars represent single-dish IRAM-30 m data (CSC+17). |
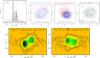 |
Fig. 3 Summary of ALMA data of the H30α line (see also Fig. A.3). Top, panel a: integrated spectrum of the H30α line obtained with ALMA (black lines) and with the IRAM-30 m antenna (gray histogram, CSC+17). The colored hatched regions indicate the different velocity intervals used to generate the maps in panels b–d. The ALMA profile multiplied by a factor of 10 (dotted line) is overplotted for a clearer view of the broad line wings. Panels b–d: we show the H30α emission maps integrated over the line wings, the peaks, and the valley, respectively. Bottom: position velocity cuts of the H30α line through the center of MWC 922 along the disk plane (left, PA = 45°) and the perpendicular direction (right). Levels are 2.5, 5, 7.5, 10, 20, and then from 50 to 1700 in steps of 75 mJy beam−1. |
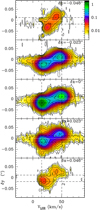 |
Fig. 4 Position-velocity (PV) cuts of the H30α line along the direction of the equator (PA = 45°) at different δx offsets (δx = −0.′′046, δx = −0.′′023, δx = 0′′, δx = +0.′′023, and δx = +0.′′046). The dashed lines show the position and velocity of the red and blue emission peaks at offset δx = 0′′. Offset δy = 0 is indicatedby the white dotted line. The signature of rotation is very clear even at the largest offsets. Levels are 3.5 × 1.5i (i = 1,2,3,...) mJy beam−1; the units of the wedge are mJy beam−1. |
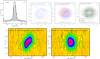 |
Fig. 5 Same as in Fig. 3, but for the H39α line. The field of view and beam size are larger in this case. Levels in the PV diagrams (bottom) are 2.5, 5, 7.5, and from 10 to 90 in steps of 10 mJy beam−1. |
4 Analysis: modeling of the emission
We have modeled the free–free continuum and mm-RRL emission from the ionized core around MWC 922 using the non-LTE radiative transfer code MORELI, which is described in detail in Báez-Rubio et al. (2013). We used MORELI in CSC+17 to model MWC 922 and a small sample of pPNe candidates to constrain the structure, physical conditions, and kinematics of the emerging H II regions in these objects. The model of MWC 922 presented in CSC+17 has been refined to reproduce our ALMA maps. The reader is referred to CSC+17 for full details on the parameters, major assumptions, and general uncertainties of our modeling approach. We offer a summary of the model basis here, which is followed by a description of the most important modifications made to the initial model in our current study.
The H II region around MWC 922 has been represented by a conical geometry, i.e., the ionized emission is assumed to arise in two opposing conical structures that are coaxial with, and inscribed in, an extended neutral rotating disk (Fig. 6). The outermost biconical layer, in contact with the neutral part of the disk, simply represents the thin conical surface of the rotating disk that is illuminated and photoionized by the central source. We refer to this component as the “ionized disk skin” or simply the “disk” and its outermost boundary is characterized by a semi-opening angle θa measured from its revolution axis to the midplane. The disk has an angular width θd, that is, it extends from θa to θa −θd. The regions that are inside of (or surrounded by) the innermost boundary of the disk, at colatitude θ < θa−θd, form the “outflow/wind” (see Fig. 6).
The kinematics of the disk and the outflow are also as described in CSC+17: the disk is assumed to rotate in a Keplerian (Vrot ∝ 1/ ) fashion, andthe outflow is modeled as a rotating and radially expanding wind. As we show below, in the new model the outflow has been subdivided into a slow and a fast wind component. The rotation in both components is taken to be the same as in the disk.
The electron density (ne) is assumed to vary throughout the disk and outflow as a function of the radial distance, following a power-law distribution (∝ r−β), and also as a function of the latitude, decreasing exponentially from the outer boundary of the disk toward the poles (∝ ) (see Fig. 6 and Table 2). For simplicity and to restrict the number of model input parameters, we adopt a constant value of the electron temperature (Te) within the disk and within the outflow.
The major modifications made on our base model for MWC 922 in this work are the following:
- 1.
We introduce a new component, the fast wind, to explain the broad emission wings of the H30α and H39α lines. The spatial distribution of the line wing emission denotes the presence of a fast bipolar wind orthogonal to the disk (Figs. 3b and 5b). This fast outflow is represented in our model as a bicone with a semi-opening angle θw measured from the revolution axis (Fig. 6).
- 2.
In order to recreate the X-shaped morphology of the ionized core around MWC 922 implied by the ALMA data, a larger value of the disk semi-opening angle (θa ~ 60°) is now adopted.
- 3.
We increase the size of the central cavity (Rin ~ 29 au). There are two reasons for this. First, a Rin ~ 29 au cavity most closely reproduces the separation between the two relative maxima of the red- and blue-wing emitting regions of the H30α line (Fig. 3b). Second, a larger cavity is needed to explain the flattening of the free–free continuum emission observed towards 1 mm (Fig. 2). We note that in CSC+17 the slope of the continuum could not be measured separately at 1 mm and 3 mm, which led us to adopt a unique common value of the spectral slope consistent with optically thick free–free emission in the whole 1–3 mm range.
- 4.
We now consider the contribution to the total emission from a thin layer of ionized gas located immediately beyond the cavity, at the inner edge of the rotating neutral disk (the “disk’s inner edge” in Fig. 6). This component is needed to enhance the H30α emission from low-latitude regions, and thus to bring the emission from the red and blue peaks closer to the disk midplane, as observed (see, e.g., Fig. 3c).
- 5.
We consider a nonzero yet low value of the turbulence velocity dispersion (σturb ~ 2–3 km s−1) as an additional component of line broadening4 (coupled with thermal, pressure, and macroscopic motion broadening).
The code MORELI produces synthetic images of the free–free continuum and mm-RRLs with a spatial resolution that is equal to the size of the grid cells used to perform the radiative transfer computations (typically ~1–2 au). To simulate the observations with ALMA, we used our input model and the same UV sampling and weighting of our ALMA observationsto generate the synthetic or model visibilities. This was done using the task uv_model of MAPPING (GILDAS). After a model UV table was created, image restoration and cleaning of the latter was performed using exactly the same tasks and parameters as for the ALMA data (Sect. 2). This way an accurate comparison between model and observations is guaranteed. For example, although this is not the case in MWC 922, there would be no problem with large-scale structures being filtered out in the data as they will be equally filtered by the UV coverage in the restoration of the model image.
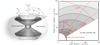 |
Fig. 6 Left: sketch of the biconical geometry adopted in our model (Sect. 4). The equatorial plane is oriented in the sky along PA = 45° and is seen edge-on. Right: two-dimensional representation of the density law adopted (Table 2). Contour levels are 2.5 × 10⁵, 5 × 10⁵, 106, 5 × 10⁶, 107, and 5 × 107 cm−3. Dotted linesdelimit the different model components. The neutral disk is not probed by our ALMA observations. |
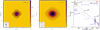 |
Fig. 7 Model predictions of the free–free continuum of MWC 922 (Sect. 4, Table 2). Left and middle: 1 and 3 mm continuum maps as in, and to be compared with, Fig. 1. Right: spectral energy distributions as in, and to be compared with, Fig. 2b. Model free–free continuum integrated fluxes are indicated bythe pink line. |
4.1 Model results
In Table 2 we give the input parameters of a model that successfully reproduces our ALMA images and line profiles of the mm-RRLs and the free–free continuum emission in MWC 922. As we can see in Fig. 7, this model predicts the free–free continuum fluxes observed at 1 and 3 mm and the flattening of the emission at intermediate wavelengths (Fig. 1). The morphology of the predicted and observed continuum emission maps is also very similar, even with super-resolution (Figs. A.1 and A.2). In particular, our model adequately emulates the X-shaped brightness distribution denoted by the 3 mm continuum maps. At 1 mm, data–model discrepancies are expected since the observations include the dust emission contribution, which is not modeled and could represent ~15–20% of the total flux observed (and not resolved out). We believe that the faint extended emission along the disk equator observed at 1 mm, but not reproduced by our model, is probably due to dust settled in the disk’s midplane.
The profile and spatial distribution of the mm-RRLs are also reasonably well reproduced by our model (Figs. 8, 9, and A.5). In the case of the α-transitions, the model predicts the change from a single-peaked profile at 3 mm (H39α) to a double-horn profile at ~1 mm (H30α), as well as the overall intensity and shape of both profiles, including the broad wings. As expected, our axially symmetric model is not able to reproduce the higher intensity of the H30α blue peak relative to the red peak, as observed with ALMA. The line asymmetry, which has changed with time as deduced from our observationswith the IRAM-30 m antenna (Fig. 3), could be mimicked by adding one or more dense ionized clumps on the approaching side of the disk. Given the time-variable profile and the nonlinear response of the H30α maser line to small changes in the physical properties in the emitting region, such a model is beyond the scope of this paper.
Our model confirms the maser nature of the H30α transition, with a minimum optical depth at the line (blue) peak τ30α ~ − 6, which explains the high intensity of this line and its time-varying and double-horn profile. Our model indicates that, although to a lesser degree, the H39α line also shows maser amplification (τH39α ~ − 2). The rest of the mm-RRLs reported here (H51ɛ, H55γ, and H63δ) are predominantly thermal lines, with a minor contribution by stimulated emission (|τ| ≪ 1), and thus with intensities close to those expected in LTE.
Concerning the surface brightness distribution of the α-transitions, we are able to emulate the shape and position of the emission wings, the angular separation of the red- and blue-peak emitting regions along the disk equator (i.e., the y-axis), and the morphology at the systemic velocity (panels b, c, and d in Figs. 8 and 9). Our model, in general, most closely reproduces the H30α maps. In the case of the H39α transition, our model slightly overestimates the width of the profile and is not able to explain the emission dip at the center of the emission wings (in contrast to H30α). These two facts suggests that the H39α emission arises in regions slightly more distant from the center than predicted by the model.
The H30α red- and blue-peak emitting regions appear slightly more extended in the direction perpendicular to the disk (i.e., the x-axis) in the model than in the observations (Fig. 3, panel c and bottom right panel). The ALMA super-resolution maps show, as predicted by our model, that both the red- and blue-peak H30α emitting regions are actually elongated along the x-axis and hint at two local maxima, which are δx ~ 0.′′02 apart (Fig. A.6c). In the data the asymmetry of these regions about the equator is notable, with the SEclump being brighter than the NW clump. This is not reproduced by our model, which is symmetric about the disk equatorial plane. We note that, in any case, this asymmetry is not apparent in the H39α maps (Fig. A.7c), which indicates that the differences in the physical conditions of the disk regions above and below the equator are probably relatively small, but are exponentially amplified by the H30α maser.
The H30α red- and blue-peak emission clumps lie closer to the disk equator in the data than in the model (most notably for the intense blue peak). We include in our model the emission from the inner wall or edge of the neutral rotating disk, presumably ionized by the star (Fig. 6), to enhance the H30α emission from the midplane of the disk, although our model still slightly underestimates the amount of ionized gas in these very low-latitude disk regions (θ →90°).
Our model confirms the kinematic structure of the ionized H II region around MWC 922 inferred directly from the line maps. The rotation of the gas at low to intermediate latitudes in the disk is nicely described by a Keplerian law (Vrot ∝ 1/ ). The central mass is about ~10 M⊙ (adopting d = 1.7 kpc), although the uncertainty of this value is relatively high, up to 25%, as a consequence of the uncertain bn departure coefficients (as discussed already in CSC+17) and the high sensitivity of the maser line intensity to the latter. We also ran a model adopting an angular-momentum conservation rotation law (Vrot ∝ 1/r, not shown). However, the angular resolution of the maps does not enable us to determine if there is a significant improvement when using this law.
As in our initial model presented in CSC+17, in addition to rotation, the mid-latitude regions of the ionized core lying just above the thin ionized surface of the rotating disk include radial expansion at low velocity. This component, which is referred to as the slow wind (as already mentioned, Fig. 6), was introduced in our model because it is found in most systems to date where rotating disks have been spatially resolved, including the Red Rectangle and MWC 349, which resemble MWC 922 in many aspects (e.g., Martín-Pintado et al. 2011; Báez-Rubio et al. 2013; Bujarrabal et al. 2013, 2017, 2018). However, based on our current ALMA data, we cannot firmly establish the presence of a slow wind in MWC 922 since different models with radial expansion, or even infall motions, with velocities in the range |Vslow| ~ 0–10 km s−1 lead to synthetic maps that are equally satisfactory, within the uncertainties. In a similar way, we cannot rule out expansion (at low velocity, ≲10–15 km s−1) in the so-called disk component (which has been assumed to have a width of θd = 6.5°), where pure rotation is adopted for consistency with our original model presented in CSC+17, which was inspired in that performed for MWC 349A (Martín-Pintado et al. 2011; Báez-Rubio et al. 2013).
One of the novelties and, probably, the most relevant discovery in this paper is the presence of a fast bipolar wind emerging from MWC 922 and the fact that this wind is rotating. The expansion velocity adopted here is Vfast ~ 95 km s−1, although slightly faster motions are possible given that the full width of the H30α line wings are somewhat underestimated by our model. We use a conservative value of Vexp that simultaneously explains the profiles of all the mm-RRLs detected. It should be noted that the H39α wings are rather well emulated. The rotation of the fast wind, in the same sense as the disk, reveals itself in the data and in the model as a small offset about the disk’s revolution axis (i.e., the x-axis) of the blue-and red-wing emission clumps; this is best seen in the intense H30α transition (Figs. 3b and 8b). The offset is also visible in the PV diagram along the y-axis. We note that the red-wing (blue-wing) overall emission lies above (below) the δy = 0′′ line (bottom leftpanels of Figs. 3 and 8 and Fig. 4). To corroborate the rotation in the fast wind, we show in Fig. A.6 the predictions of a model in which rotation has been suppressed in the fast wind; as expected, this model is not able to reproduce the observed off-axis distribution of the H30α red- and blue-wing clumps, which overlap on top of the disk–wind revolution axis.
4.2 Model caveats and uncertainties
Our model is a relatively simple representation of the spatio-kinematic structure and physical conditions of the emerging H II around MWC 922 that is able to describe reasonably well the dominant features of our ALMA observations. As already noted in CSC+17, we note the extremely high sensitivity of the H30α maser line intensity (but also of the H39α transition) not only to small changes in the local physical conditions, but also to the uncertain bn departure coefficients. Thus, the biggest challenge is always reproducing simultaneously the maser and non-maser RRL transitions. In this section we discuss the uncertainties of some of the model parameters given in Table 2.
The central cavity
As shown by the data, and corroborated by our model, most of the free–free continuum and RRL emission at millimeter wavelengths arise in a compact ionized region within r ≲ 80–90 au (adopting d = 1.7 kpc). (The outermost least dense layers of the H II region, which are best traced at centimeter wavelengths, reach distances of ~200–300 au, as shown by Rodríguez et al. 2012.) The radius of the central cavity is uncertain, with values smaller than Rin ~ 25–30 au making it difficult to simultaneously reproduce the millimeter SED (in particular the free–free continuum becoming optically thin near ~ 1 mm) and the maps (in particular the spatial separation of the red- and blue-wing emitting clumps of the H30α transition). This is true even considering density gradients slightly shallower than the one adopted in our preferred model (Table 2).
We note that, in any case, the spherical cavity used in our model could well be an oversimplified representation of the density distribution of the innermost regions in the core of MWC 922, which could be a porous or sponge-like structure (or, alternatively, clumpy) or could accommodate one or more nonspherical cavities (e.g., finger-like holes or voids excavated in a denser environment maybe by the action of jets), among other possibilities. Additional observations of mm-RRLs at higher frequencies (Hnα with n < 30), ideally with high angular resolution, are needed for an accurate characterization of the innermost (≲30 au) regions of the core of MWC 922.
The temperature and density laws
For simplicity, we used an isothermal model (i.e., with no significant variation of Te across the different kinematic components of the ionized core). Under this assumption, the X-shaped morphology of the free–free continuum maps is dictated by the adopted density law, which is also the same for the disk and the wind(s) and was chosen to vary as a uniform function of the radialdistance to the center and the latitude. We have found satisfactory models using a range of radial power-law indexes, β ~ 2.5–2.9, and using amore steep or a less steep density decrease with the latitude, θ0 ~ 20°–60°.
Once asuitable density law was established, we varied Te to achieve a good compromise between the model predictions for the free–free continuum and the mm-RRLs, which are highly dependent on Te. The value of Te adopted here (~8000–9000 K) is slightly higher than that used in CSC+17 (~7000 K). We note that Te is especially uncertain and this difference should not be interpreted as a real time-variation of Te, but just as a consequence of the slightly different values of certain model parameters, particularly of the density distribution and the geometry. Our model indicates that the typical electron densities in the emitting layers are in the range ne ≈ 106–107 cm−3, with little uncertainty.
Disk and fast-wind aperture and kinematics
The opening angle or aperture of the disk is relatively well constrained by the X-shaped morphology of the continuum source deduced directly from the maps, with a range of values θa ~ 50°–70° yielding acceptable model predictions. The aperture of the fast wind is, however, relatively uncertain because this component is compact (particularly, across the wind) and is not fully spatially resolved. The final aperture adopted (θw ~ 38°) is optimal for the simple density law adopted in our model and reproduces reasonably well the shape and position of the peanut-like H30α wing-emitting regions. The ALMA maps of the H39α emission wings, although noisier, also show a peanut-like shape that is not reproduced well by our model (Figs. 5b and 9b). This could suggest that the density fall becomes shallower in the outer regions of the ionized core under study, which are better traced by H39α than by H30α due to opacity effects.
As already mentioned, the presence of radial expansion at the middle latitudes of the ionized core of MWC 922 is expected (based on what is observed in similar objects), but has not been firmly established from our data and model. This implies that the disk angular width is highly unconstrained, with any value from θd ~ 2° to ~20° being possible. Our model indicates that if the slow wind exists, then its average velocity is Vslow ≲ 15 km s−1, while the average expansion velocity of the fast wind is about 100 km s−1. Obviously, the different model components we used (the disk, the slow wind, and the fast wind) are most likely not separated by sharp boundaries. This means that there is most likely a gradual transition from pure rotation in the disk to fast expansion plus rotation in the high-velocity wind, maybe through a slow-expansion and rotation transition region at middle latitudes. Based on our data, a radial velocity gradient in the fast wind is also not ruled out, but in principle it is not necessary to explain the observations, which in any case trace a rather thin layer (~30–40 au) of ionized gas beyond the cavity.
The distance to the source
The distance to MWC 922 is probably the most uncertain parameter that affects the interpretation and modeling of the data. By default and for a better direct comparison with the model presented in CSC+17, we adopt a value for the distance of d = 1.7 kpc (Sect. 1). We also ran our model using the near kinematic distance, d = 3 kpc, as estimated in CSC+17. The model parameters that are different in the case of d = 3 kpc are specified in Table 2. We note that given the nonlinear behavior of the H30α maser, the density, the size of the cavity, and the rotation velocity field have been modified, and that the electron temperature (Te) has also been slightly readjusted to produce satisfactory predictions. As we show in “Position in the HR diagram” in Sect. 5.2, a value of the distance ~3 kpc enables a better agreement between the mass of the central star and the expected location of MWC 922 in the HR diagram (HRD) based on current single star post-main sequence evolutionary tracks.
5 Discussion
5.1 Massin the MWC 922 close environment
As we have seen, dust produces a dominant emission component in the far-IR and it has a non-negligible contribution of ~15–20% at 1 mm (Fig. 2). Since there is no missing flux in our ALMA data, the bulk dust thermal emission must arise in a rather compact region within a few hundred au of MWC 922, given the maximum recoverable scale of the ALMA configuration used in this work at 1 mm (~0.′′35, Sect. 2). The fit to the far-IR SED of MWC 922 by a modified blackbody (Sν ∝ ν2.1) is consistent with a major component of optically thin Td ~ 160 K dust emission with a grain emissivity frequency dependence as ~ ν1. Using the formulation described in Sánchez Contreras et al. (1998), among others, and adopting a dust emission flux at 230.9 GHz of ~35 mJy, we estimate that the total dust mass in MWC 922 is Md ~ 8 × 10⁻⁵ M⊙ (at d = 1.7 kpc). For a typical gas-to-dust mass ratio of ~100, we deduce a total mass of  ~ 8 × 10⁻³ M⊙ in the proximity of MWC 922. We note that the accuracy of our dust mass determination is limited by the uncertainties in the grain emissivity (to a factor of a few), which depends on the unknown composition and structure of the grains.
The total mass of ionized gas implied by the free–free continuum emission at millimeter wavelengths is MH II ~ 2 × 10⁻⁵ M⊙ (Table 2, d = 1.7 kpc), which is two orders of magnitude lower than  deduced above. This indicates that there may be a predominantly neutral gas component around MWC 922.
Part of this neutral gas component is indeed detected by means of first and second overtone CO transitions in the near IR (Wehres et al. 2017). Wehres et al. (2017) estimate a gas temperature of about 3000 K in the CO emitting region and conclude that this molecule lies in a disk or ring-like structure, surviving dissociation due to dust in the inner disk blocking the stellar UV radiation by the B[e] central star. These authors deduce a relatively low CO column density of ~1.7 × 1015 cm−2, which implies a H2 column density of ~8.5 × 1018 cm−2 adopting a typical CO-to-H2 fractional abundance of X(CO) = 2 × 10⁻⁴. Wehres et al. (2017) do not attempt to compute the total mass of hot molecule-rich gas traced by NIR CO emission ( ) probably because the dimensions of the CO emitting volume are unknown. In the following paragraph, we provide a crude estimation of the mass that suggests that
  probably represents only a very small fraction of the mass traced by the millimeter continuum dust emission, which is also true for MHII.
Adopting an average H2 density of ≈104–105 cm−3 in the hot CO emitting region and using the column density estimated by Wehres et al. (2017) we deduce that the size of the intervening CO-emitting region along the line of sight is probably Δr ≈ 1–10 au. We note that the density of the hot CO-emitting gas plausibly lies between the value in the central H II region studied here (~106–107 cm−3, Sect. 4) and that of the more extended surrounding nebulosity traced by numerous forbidden and permitted emission lines in the optical (in the range ≈10–104 cm−3; see Wehres et al. 2017; Bally & Chia 2019). If we assume that the hot CO gas is located in a hollow cylindrical structure with a representative inner radius of R, and a thickness (Δr) and a scale height h ~ Δr, then we deduce a total mass in this component of only  ≈ [10−7–10
![Mathematical equation: $^{-8}]\,{\times}\,\frac{R}{1000\,\textrm{au}}$](/articles/aa/full_html/2019/09/aa36057-19/aa36057-19-eq11.png) M⊙.
M⊙.
The radius of the hot CO ring is unknown since none of the slits used by Wehres et al. (2017) were oriented along the nebula equator. However, we believe that values much larger than ≈1000 au are unlikely since it would imply that the hot CO emission is reaching to, and coexisting with, the less dense and relatively extended optical/NIRnebulosity where the gas is known to be atomic and begins to be dissociated or ionized by the external (interstellar medium) UV radiation field (e.g., Tuthill & Lloyd 2007; Wehres et al. 2017; Bally & Chia 2019). The CO ring scale height, h, is also unlikely to be significantly larger than Δr since a verylong, thin-walled tubular structure would hardly remain stable. A severe upper limit of h < 1′′ (<1700 au at d = 1.7 kpc) is deduced from the observations, since the CO emission is not claimed to be spatially resolved by Wehres et al. (2017). Even in the case that our crude estimate of  is underestimated by 1–2 orders of magnitude, the total mass in the hot CO ring is probably lower than, or at most comparable to, the mass of the H II region.
We then conclude that the dust millimeter continuum emitting structure and the gas presumably contained in it5, 
 M⊙, is the dominant mass component in the close environment of MWC 922. As we show in the next subsection, this mass could give some insights into the evolutionary stage of this enigmatic source, in particular if it is (i) a young (pre-main sequence) star still enshrouded by its natal cloud or (ii) a main sequence or post-main sequence star experiencing mass transfer onto a companion.
5.2 Nature of MWC 922
Establishing the evolutionary stage of IR excess B[e] stars like MWC 922 is difficult using only their Teff and L⋆, since B[e] stars on the main sequence and in the pre- and post-main sequence stages cluster around the same region of the HR diagram. Here we list a number of arguments related to the amount of matter around the star that, in our opinion, make a pre-main sequence nature in the early stages of evolution improbable:
- (i)
The amount of material in the close environment of MWC 922 (
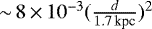
 ~ 8 × 10⁻³(
 )2 M⊙, Sect. 5.1) is too low compared to what it is generally observed in intermediate- and high-mass young stellar objects (YSOs; see, e.g., the review by Beltrán & de Wit 2016). In particular, for a ~10 M⊙ YSO the average disk mass is ≈1 M⊙ with the least massive disks being above 0.1 M⊙ in all cases reported to date (see Fig. 13 in Beltrán & de Wit 2016). If MWC 922 is located at a larger distance, e.g., d = 3 kpc, the mass in its close environment and at the center of the rotating disk would be
  ~ 0.025 M⊙ and ~18 M⊙, respectively.Such a massive YSO, however, again will be expected to have a more massive disk than observed, typically from a few solar masses to ~100 M⊙. The value of
 computed for MWC 922 would only be consistent with a low-mass YSO of less than 2–3 M⊙. However, the luminosity for such a low-mass YSO, log (L⋆/L⊙) ~ 1.5–2, would be orders of magnitude lower than the luminosity of MWC 922.
 - (ii)
As shown by our ALMA data and other previous works, MWC 922 is totally deprived of line emission from any molecular species, except for CO (to date only detected in the NIR, Wehres et al. 2017). This is again in marked contrast to what is observed in YSOs, which generally display a very rich molecular chemistry that includes, among many other species, complex organic molecules such as CH3OH, CH3CN (e.g., Beltrán & de Wit 2016, and references therein). The large variety of molecular species detected toward most YSOs is due to the fact that they are still enshrouded in the giant cold and dense molecular clouds where they were formed. However, there is no trace of a significant amount of cold, dense material surrounding MWC 922. The recent detection of a parsec-scale jet orthogonal to the equator at optical wavelengths (Bally & Chia 2019) indicates that such a jet has been traveling for ~3000 yr without anysign of strong interaction with ambient material. This represents yet another dissimilarity with typical YSOs, where jets surrounded by swept out molecular cavities are commonly observed (see, e.g., Arce, & Sargent 2006).
- (iii)
As we see in Sect. 5.4, the mass-accretion rate inferred from the mass-loss rate of the fast bipolar wind (assuming that typically ~10% of the accreted material is injected into the fast wind) is Ṁaccr ≈ 1 × 10⁻⁵ M⊙ yr−1, which is significantly lower (by 1–2 orders of magnitude) than that expected in a massive YSO (typically 10−4–10−3 M⊙ yr−1; see, e.g., Fig. 10 in Meyer et al. 2019, and also Fig. 17 in Beltrán & de Wit 2016). However, the mass-loss rate of the slow and fast winds deduced in this work are consistent within the uncertainties with the values generally observed in blue giant stars with a spectral type and luminosity comparable to that of MWC 922, especially, if it is located at d = 3 kpc, which would imply L⋆ ~ 5.9 × 10⁴ L⊙ (e.g., Meynet et al. 2015, see the blue-shaded region in their Fig. 1).
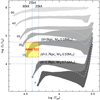 |
Fig. 10 Figure adapted from Fig. 6 in Martins et al. (2005) showing the position of MWC 922 in the HR diagram (inside the yellow box) together with the envelopes of evolutionary paths for M⋆ = 7, 9, 15, 20, 25, 40, and 60 M⊙ stars taking into account the different codes studied by these authors. The horizontal dotted lines show the luminosity of MWC 922 adopting different values of d; the upper limit to the stellar mass deduced from the central mass inside of the rotating disk at different d is also indicated. |
Position in the HR diagram
One crucial parameter used to constrain the nature of MWC 922 is the mass of the object at the center of the rotatingdisk. Although the effective temperature and luminosity of MWC 922 are uncertain, we can compare the location of this object in the HR diagram (HRD) with the post-main sequence evolutionary tracks of massive stars. In particular, we aim to test whether such a position is consistent with a stellar mass M⋆ ≲ 10 or ≲18 M⊙ adopting d = 1.7 and 3 kpc, respectively, as deduced from the ALMA data (Sect. 4). As already mentioned, the upper limit arises because the central source can be a binary or multiple system.
We used the set of different evolutionary tracks compiled and jointly evaluated by Martins et al. (2005), which are reproduced in Fig. 10. As we can see in this figure, evolutionary tracks for <10 M⊙ stars lie well below the HRD box defined by the probable ranges for the effective temperature and luminosity of MWC 922. This makes a mass of M⋆ ≲ 10 M⊙, and thus a distance of d ~ 1.7 kpc, improbable for MWC 922. Adopting a lower value of the distance to match the luminosity of a less massive star (e.g., a ~9 M⊙ with log (L⋆/L⊙) ~ 4, which wouldimply d ~ 1.3 kpc) does not help to explain this inconsistency because the upper limit to the stellar mass consistent with the rotating disk observed will be correspondingly lower (M⋆ < 7.6 M⊙ at d ~ 1.3 kpc), implying again evolutionary tracks shifted downwards from MWC 922.
As we see in Fig. 10, the HRD position of MWC 922 is most consistent with a M⋆ ~ 15 M⊙ star, which is fully compatible with the upper limit to the stellar mass derived adopting the near kinematic distance, M⋆ ≲ 18 M⊙. For a distance d ~ 3 kpc, the luminosity of MWC 922, log (L⋆/L⊙) ~ 4.8, would be most consistent with a star that has recently left the main sequence and is entering the blue giant stage. This would imply an age of ~10 Myr. If this is correct, MWC 922 could be very similar to the B[e] star MWC 137, a slightly more massive B[e] supergiant with a confirmed evolved nature based on the 13CO/12CO ratio (Oksala et al. 2013), which also shows similar properties to MWC 922, including a parsec-scale jet emerging from the center (Mehner et al. 2016). The morphology of the circumstellar nebulosity around MWC 922 (squared or biconical) and MWC 137 (roughly elliptical) is quite different, however, which is probably related to the different properties of the central binary system and the way the stars interact and transfer mass.
Assuming a post-main sequence nature, the rotating disk and fast bipolar ejections found almost certainly require the presence of a companion to MWC 922. Therefore, since MWC 922 could not be following the evolutionary tracks of single stars, a different stellar mass cannot be totally ruled out. Also, the mass of the central object deduced from the disk rotation is also somewhat uncertain (by 20–30%, if our hypothesis of Keplerian rotation is true, or higher if it is not). Therefore, we take with caution the conclusion about the stellar mass presented above. For this reason, throughout this paper we show the results from the two most likely values of the distance, d = 1.7 kpc, commonly accepted in the literature and used in our original model reported in CSC+17, and d = 3 kpc, the near kinematic distance to MWC 922, which enables the best reconciliation of its HRD position with the value we inferred for the upper limit to M⋆.
Considering the uncertainties in the evolutionary models (Martins et al. 2005) and in the values of Teff, L⋆, and M⋆, we do not rule out that MWC 922 is a member of the FS CMa class, as proposed by Miroshnichenko (2007) for other unclassified B[e] stars. FS CMa stars are believed to be binary systems currently undergoing a phase of rapid mass exchange composed of one main sequence star and a compact companion. More recently, de la Fuente et al. (2015) have proposed that FS CMa stars could be post-merger products that still retain part of the dusty ejection in the shape of a disk.
Finally, in CSC+17 we showed that the Teff and L⋆ of MWC 922 could be, in principle, consistent with a post-AGB star evolved from a massive progenitor (>5–10 M⊙ in the main sequence). However, in view of the small amount of material in the stellar surroundings deduced in this paper (Sect. 5.1), we now believe this is improbable. This is because in a post-AGB stage the star should have already ejected most of its initial mass (mainly during the AGB phase in the form of a slow, dense wind). Since for massive stars the AGB-to-PN transition happens very quickly, possibly in a few decades and certainly in less than a few hundred years (e.g., Miller Bertolami 2016), we should observe at least a fraction of the few M⊙ expected in the circumstellar envelope. A significant amount of molecular gas is indeed found even in well-developed, few thousand years old PNe with hot (Teff ≈ 105 K) central stars, e.g., NGC 7027 or NGC 6302 (Huang et al. 2010; Santander-García et al. 2017).
5.3 Ionizing central source
Our code MORELI computes the number of Lyman continuum photons emitted per second (NLyC) needed to reproduce the free–free and mm-RRL emission observed. The value found, log NLyC ~ 46.9 s−1, has been compared with those obtained from the grid of model atmospheres of early B-type stars by Lanz & Hubeny (2007) to investigate the central ionizing source. We find that a Teff ~ 30 kK star (with R⋆ ~ 5 R⊙, adopting L⋆ ~ 1.8 × 10⁴ L⊙ at 1.7 kpc) is able to produce the ionization observed even if it is near the main sequence (i.e., if we adopt the values of q0 = log NLyC for a star with asurface gravity of log g = 4 cm s−2). If the star is a blue giant star (log g = 3 cm s−2), then the NLyC inferred can also be accounted for at lower stellar temperatures, Teff ≳ 25 kK (R⋆ ≲ 7 R⊙).
Assuming that the mass at the center of the rotating disk (~10 M⊙) is that of the star, then the stellar surface gravity is log g ~ 3.7–4.0 for the range of temperatures Teff ~ 25–30 kK (and adopting the stellar radius R⋆ computed from L⋆ = 4πR⋆2σTeff4). The gravity values obtained suggest a star that is on the main sequence or has just left it (i.e., a young post-main sequence star).
We performed the same exercise adopting a distance to the source of d = 3 kpc, for which the central mass inferred from the observations and the model is ~18 M⊙. In this case, a Teff ~ 25–30 kK star (with R⋆ = 13–9 R⊙ and L⋆ = 5.8 × 10⁴ L⊙), with log g ~ 3.5–3.8, will also be able to produce the amount of NLyC needed. The values of the gravity deduced in this case suggest a post-main sequence nature.
We note that there are several uncertainties on the estimations presented above. First, the central mass inside the rotating disk is an upper limit to the mass of the ionizing star since there could be a binary (or even multiple) system at the core. The presence of a binary is indeed the most likely scenario to explain the formation of a rotating disk if MWC 922 is not a YSO (Sect. 5.1). In the case of a lower mass for the central star, then the gravity would be also lower, with the subsequent increase in q0 = log NLyC from the model atmospheres even for stars with slightly lower values of Teff. We note that the distance to MWC 922, and thus its luminosity, is rather uncertain. In addition, we cannot rule out that the B[e] star MWC 922 is slightly cooler than Teff ~ 25–30 kK (as deduced above) since part of the ionization could be produced by shocks resulting from the interaction between the fast ~100 km s−1 bipolar wind with the ambient material.
For these reasons, we still consider in our discussion a conservative range of Teff ~ 20–30 kK for MWC 922.
5.4 Winds emerging from MWC 922
The fast bipolar wind
The presence of rotation in the fast bipolar wind emerging from MWC 922 is one of the most interesting results from this work. To our knowledge there are no other fast (≳100 km s−1) bipolar outflows with compelling observational evidence for rotation. Rotation in slower winds, however, has been found in a handful of objects (e.g., Lee et al. 2008; Martín-Pintado et al. 2011; Burns et al. 2015; Bujarrabal et al. 2016; Hirota et al. 2017). Among these, MWC 349A is the source with the fastest rotating wind, with a radial expansion velocity of ~60–70 km s−1 (Martín-Pintado et al. 2011).
The rotation in the fast wind of MWC 922 takes place in the same sense as in the disk, which suggests (i) that there is a causal connection between the two (e.g., that the wind is launched via a disk-mediated mechanism from the rotating disk) or (ii) that the two components have a common underlying origin.
The launching radius of the fast wind is constrained by our ALMA maps to ≲29 au (adopting d = 1.7 kpc). This value is smaller than the gravitational radius for a central mass of M⋆, rg ~ 84 au × (8750 K/Te)(M*/10 M⊙), which implies that the fast wind is not simply photoevaporating from the inner rim of the disk. The same conclusion holds adopting d = 3 kpc after appropriately scaling of the launching radius and rg. This result was somewhat expected since a high velocity of the fast wind is also not contemplated in case of photoevaporation, which would happen with a velocity comparable to the sound speed of the gas in the disk (cs ≲ 10 km s−1, for the values of Te deduced, Table 2). The high velocity of the fast wind suggests that it is launched much closer to the central system, well inside the inner rim of the ionized disk traced by our observations. Since the velocity of the wind is typically similar to (or slightly higher than) the escape velocity at the launching site, the launching radius is probably ≲2 au (≲3.5 au) for a central mass of ~10 M⊙ (~18 M⊙), adopting d = 1.7 kpc (d = 3 kpc).
We cannot rule out that the rotating disk observed represents the outer counterpart of a more compact disk component with a dominant role in the launch of the fast wind, maybe by a magneto-centrifugal launching mechanism, as has been proposed for MWC 349A (Martín-Pintado et al. 2011) and the massive YSO candidate Orion Source I (Hirota et al. 2017). However, we believe that it is unlikely that the disk layers that are actively participating in this process are the ones probed by our ALMA observations, which are relatively distant from the center (>[30–120] au).
au).
The fast bipolar wind and the rotating disk of MWC 922 could both be the outcomes of a common underlying physical process (scenario ii above). For example, in the case of a mass-exchanging binary system composed of a mass-losing blue giant (presumably the B[e] star MWC 922) and a compact companion, the rotating ~30–100 au-scale disk observed could represent a circumbinary disk formed as a result of angular momentum transfer from the binary orbital motion to the slow wind of the mass-losing star. This is indeed the case of the Red Rectangle (Bujarrabal et al. 2013) and all post-AGB stars with rotating disks spatially and spectrally resolved to date (Bujarrabal et al. 2013, 2017, 2018; Sánchez Contreras et al. 2018, and references therein). In this scenario, the fast wind would be launched not from the surface of the circumbinary disk, but from the unseen accretion disk around the companion. Circumbinary disks and accretion disks (around the secondary) are conspicuously found in numerical simulations of interacting binary systems (e.g., Mastrodemos & Morris 1998; Liu et al. 2017; Chen et al. 2017; Saladino et al. 2019, and references therein).
The mass-loss rate in the fast wind is uncertain since this component is barely spatially resolved, and thus its detailed morphology and density distribution are not optimally constrained. From our model we deduce a mass-loss rate of Ṁfast ~ [2 −−4] × 10−6 M⊙ yr−1 (adopting d = [1.7–3] kpc, Table 2). Assuming that the accretion rate is typically a factor of ~10 higher than the mass-loss rate of the wind (e.g., Beltrán & de Wit 2016; Meyer et al. 2019), matter could be falling into the compact companion at a rate of Ṁaccr ≈ 10−5 M⊙ yr−1. For an average expansion velocity of the fast wind of ~95 km s−1, the dynamical age of its innermost layers is only ~1.5 or 2.6 yr (at d = 1.7 or 3 kpc, respectively).
The slow wind
Although radial expansion at intermediate latitudes (between ~30° and 52°) is not strictly necessary to reproduce our ALMA observations, our data are consistent with the presence of a slow (≲15 km s−1) wind emanating from ionized disk, as observed in the Red Rectangle and other objects with rotating disks (e.g., Bujarrabal et al. 2013, 2017, 2018). Assuming that a slow wind is present, we deduce a mass-loss rate of Ṁslow ~ [3 −−6] × 10−7 M⊙ yr−1 in its innermost layers, at ~[29–51] au (Table 2), ejected only ![Mathematical equation: $\sim[15--27]\,{\times}\,\frac{9\,\textrm{km\,s}^{-1}}{{V_{\textrm{slow}}}}$](/articles/aa/full_html/2019/09/aa36057-19/aa36057-19-eq20.png) yr ago.
yr ago.
Since the total mass in the close environment of MWC 922 obtained from the dust millimeter continuum emission is about  ~ 8
~ 8 M⊙, the reservoir of material in the stellar surroundings will probably dissipate in ~[3–4] × 104 yr (or less if the mass-loss rate continues increasing as suggested by the density law inferred, which is steeper than an inverse square function). If the aperture of the slow wind is larger than adopted, for example, if it reaches down to the surface of the neutral disk (i.e., θd = 0°, Fig. 6) then the mass-loss rate needed to explain the observations is ~25% higher, implying a correspondingly shorter disk dissipation time. The lifetime of the disk is moderately short, but this type of source is rare, so there is no contradiction. Moreover, if there is a continuous matter supply into the disk (for example, from a mass-losing giant star in a mass-exchanging binary system), the dissipation time could be longer.
6 Conclusions
In 2017, we mapped with ALMA the inner layers (r ≲ 0.′′06, i.e., within one or two hundred au) of the ultracompact H II region around the far-IR excess B[e] star MWC 922. We imaged for the first time the continuum and the H30α and H39α line emission in bands 6 and 3 with spatial resolution down to ~0.′′03 and ~0.′′06, respectively. The high sensitivity of ALMA also led to the first detection of H51ɛ, H55γ, and H63δ emission in this source. We modeled our data using the non-LTE radiative transfer code MORELI, which enabled us to constrain the morphology,kinematics, and physical conditions at the core of this outstanding object. In the following, we summarize our observational and modeling results:
-
Our continuum maps show a pinched-waist square morphology reminiscent of the NIR nebula observed at much larger angular scales. This shape is consistent with the free–free emission arising in a biconical shell inscribed in a larger, and predominantly neutral, rotating disk that is illuminated and photoionized by the central source (as hypothesized in CSC+17). Our current model of the core of MWC 922 corroborates that, indeed, the shape of the continuum maps stands for an underlying X-shaped morphology.
-
We have computed the slope of the continuum spectrum in the 1 and 3 mm bands using data from individual spectral windows. This suggests a previously unreported flattening of the free–free continuum spectrum around 1 mm (after dust emission subtraction) that would imply a transition from optically thick to optically thin free–free emission near ~2 mm.
-
As expected, the H30α and H39α line emissions arise from a region that is comparable, in shape and dimensions, to the continuum-emitting area. The pronounced double-peaked profile and high intensity of the H30α transition denotes the maser nature of this line, as already known (CSC+17). We observe an overall brightening, a slight profile broadening, and a notable increase in the asymmetry between the blue and the red peak of the H30α profile relative to our single-dish observations of this transition performed two years earlier (CSC+17). The single-peaked profile of the H39α transition, with a much less prominent maser amplification, has not varied significantly. The changes in the H30α profile can be attributed to variations with time in the physical properties within the emitting volume, which are nonlinearly amplified in a significant amount given the maser nature of this line.
-
Our ALMA line maps have provided direct observational confirmation of rotation in a nearly edge-on disk. The inner rim of the disk is at ~29
 au where the gas is rotating at a velocity of ~18 km s−1. Assuming Keplerian rotation, we infer a central mass inside the disk of ~10 and ~18 M⊙ adopting a distance to MWC 922 of d = 1.7 and 3 kpc, respectively.
 -
Our data reveal the presence of a fast (~100 km s−1) bipolar ejection orthogonal to the disk. In the H30α maps, with the highest S/N, we identify a velocity gradient perpendicular to the outflow axis, which is a clear sign for rotation in the fast wind. This is confirmed by our model. To our knowledge, there are no other fast (≳100 km s−1) bipolar outflows with compelling observational evidence of rotation in the literature.
-
We present in Sect. 4 and Table 2 a model for the ionized core of MWC 922 that satisfactorily reproduces our ALMA continuum and mm-RRL maps. In addition to the rotating disk and the fast bipolar outflow, there may be a slow (≲15 km s−1) wind emanating from the disk. The presence of a central cavity with radius ~29–51 au (d = 1.7–3 kpc) is needed in our model to reproduce the free–free continuum spectrum flattening near 2 mm and the surface brightness depression at the center in the continuum and mm-RRL maps.
-
We estimate average electron temperatures of Te ~ 8000–11 000 K and densities in the range ne ≈ 107–106 cm−3 in the ionized core of MWC 922. A density radial law ne ∝ r−2.7, and a smooth variation with the latitude (decreasing from the disk outer boundary to the poles) is inferred. The density radial law could be slightly shallower than adopted, as suggested by the H39α cubes, which show that the emission from this transition arises at slightly larger distances from the center than predicted by our model.
-
We deduce a mass-loss rate of the fast bipolar wind of Ṁfast ~ few × 10−6 M⊙ yr−1. Assuming that a slow wind is also present at intermediate latitudes (i.e., bridging the ionized surface of the rotating disk and the fast bipolar wind), we obtain a mass-loss rate of Ṁslow ~ few × 10−7 M⊙ yr−1. The dynamical age of the winds traced by our observations is a few decades at most, with the innermost layers of the fast wind (at ~29–51 au) ejected just ~1.5–2.6 yr ago.
-
The total ionized mass deduced from the free–free continuum emission at millimeter wavelengths is MHII ~ 2 ×
 M⊙. The dominant mass component in the close environment of MWC 922 is probably that probed by the ~160 K dust millimeter continuum emission, from which we deduce
  ~ 8
~ 8 M⊙.
M⊙. -
In Sect. 5 we discuss the evolutionary status of MWC 922 from different perspectives and provide a number of arguments that favor a post-main sequence stage. We believe that MWC 922 could be a ~15 M⊙ blue giant (with Teff ~ 20–30 kK and L⋆ ~ 5.9 × 10⁴ L⊙) located at d ~ 3 kpc that has recently left the main sequence (~10 Myr ago) and is probably undergoing a phase of mass exchange with an unseen companion.
Acknowledgements
We thank the referee, Eric Lagadec, for his comments. This paper makes use of the following ALMA data: ADS/JAO.ALMA#2016.1.00161.S and ADS/JAO.ALMA#2017.1.00376.S. ALMA is a partnership of ESO (representing its member states), NSF (USA), and NINS (Japan), together with NRC (Canada), MOST, and ASIAA (Taiwan), and KASI (Republic of Korea), in cooperation with the Republic of Chile. The Joint ALMA Observatory is operated by ESO, AUI/NRAO, and NAOJ. The data here presented have been reduced using CASA (ALMA default calibration software; https://casa.nrao.edu); data analysis was made using the GILDAS software (http:// www.iram.fr/IRAMFR/GILDAS). This work has been partially supported by the Spanish MINECO through grants AYA2016-75066-C2-1-P, AYA2016-78994-P, ESP2015-65597-C4-1-R, and ESP2017-86582-C4-1-R, and by the European Research Council through ERC grant 610 256: NANOCOSMOS. This research has made use of the JPL Molecular Spectroscopy Catalog, the Cologne Database for Molecular Spectroscopy, the SIMBAD database operated at CDS (Strasbourg, France), the NASA Astrophysics Data System, and Aladin.
Appendix A Additional figures
The Band 3and Band 6 continuum emission maps of MWC 922 obtained with 15 and 30 mas-resolution, respectively,are shown in Fig. A.1. We note the X-shaped morphology, reminiscent of that of the near-IR andmid-IR nebulosities around MWC 922 (Sect. 1). The predictions from our model, which is described in Sect. 4 and is schematically represented in Fig. 6, are shown in Fig. A.2 with the same angular resolution. The equatorial plane of the disk is oriented along PA ~ 45°.
The velocity-channel maps of the H30α and H39α lines towards MWC 922 are presented in Figs. A.3 and A.4, respectively.
In Fig. A.5 a summary of the observational results for the weak non-α mm-RRLs detected in MWC 922 together with our model predictions is offered.
In Figs. A.6 and A.7 we summarize the comparison between data and model for the H30α and H39α transitions with super-resolution (15 and 30 mas, respectively). For H30α, we also display the predictions given by a model where rotation has been suppressed in the fast wind to show that when there is no rotation of the fast wind, the peaks of the red- and blue-wing (peanut-like) emitting regions collapse on the revolution axis (δx), i.e., the velocity gradient across the fast wind dissapears (Fig. A.6b, bottom row).
Super-resolution images of the observations and model for the H39α line are also shown in Fig. A.7. Given the lower S/N, the rotation of the fast wind is not evident in these maps.
We note the remarkable asymmetry of the blue-emission peak of the H30α maser line with respect to the equatorial plane (y-axis) in the observations (Fig. A.6c, top row). This asymmetry does not have a counterpart in the H39α emission maps, which are rather symmetric about both axes (Fig. A.7c, top row), and is also not reproduced by our model. This difference denotes again the nonlinear response of the H30α maser line to smalldeviations from axial symmetry of the physical conditions in the emitting regions.
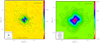 |
Fig. A.1 Maps of the continuum emission adjacent to the H30α (231.9 GHz) and H39α (106.7 GHz) lines with super-resolution. Contour levels are at 1, 2, 3, 5%, and from 10to 100% in steps of 10% of the peak (28.5 and 30.6 mJy beam−1 at 1 and 3 mm,respectively). |
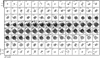 |
Fig. A.3 ALMA velocity-channel maps of the H30α line in MWC922. The beam is 0.′′032 × 0.′′022, PA = 73° (bottom left corner of the last panel). Level contours are 2.5 × 2(i−1) mJy beam−1, for i = 1,2,3,... |
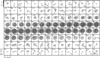 |
Fig. A.4 ALMA velocity-channel maps of the H39α line in MWC922. The beam is 0.′′076 × 0.′′058, PA = −104° (bottom left corner of the last panel). Level contours are 2.5 × 2(i−1) mJy beam−1, for i = 1,2,3,... |
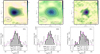 |
Fig. A.5 Other mm-RRLs detected with ALMA: H55γ, H63δ, and H51ɛ. Maps (natural weighting) integrated over the VLSR = [−3.5:82] km s−1 range (top) and spectral profiles (bottom) are shown together with the predictions (in pink) from our model (Sect. 4 and Table 2). |
As already mentioned (Sect. 4), our model does not reproduce the central emission dip of the H39α emission maps at high velocities (Fig. A.7b). This suggests that the H39α emission arises in regions more distant from the center than predicted by our model, which could indicate a density radial distribution slightly shallower than adopted in the outer layers of the H II region best traced by this transition.
A.1 Additional non-mm-RRLs detections
In Band 6 we observed, simultaneously with the H30α and H51ɛ lines, the 12CO (2–1) transition, which has been detected in absorption against the compact continuum source of MWC 922 (Fig. A.8). The two narrow (~2–3km s−1) absorption features detected with ALMA are centered at VLSR = −0.5 and +5.5 kms−1, consistent with foreground ISM absorption. No trace of 12CO (2–1) emission is found around the systemic velocity of MWC 922 (VLSR ~ 32–33 km s−1). Additional ISM 12CO (2–1) emission features were previously detected towards MWC 922 with the IRAM-30 m single-dish telescope (CSC+17), but these are filtered out in our interferometric data. No other molecules (e.g., 13CO (1–0) included in Band 3) are detected in absorption or in emission in these ALMA observations.
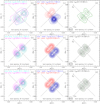 |
Fig. A.6 Same as in Fig. 3(b–d) but showing the H30α super-resolution (15 mas) maps (top) and the predictions from our model (Table 2, second row) and a model with no rotation in the fast wind (third row). |
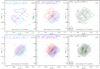 |
Fig. A.7 Same as in Fig. 5(b–d), but showing the H39α super-resolution (30 mas) maps (top) and model. |
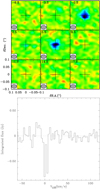 |
Fig. A.8 Top: 12CO (2–1) velocity-channel maps around the narrow absorption ISM feature detected. Beam is 0.′′ 04 × 0.′′03, PA = 89°. Level spacing is 3 mJy beam−1. Bottom: 12CO (2–1) spectrum towards the center of MWC 922. |
References
- Abraham, Z., Falceta-Gonçalves, D., & Beaklini, P. P. B. 2014, ApJ, 791, 95 [NASA ADS] [CrossRef] [Google Scholar]
- Aleman, I., Exter, K., Ueta, T., et al. 2018, MNRAS, 477, 4499 [NASA ADS] [CrossRef] [Google Scholar]
- Arce, H. G., & Sargent, A. I. 2006, ApJ, 646, 1070 [NASA ADS] [CrossRef] [Google Scholar]
- Báez-Rubio, A., Martín-Pintado, J., Thum, C., & Planesas, P. 2013, A&A, 553, A45 [NASA ADS] [CrossRef] [EDP Sciences] [Google Scholar]
- Báez-Rubio, A., Martín-Pintado, J., Rico-Villas, F., & Jiménez-Serra, I. 2018, ApJ, 867, L6 [NASA ADS] [CrossRef] [Google Scholar]
- Balick, B., & Frank, A. 2002, A&ARv, 40, 439 [Google Scholar]
- Bally, J., & Chia, Z. H. 2019, MNRAS, 484, 4529 [NASA ADS] [CrossRef] [Google Scholar]
- Beltrán, M. T., & de Wit, W. J. 2016, A&ARv, 24, 6 [NASA ADS] [CrossRef] [Google Scholar]
- Bujarrabal, V., Castro-Carrizo, A., Alcolea, J., et al. 2013, A&A, 557, L11 [NASA ADS] [CrossRef] [EDP Sciences] [Google Scholar]
- Bujarrabal, V., Castro-Carrizo, A., Alcolea, J., & Van Winckel, H. 2015, A&A, 575, L7 [NASA ADS] [CrossRef] [EDP Sciences] [Google Scholar]
- Bujarrabal, V., Castro-Carrizo, A., Alcolea, J., et al. 2016, A&A, 593, A92 [NASA ADS] [CrossRef] [EDP Sciences] [Google Scholar]
- Bujarrabal, V., Castro-Carrizo, A., Alcolea, J., et al. 2017, A&A, 597, L5 [NASA ADS] [CrossRef] [EDP Sciences] [Google Scholar]
- Bujarrabal, V., Castro-Carrizo, A., Van Winckel, H., et al. 2018, A&A, 614, A58 [NASA ADS] [CrossRef] [EDP Sciences] [Google Scholar]
- Burns, R. A., Imai, H., Handa, T., et al. 2015, MNRAS, 453, 3163 [NASA ADS] [CrossRef] [Google Scholar]
- Chen, Z., Frank, A., Blackman, E. G., et al. 2017, MNRAS, 468, 4465 [NASA ADS] [CrossRef] [Google Scholar]
- Cohen, M., Anderson, C. M., Cowley, A., et al. 1975, ApJ, 196, 179 [NASA ADS] [CrossRef] [Google Scholar]
- Cox, P., Martin-Pintado, J., Bachiller, R., et al. 1995, A&A, 295, L39 [NASA ADS] [Google Scholar]
- de la Fuente, D., Najarro, F., Trombley, C., et al. 2015, A&A, 575, A10 [NASA ADS] [CrossRef] [EDP Sciences] [Google Scholar]
- Gordon, M. A., Holder, B. P., Jisonna, L. J., Jr., Jorgenson, R. A., & Strelnitski, V. S. 2001, ApJ, 559, 402 [NASA ADS] [CrossRef] [Google Scholar]
- Hirota, T., Machida, M. N., Matsushita, Y., et al. 2017, Nat. Astron., 1, 0146 [Google Scholar]
- Homan, W., Richards, A., Decin, L., et al. 2017, A&A, 601, A5 [NASA ADS] [CrossRef] [EDP Sciences] [Google Scholar]
- Huang, Z.-Y., Hasegawa, T. I., Dinh-V-Trung, et al. 2010, ApJ, 722, 273 [NASA ADS] [CrossRef] [Google Scholar]
- Jiménez-Serra, I., Martín-Pintado, J., Báez-Rubio, A., Patel, N., & Thum, C. 2011, ApJ, 732, L27 [NASA ADS] [CrossRef] [Google Scholar]
- Jiménez-Serra, I., Báez-Rubio, A., Rivilla, V. M., et al. 2013, ApJ, 764, L4 [NASA ADS] [CrossRef] [Google Scholar]
- Jura, M., Balm, S. P., & Kahane, C. 1995, ApJ, 453, 721 [NASA ADS] [CrossRef] [Google Scholar]
- Kervella, P., Homan, W., Richards, A. M. S., et al. 2016, A&A, 596, A92 [NASA ADS] [CrossRef] [EDP Sciences] [Google Scholar]
- Kuhn, M. A., Hillenbrand, L. A., Sills, A., et al. 2019, ApJ, 870, 32 [Google Scholar]
- Lagadec, E., Verhoelst, T., Mékarnia, D., et al. 2011, MNRAS, 417, 32 [NASA ADS] [CrossRef] [Google Scholar]
- Lanz, T., & Hubeny, I. 2007, ApJS, 169, 83 [CrossRef] [Google Scholar]
- Lee, C.-F., Ho, P. T. P., Bourke, T. L., et al. 2008, ApJ, 685, 1026 [NASA ADS] [CrossRef] [Google Scholar]
- Liu, Z.-W., Stancliffe, R. J., Abate, C., et al. 2017, ApJ, 846, 117 [NASA ADS] [CrossRef] [Google Scholar]
- Martin-Pintado, J., Thum, C., & Bachiller, R. 1989b, A&A, 222, L9 [NASA ADS] [Google Scholar]
- Martin-Pintado, J., Bachiller, R., Thum, C., & Walmsley, M. 1989a, A&A, 215, L13 [NASA ADS] [Google Scholar]
- Martín-Pintado, J., Thum, C., Planesas, P., & Báez-Rubio, A. 2011, A&A, 530, L15 [NASA ADS] [CrossRef] [EDP Sciences] [Google Scholar]
- Martins, F., Schaerer, D., & Hillier, D. J. 2005, A&A, 436, 1049 [NASA ADS] [CrossRef] [EDP Sciences] [Google Scholar]
- Mastrodemos, N., & Morris, M. 1998, ApJ, 497, 303 [NASA ADS] [CrossRef] [Google Scholar]
- Mehner, A., de Wit, W. J., Groh, J. H., et al. 2016, A&A, 585, A81 [NASA ADS] [CrossRef] [EDP Sciences] [Google Scholar]
- Meyer, D. M.-A., Haemmerlé, L., & Vorobyov, E. I. 2019, MNRAS, 484, 2482 [NASA ADS] [CrossRef] [Google Scholar]
- Meynet, G., Chomienne, V., Ekström, S., et al. 2015, A&A, 575, A60 [NASA ADS] [CrossRef] [EDP Sciences] [Google Scholar]
- Miller Bertolami, M. M. 2016, A&A, 588, A25 [NASA ADS] [CrossRef] [EDP Sciences] [Google Scholar]
- Miroshnichenko, A. S. 2007, ApJ, 667, 497 [NASA ADS] [CrossRef] [Google Scholar]
- Molinari, S., Schisano, E., Elia, D., et al. 2016, A&A, 591, A149 [NASA ADS] [CrossRef] [EDP Sciences] [Google Scholar]
- Oksala, M. E., Kraus, M., Cidale, L. S., et al. 2013, A&A, 558, A17 [NASA ADS] [CrossRef] [EDP Sciences] [Google Scholar]
- Ramos-Medina, J., Sánchez Contreras, C., García-Lario, P., et al. 2018, A&A, 611, A41 [NASA ADS] [CrossRef] [EDP Sciences] [Google Scholar]
- Rodríguez, L. F., & Bastian, T. S. 1994, ApJ, 428, 324 [NASA ADS] [CrossRef] [Google Scholar]
- Rodríguez, L. F., Báez-Rubio, A., & Miroshnichenko, A. S. 2012, Rev. Mex. Astron. Astrofis., 48, 47 [NASA ADS] [Google Scholar]
- Rudy, R. J., Erwin, P., Rossano, G. S., & Puetter, R. C. 1992, ApJ, 398, 278 [NASA ADS] [CrossRef] [Google Scholar]
- Sánchez Contreras, C., Alcolea, J., Bujarrabal, V., & Neri, R. 1998, A&A, 337, 233 [NASA ADS] [Google Scholar]
- Sánchez Contreras, C., Báez-Rubio, A., Alcolea, J., Bujarrabal, V., & Martín-Pintado, J. 2017, A&A, 603, A67 [NASA ADS] [CrossRef] [EDP Sciences] [Google Scholar]
- Sánchez Contreras, C., Alcolea, J., Bujarrabal, V., et al. 2018, Galaxies, 6, 94 [NASA ADS] [CrossRef] [Google Scholar]
- Santander-García, M., Bujarrabal, V., Alcolea, J., et al. 2017, A&A, 597, A27 [NASA ADS] [CrossRef] [EDP Sciences] [Google Scholar]
- Saladino, M. I., Pols, O., & Abate, C. 2019, A&A, 626, A68 [NASA ADS] [CrossRef] [EDP Sciences] [Google Scholar]
- Storey, P. J., & Hummer, D. G. 1995, MNRAS, 272, 41 [NASA ADS] [CrossRef] [Google Scholar]
- Thum, C., Martin-Pintado, J., & Bachiller, R. 1992, A&A, 256, 507 [NASA ADS] [Google Scholar]
- Tuthill, P. G., & Lloyd, J. P. 2007, Science, 316, 247 [NASA ADS] [CrossRef] [Google Scholar]
- Waters, L. B. F. M., Cami, J., de Jong, T., et al. 1998, Nature, 391, 868 [NASA ADS] [CrossRef] [Google Scholar]
- Wehres, N., Ochsendorf, B. B., Tielens, A. G. G. M., et al. 2017, A&A, 601, A69 [NASA ADS] [CrossRef] [EDP Sciences] [Google Scholar]
The Ser OB1 association belongs to the open galactic cluster Messier 16, for which a distance of 1.74 pc has been derived from Gaia DR2 (Kuhn et al. 2019).
Turbulence was considered to be negligible in our pilot study, CSC+17.
The existence of this gas is not clear since the conditions in the disk are unknown.
All Tables
Central frequency, bandwidth, velocity resolution, spectral lines, and continuum fluxes in the different spectral windows.
All Figures
|
Fig. 1 Maps of the continuum emission adjacent to the H30α (231.9 GHz) and H39α (106.7 GHz)lines. Contour levels are at 1, 2, 3, and 5%, and from 10 to 100% in steps of 10% of the peak (53.0 and 54.5 mJy beam−1 at 1 and 3 mm,respectively). The central cross marks the 3 mm-continuum surface brightness peak. |
| In the text | |
|
Fig. 2 Left: SED of MWC 922 as in CSC+17, after adding PACS and SPIRE data (Molinari et al. 2016; Ramos-Medina et al. 2018), and including our ALMA continuum flux measurements (cyan, Table 1). Right: ALMA millimeter-continuum fluxes before (black) and after (blue) subtraction of the ~162 K dust emission contribution (dotted line in left panel). The red stars represent single-dish IRAM-30 m data (CSC+17). |
| In the text | |
|
Fig. 3 Summary of ALMA data of the H30α line (see also Fig. A.3). Top, panel a: integrated spectrum of the H30α line obtained with ALMA (black lines) and with the IRAM-30 m antenna (gray histogram, CSC+17). The colored hatched regions indicate the different velocity intervals used to generate the maps in panels b–d. The ALMA profile multiplied by a factor of 10 (dotted line) is overplotted for a clearer view of the broad line wings. Panels b–d: we show the H30α emission maps integrated over the line wings, the peaks, and the valley, respectively. Bottom: position velocity cuts of the H30α line through the center of MWC 922 along the disk plane (left, PA = 45°) and the perpendicular direction (right). Levels are 2.5, 5, 7.5, 10, 20, and then from 50 to 1700 in steps of 75 mJy beam−1. |
| In the text | |
|
Fig. 4 Position-velocity (PV) cuts of the H30α line along the direction of the equator (PA = 45°) at different δx offsets (δx = −0.′′046, δx = −0.′′023, δx = 0′′, δx = +0.′′023, and δx = +0.′′046). The dashed lines show the position and velocity of the red and blue emission peaks at offset δx = 0′′. Offset δy = 0 is indicatedby the white dotted line. The signature of rotation is very clear even at the largest offsets. Levels are 3.5 × 1.5i (i = 1,2,3,...) mJy beam−1; the units of the wedge are mJy beam−1. |
| In the text | |
|
Fig. 5 Same as in Fig. 3, but for the H39α line. The field of view and beam size are larger in this case. Levels in the PV diagrams (bottom) are 2.5, 5, 7.5, and from 10 to 90 in steps of 10 mJy beam−1. |
| In the text | |
|
Fig. 6 Left: sketch of the biconical geometry adopted in our model (Sect. 4). The equatorial plane is oriented in the sky along PA = 45° and is seen edge-on. Right: two-dimensional representation of the density law adopted (Table 2). Contour levels are 2.5 × 10⁵, 5 × 10⁵, 106, 5 × 10⁶, 107, and 5 × 107 cm−3. Dotted linesdelimit the different model components. The neutral disk is not probed by our ALMA observations. |
| In the text | |
|
Fig. 7 Model predictions of the free–free continuum of MWC 922 (Sect. 4, Table 2). Left and middle: 1 and 3 mm continuum maps as in, and to be compared with, Fig. 1. Right: spectral energy distributions as in, and to be compared with, Fig. 2b. Model free–free continuum integrated fluxes are indicated bythe pink line. |
| In the text | |
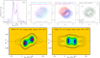 |
Fig. 8 Same as in Fig. 3, but showing the predictions of our model (Sect. 4, Table 2). |
| In the text | |
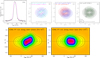 |
Fig. 9 Same as in Fig. 5, but showing the predictions of our model (Sect. 4, Table 2). |
| In the text | |
|
Fig. 10 Figure adapted from Fig. 6 in Martins et al. (2005) showing the position of MWC 922 in the HR diagram (inside the yellow box) together with the envelopes of evolutionary paths for M⋆ = 7, 9, 15, 20, 25, 40, and 60 M⊙ stars taking into account the different codes studied by these authors. The horizontal dotted lines show the luminosity of MWC 922 adopting different values of d; the upper limit to the stellar mass deduced from the central mass inside of the rotating disk at different d is also indicated. |
| In the text | |
|
Fig. A.1 Maps of the continuum emission adjacent to the H30α (231.9 GHz) and H39α (106.7 GHz) lines with super-resolution. Contour levels are at 1, 2, 3, 5%, and from 10to 100% in steps of 10% of the peak (28.5 and 30.6 mJy beam−1 at 1 and 3 mm,respectively). |
| In the text | |
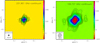 |
Fig. A.2 Same as in Fig. A.1, but for the MODEL. |
| In the text | |
|
Fig. A.3 ALMA velocity-channel maps of the H30α line in MWC922. The beam is 0.′′032 × 0.′′022, PA = 73° (bottom left corner of the last panel). Level contours are 2.5 × 2(i−1) mJy beam−1, for i = 1,2,3,... |
| In the text | |
|
Fig. A.4 ALMA velocity-channel maps of the H39α line in MWC922. The beam is 0.′′076 × 0.′′058, PA = −104° (bottom left corner of the last panel). Level contours are 2.5 × 2(i−1) mJy beam−1, for i = 1,2,3,... |
| In the text | |
|
Fig. A.5 Other mm-RRLs detected with ALMA: H55γ, H63δ, and H51ɛ. Maps (natural weighting) integrated over the VLSR = [−3.5:82] km s−1 range (top) and spectral profiles (bottom) are shown together with the predictions (in pink) from our model (Sect. 4 and Table 2). |
| In the text | |
|
Fig. A.6 Same as in Fig. 3(b–d) but showing the H30α super-resolution (15 mas) maps (top) and the predictions from our model (Table 2, second row) and a model with no rotation in the fast wind (third row). |
| In the text | |
|
Fig. A.7 Same as in Fig. 5(b–d), but showing the H39α super-resolution (30 mas) maps (top) and model. |
| In the text | |
|
Fig. A.8 Top: 12CO (2–1) velocity-channel maps around the narrow absorption ISM feature detected. Beam is 0.′′ 04 × 0.′′03, PA = 89°. Level spacing is 3 mJy beam−1. Bottom: 12CO (2–1) spectrum towards the center of MWC 922. |
| In the text | |
Current usage metrics show cumulative count of Article Views (full-text article views including HTML views, PDF and ePub downloads, according to the available data) and Abstracts Views on Vision4Press platform.
Data correspond to usage on the plateform after 2015. The current usage metrics is available 48-96 hours after online publication and is updated daily on week days.
Initial download of the metrics may take a while.