Fig. 4
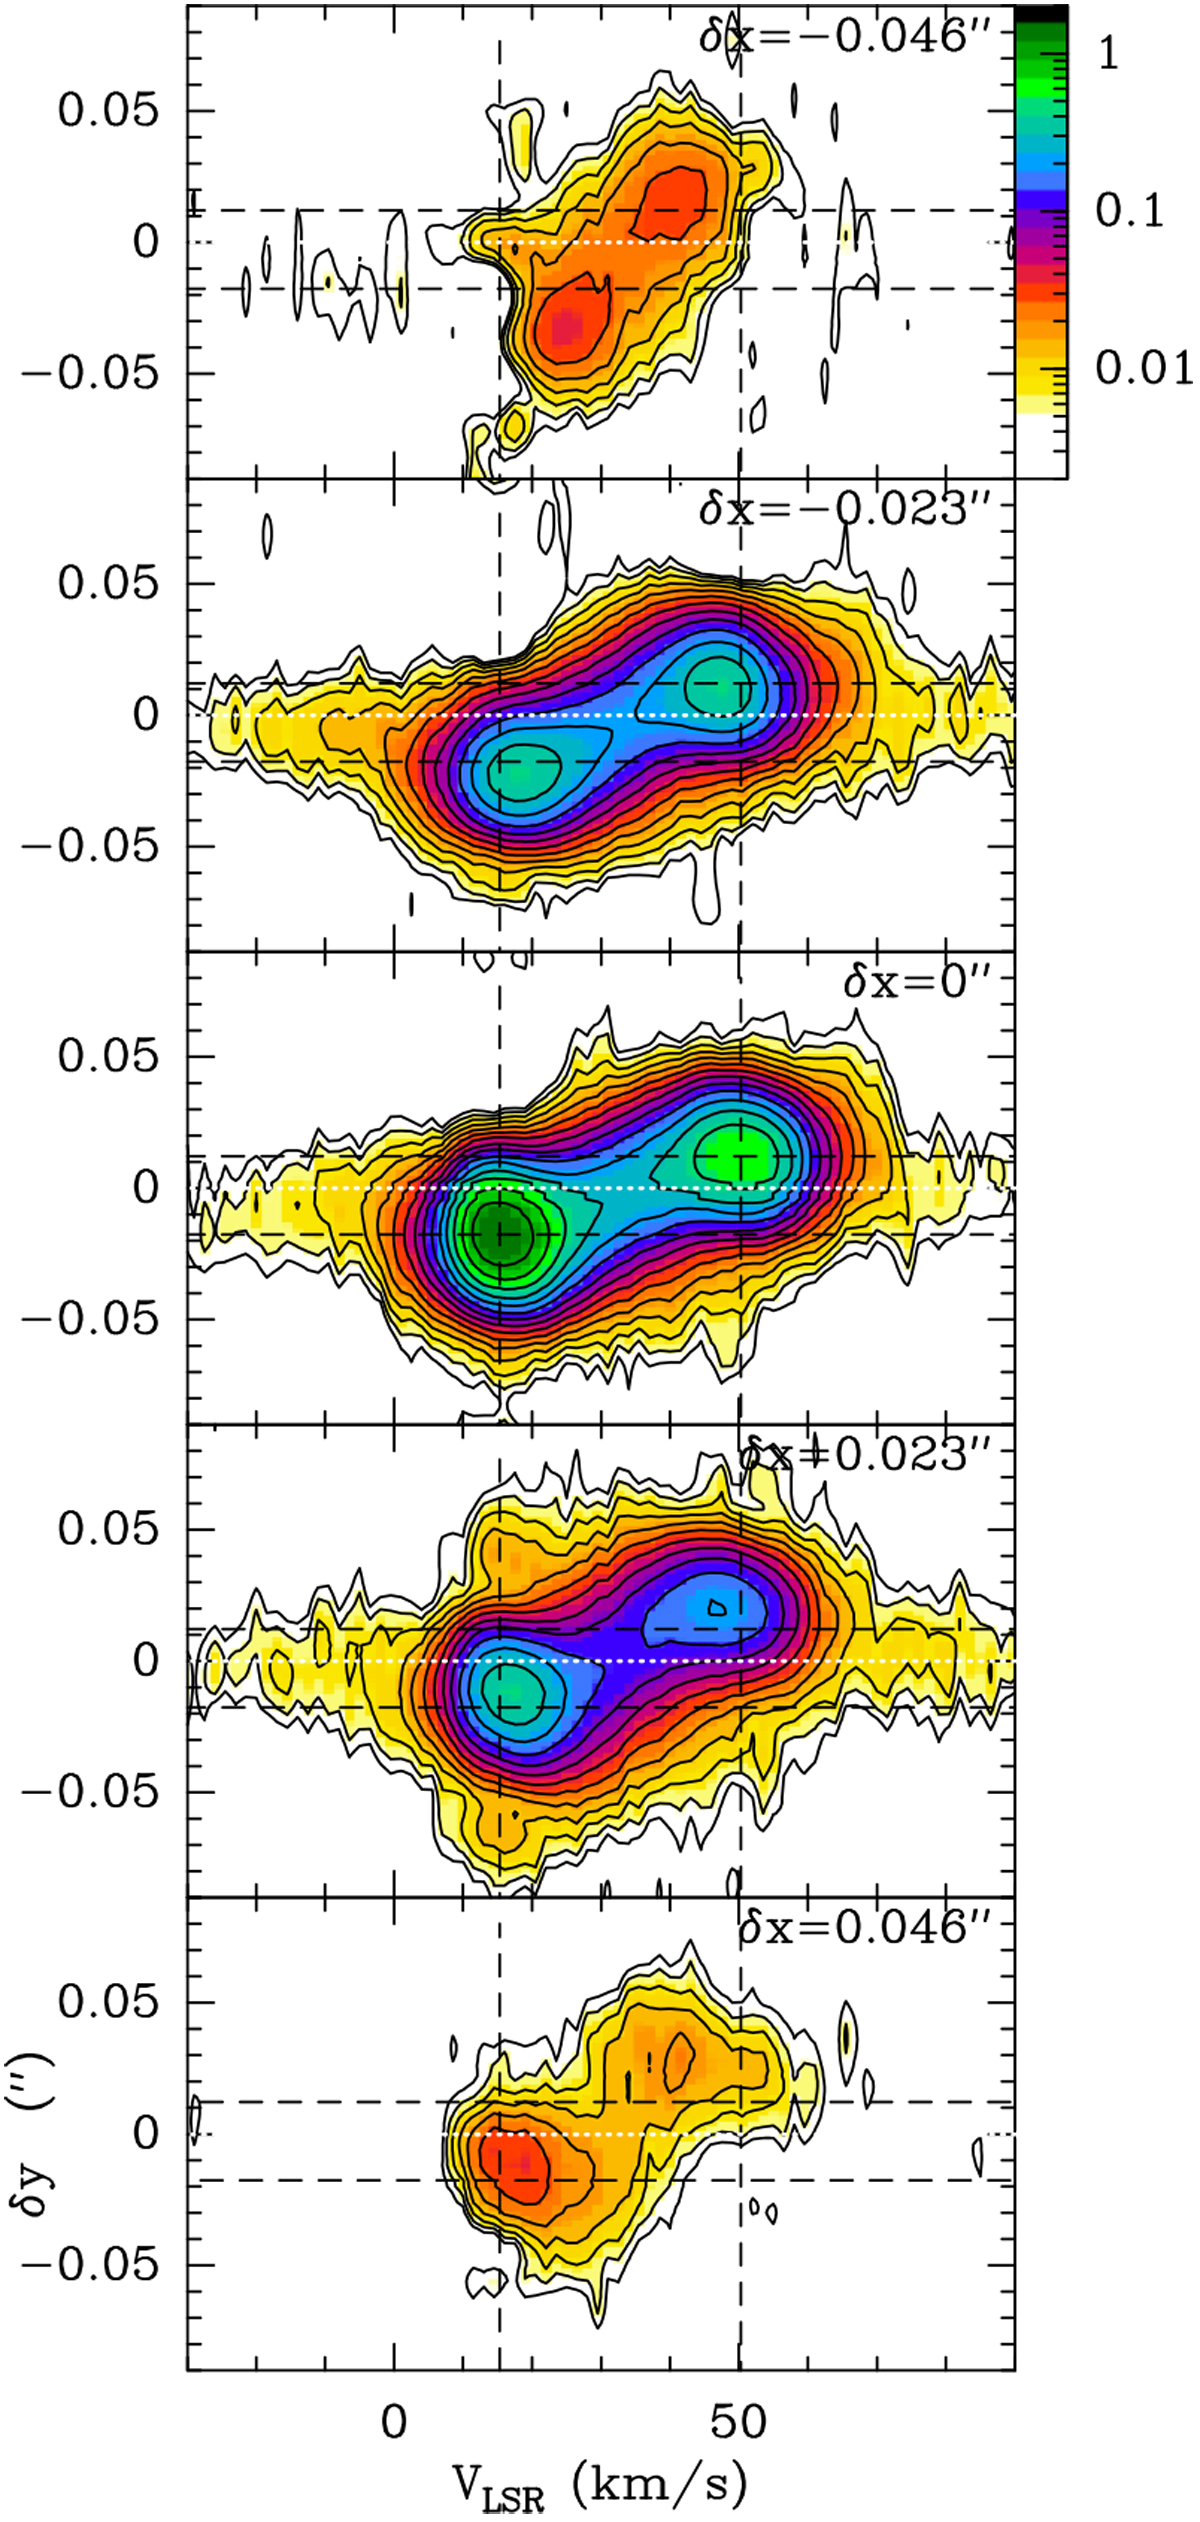
Position-velocity (PV) cuts of the H30α line along the direction of the equator (PA = 45°) at different δx offsets (δx = −0.′′046, δx = −0.′′023, δx = 0′′, δx = +0.′′023, and δx = +0.′′046). The dashed lines show the position and velocity of the red and blue emission peaks at offset δx = 0′′. Offset δy = 0 is indicatedby the white dotted line. The signature of rotation is very clear even at the largest offsets. Levels are 3.5 × 1.5i (i = 1,2,3,...) mJy beam−1; the units of the wedge are mJy beam−1.
Current usage metrics show cumulative count of Article Views (full-text article views including HTML views, PDF and ePub downloads, according to the available data) and Abstracts Views on Vision4Press platform.
Data correspond to usage on the plateform after 2015. The current usage metrics is available 48-96 hours after online publication and is updated daily on week days.
Initial download of the metrics may take a while.