Fig. 3
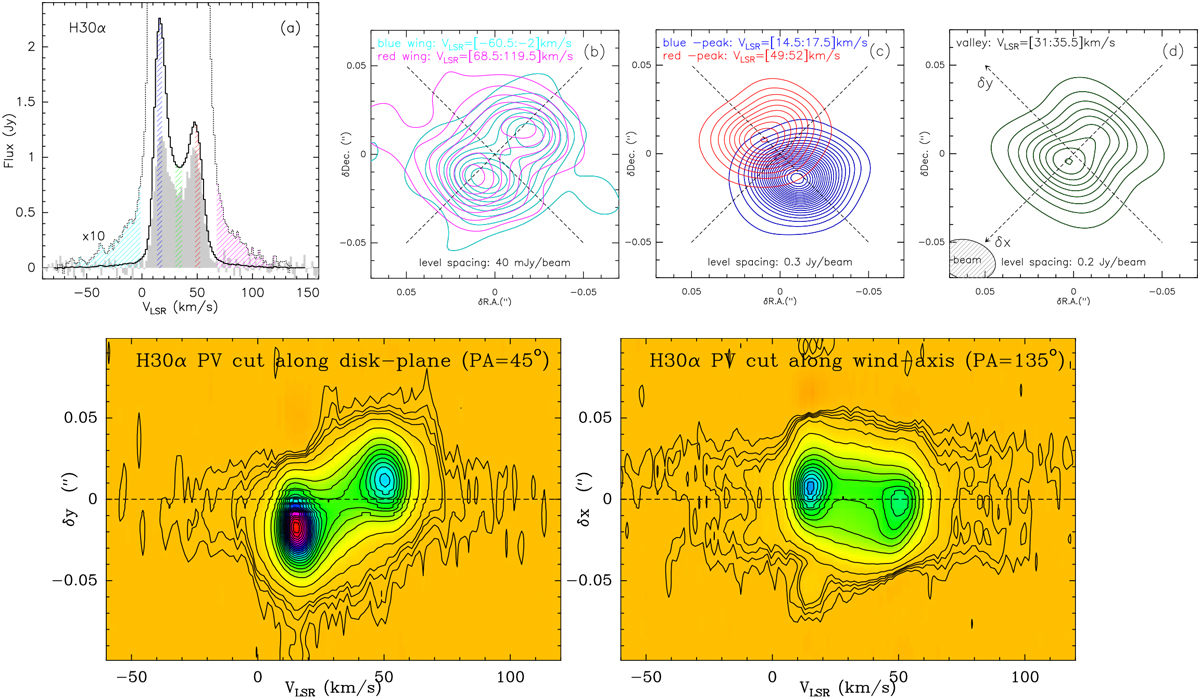
Summary of ALMA data of the H30α line (see also Fig. A.3). Top, panel a: integrated spectrum of the H30α line obtained with ALMA (black lines) and with the IRAM-30 m antenna (gray histogram, CSC+17). The colored hatched regions indicate the different velocity intervals used to generate the maps in panels b–d. The ALMA profile multiplied by a factor of 10 (dotted line) is overplotted for a clearer view of the broad line wings. Panels b–d: we show the H30α emission maps integrated over the line wings, the peaks, and the valley, respectively. Bottom: position velocity cuts of the H30α line through the center of MWC 922 along the disk plane (left, PA = 45°) and the perpendicular direction (right). Levels are 2.5, 5, 7.5, 10, 20, and then from 50 to 1700 in steps of 75 mJy beam−1.
Current usage metrics show cumulative count of Article Views (full-text article views including HTML views, PDF and ePub downloads, according to the available data) and Abstracts Views on Vision4Press platform.
Data correspond to usage on the plateform after 2015. The current usage metrics is available 48-96 hours after online publication and is updated daily on week days.
Initial download of the metrics may take a while.