Fig. 2
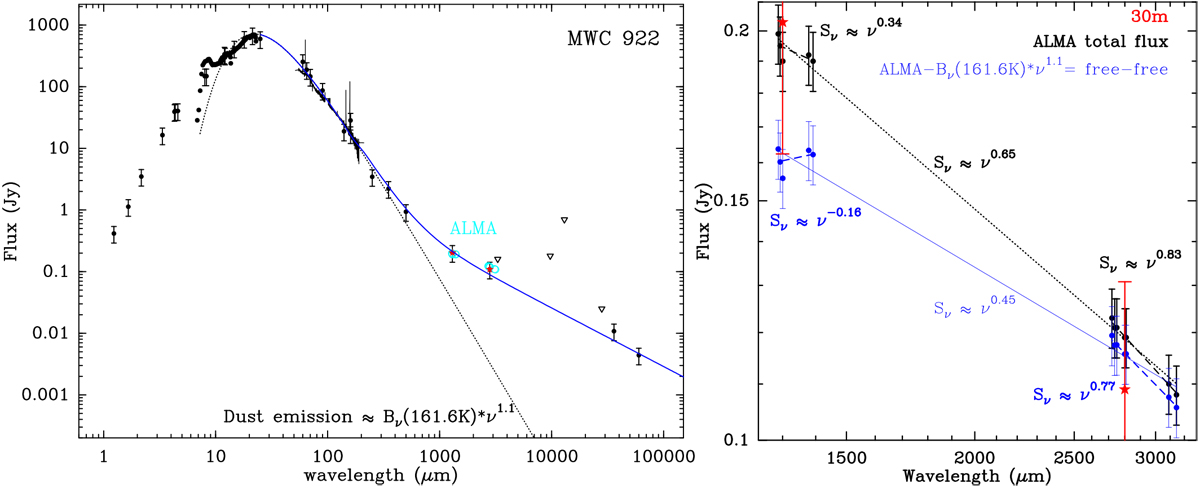
Left: SED of MWC 922 as in CSC+17, after adding PACS and SPIRE data (Molinari et al. 2016; Ramos-Medina et al. 2018), and including our ALMA continuum flux measurements (cyan, Table 1). Right: ALMA millimeter-continuum fluxes before (black) and after (blue) subtraction of the ~162 K dust emission contribution (dotted line in left panel). The red stars represent single-dish IRAM-30 m data (CSC+17).
Current usage metrics show cumulative count of Article Views (full-text article views including HTML views, PDF and ePub downloads, according to the available data) and Abstracts Views on Vision4Press platform.
Data correspond to usage on the plateform after 2015. The current usage metrics is available 48-96 hours after online publication and is updated daily on week days.
Initial download of the metrics may take a while.