Free Access
Fig. A.1
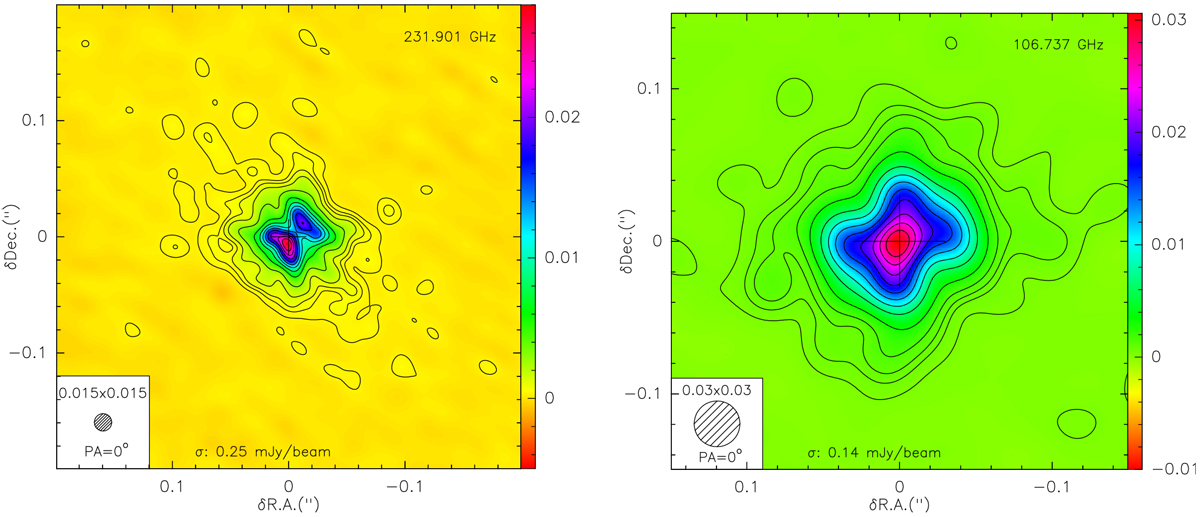
Maps of the continuum emission adjacent to the H30α (231.9 GHz) and H39α (106.7 GHz) lines with super-resolution. Contour levels are at 1, 2, 3, 5%, and from 10to 100% in steps of 10% of the peak (28.5 and 30.6 mJy beam−1 at 1 and 3 mm,respectively).
Current usage metrics show cumulative count of Article Views (full-text article views including HTML views, PDF and ePub downloads, according to the available data) and Abstracts Views on Vision4Press platform.
Data correspond to usage on the plateform after 2015. The current usage metrics is available 48-96 hours after online publication and is updated daily on week days.
Initial download of the metrics may take a while.