| Issue |
A&A
Volume 628, August 2019
|
|
|---|---|---|
| Article Number | A118 | |
| Number of page(s) | 12 | |
| Section | Extragalactic astronomy | |
| DOI | https://doi.org/10.1051/0004-6361/201935524 | |
| Published online | 15 August 2019 | |
The gentle monster PDS 456
Kiloparsec-scale molecular outflow and its implications for QSO feedback
1
INAF – Osservatorio Astronomico di Roma, Via Frascati 33, 00078 Monte Porzio Catone, Roma, Italy
e-mail: This email address is being protected from spambots. You need JavaScript enabled to view it.
2
INAF – Osservatorio Astronomico di Trieste, Via G.B. Tiepolo 11, 34143 Trieste, Italy
3
Scuola Normale Superiore, Piazza dei Cavalieri 7, 56126 Pisa, PI, Italy
4
Dipartimento di Fisica e Astronomia, Università di Bologna, Via Gobetti 93/2, 40129 Bologna, Italy
5
INAF – Osservatorio di Astrofisica e Scienza dello Spazio di Bologna, Via Gobetti 93/3, 40129 Bologna, Italy
6
INAF – Osservatorio Astronomico di Brera, Via Brera 28, 20121 Milano, Italy
7
INAF – Osservatorio Astrofisico di Arcetri, Largo E. Fermi 5, 50125 Firenze, Italy
8
European Southern Observatory, Karl-Schwarzschild-str. 2, 85748 Garching bei München, Germany
9
Cavendish Laboratory, University of Cambridge, 19 J. J. Thomson Avenue, Cambridge CB3 0HE, UK
10
Kavli Institute for Cosmology, University of Cambridge, Madingley Road, Cambridge CB3 0HA, UK
11
Dipartimento di Fisica e Astronomia, Università di Firenze, Via G. Sansone 1, 50019 Sesto Fiorentino, Firenze, Italy
Received:
22
March
2019
Accepted:
13
June
2019
Abstract
We report on the first ALMA observation of the CO(3−2) and rest-frame ∼340 GHz continuum emission in PDS 456, which is the most luminous, radio-quiet QSO in the local Universe (z ≃ 0.18), with a bolometric luminosity LBol ∼ 1047 erg s−1. ALMA angular resolution allowed us to map scales as small as ∼700 pc. The molecular gas reservoir traced by the core of the very bright CO(3−2) emission line is distributed in a compact rotating disk, with a size of ∼1.3 kpc, seen close to face-on (i ∼ 25 deg). Fast CO(3−2) emission in the velocity range v ∈ [ − 1000, 500] km s−1 is also present. Specifically, we detect several blue-shifted clumps out to ∼5 kpc from the nucleus, in addition to a compact (R ≲ 1.2 kpc), broad emission component. These components reveal a galaxy-wide molecular outflow, with a total mass Mmolout ∼ 2.5 × 10⁸ M⊙ (for an αCO = 0.8 M⊙ (K km s−1 pc2)−1) and a mass outflow rate Ṁmol ∼ 290 M⊙ yr−1. The corresponding depletion time is τdep ∼ 8 Myr, shorter than the rate at which the molecular gas is converted into stars, indicating that the detected outflow is potentially able to quench star-formation in the host. The momentum flux of the molecular outflow normalised to the radiative momentum output (i.e. LBol/c) is ≲1, comparable to that of the X-ray ultra-fast outflow (UFO) detected in PDS 456. This is at odds with the expectations for an energy-conserving expansion suggested for most of the large-scale outflows detected in low-luminosity AGNs so far. We suggest three possible scenarios that may explain this observation: (i) in very luminous AGNs such as our target the molecular gas phase is tracing only a fraction of the total outflowing mass; (ii) a small coupling between the shocked gas by the UFO and the host-galaxy interstellar medium (ISM); and (iii) AGN radiation pressure may be playing an important role in driving the outflow.
Key words: galaxies: active / quasars: individual: PDS 456 / galaxies: evolution / quasars: emission lines / techniques: imaging spectroscopy / techniques: interferometric
© ESO 2019
1. Introduction
The coupling between the super-massive black hole (SMBH) energy output and the interstellar and circum-galactic medium (ISM and CGM) of the host-galaxy is still an open issue, particularly relevant for hyper-luminous quasi-stellar objects (QSOs) with SMBH mass ≥ 109 M⊙ and bolometric luminosity LBol > 1047 erg s−1, that is, at the brightest end of the active galactic nuclei (AGNs) luminosity function. Mechanical and radiative QSO-driven feedback processes have been implemented in models of galaxy evolution to prevent massive galaxies from over-growing, to change their colours, to heat both ISM and CGM, and to enrich them with metals (e.g. Croton et al. 2006; Sijacki et al. 2007; Voit et al. 2015; Gaspari & Sdowski 2017; Choi et al. 2018, and references therein).
The impressive growth in the number of QSO-driven outflows discovered in the last decade represents a great advancement in our comprehension of the feedback process. These outflows have been detected in all gas phases and at all spatial scales (sub-parsec to several kiloparsecs; see Fiore et al. 2017, and references therein), and provide a very promising mechanism to efficiently deposit energy and momentum into the surrounding gas (e.g. Faucher-Giguère & Quataert 2012; Zubovas & King 2012), the most powerful ones exhibiting a kinetic power up to a few percent of LBol (e.g. Feruglio et al. 2010; Maiolino et al. 2012; Cicone et al. 2014; Aalto et al. 2015; Bischetti et al. 2017). In several AGN, mainly in the cold molecular and neutral gas phases, mass outflow rates exceeding the star formation rate have been measured (e.g. Feruglio et al. 2013a; Alatalo et al. 2015; Alatalo 2015; Cicone et al. 2015; Fluetsch et al. 2019), indicating that these outflows may affect the evolution of the host galaxy.
Ultra-fast outflows (UFOs) of highly ionised gas observed at sub-parsec scales (Reeves et al. 2003; Tombesi et al. 2012) have been proposed as the likely origin of galaxy-wide outflows, interpreted as the result of the impact of UFOs on the ISM (King & Pounds 2015, and references therein). Furthermore, both models and observations of kiloparsec-scale outflows seem to indicate a UFO-ISM interaction in an energy-conserving regime, whereby the swept-up gas expands adiabatically. So far, the co-existence of a massive molecular outflow with a nuclear UFO has been confirmed in a handful of AGNs with LBol ∼ 1044 − 1046 erg s−1 (Tombesi et al. 2015; Feruglio et al. 2015; Longinotti et al. 2015) and in APM 08279+5255 (Feruglio et al. 2017), which is a gravitationally lensed QSO at z ∼ 4 with an estimated intrinsic LBol of a few times 1047 erg s−1 (Saturni et al. 2018). In all these sources the momentum boost (i.e. the momentum flux of the wind normalised to the AGN radiative momentum output, LBol/c) of the UFO is ∼1, while the momentum rate of the molecular outflow is usually ≫1, in qualitative agreement with the theoretical predictions for an energy-conserving expansion (Faucher-Giguère & Quataert 2012; Costa et al. 2014). However, these results are still limited to a very small sample and suffer from large observational uncertainties, mostly due to the relatively low signal-to-noise ratio of the UFO- or outflow-related features confirmed in spectra, or to the limited spatial resolution of sub-millimetre observations. Recent studies increasing the statistics of sources with detection of molecular outflows have widened the range of measured energetics (e.g. García-Burillo et al. 2014; Veilleux et al. 2017; Feruglio et al. 2017; Brusa et al. 2018; Barcos-Muñoz et al. 2018; Fluetsch et al. 2019). These outflows are consistent with driving mechanisms alternative to the energy-conserving expansion, such as direct radiation pressure onto the host-galaxy ISM (e.g. Ishibashi & Fabian 2014; Ishibashi et al. 2018; Costa et al. 2018).
In order to study the interplay between UFOs and large-scale outflows in the still little-explored high-LBol regime, we used ALMA to target the QSO PDS 456, which is the most luminous, radio-quiet AGN (LBol ∼ 1047 erg s−1) in the local Universe at z ≃ 0.18 (Torres et al. 1997; Simpson et al. 1999). This allowed us to probe the molecular gas reservoir in a hyper-luminous QSO with unprecedented spatial resolution (∼700 pc). PDS 456 exhibits the prototype of massive and persistent UFO detected in the X-rays, identified as a quasi-spherical wind expanding with a velocity of ∼0.3c and kinetic power of ∼20 − 30% of LBol (Nardini et al. 2015; Luminari et al. 2018), arising at ∼0.01 pc from the SMBH. Reeves et al. (2016) reported the discovery of a complex of broad soft X-ray absorption lines, possibly associated with a lower ionisation, decelerating (∼0.1c) phase of the UFO out to parsec scales. Moreover, Hamann et al. (2018) recently claimed the presence of highly blue-shifted CIV absorption line in the Hubble Space Telescope UV spectra of PDS 456, tracing an outflow with velocity of 0.3c, similar to that measured for the UFO.
Given its uniqueness in terms of the presence of very fast outflows observed in several wavebands and its high luminosity, which makes it a local counterpart of the hyper-luminous QSOs shining at z ∼ 2 − 3, PDS 456 stands out as one of the best targets to investigate the presence of a molecular outflow and the effects of the QSO activity on the host-galaxy ISM. Nonetheless, the properties of the molecular gas of PDS 456y have been poorly studied so far, being based on a low-resolution (7 × 4.8 arcsec2) and low-sensitivity observation performed with the OVRO array (Yun et al. 2004, hereafter Y04). The detection of a CO(1−0) emission line with a FWHM = 180 km s−1 and line flux of ∼1.5 Jy km s−1 implies a molecular gas reservoir of a few times 109 M⊙, which is an intermediate value between those typically measured for blue Palomar-Green QSOs and local ultra-luminous infrared galaxies (ULIRGS, e.g. Solomon et al. 1997; Evans et al. 2006; Xia et al. 2012). The K-band image obtained at the Keck Telescope shows three compact sources detected at ∼3 arcsec from the QSO, suggesting the possible presence of companions at a projected distance of ∼9 kpc (Y04).
The paper is organised as follows. In Sect. 2 we describe the ALMA observation of PDS 456 and the data-reduction procedure. Our analysis and results are presented in Sect. 3. We discuss our findings in Sect. 4 and provide conclusions in Sect. 5. At the redshift of PDS 456, the physical scale is ∼3.1 kpc arcsec−1, given a H0 = 69.6, Ωm = 0.286, and ΩΛ = 0.714 cosmology.
2. ALMA observation and data reduction
We present in this work the ALMA Cycle 4 observation (project 2016.1.01156.S, P.I. E. Piconcelli) of PDS 456, performed on 5 May 2017 for 4.1 h of on-source integration time. The ALMA array was arranged in C40-5 configuration, with a maximum projected baseline of ∼1.1 km. We used the ALMA band 7 receiver and the frequency division mode of the ALMA correlator, providing us with four spectral windows of 1.875 GHz width and a spectral resolution of 31.25 MHz (∼30 km s−1). One spectral window (spw0) was centred at 292 GHz to cover the expected frequency of the CO(3−2) emission (rest frequency 345.796 GHz), based on the [FeII] redshift z[FeII] = 0.184 from Simpson et al. (1999). The second spectral window (spw1) was set adjacent to the first with ∼300 MHz overlap on the lower frequency side to accurately estimate the continuum. The sideband not including CO(3−2) emission with the two remaining spectral windows was set at ∼280 GHz. Visibilities were calibrated using the CASA 4.7.2 software (McMullin et al. 2007) in the pipeline mode and the default calibrators provided by the observatory: bandpass calibrator J175132+093958 (band 7 flux 1.42 ± 0.07 Jy), flux and phase calibrator J173302−130445 (band 7 flux 1.12 ± 0.06 Jy), and water vapour radiometer calibrator J173811−150300 (band 3 flux 0.11 ± 0.01 Jy). The absolute flux accuracy is better than 10%.
To estimate the rest-frame ∼340 GHz continuum emission we averaged the visibilities in the four spectral windows excluding the spectral range covered by the CO(3−2) emission (∼1 GHz). Moreover, to accurately model the continuum emission close to the CO(3−2) line, we performed a combined fit of only spw0 and spw1 in the UV plane. We did not include the lower sideband to avoid introducing systematic errors usually associated with the relative calibration of distant spectral windows. The relative flux calibration of spw0 and spw1 was verified for all calibrators and for PDS 456 in the overlap range of the two spectral windows. The agreement of the continuum levels in the overlap region is better than 2%. As the intrinsic QSO continuum variation across spw0 and spw1 is expected to be less than 1%, we fitted a zero-order model in the UV plane to the continuum channels (|v|> 1000 km s−1 from the peak of the CO(3−2) emission line). A first-order polynomial fit to the continuum emission did not significantly change our results. We subtracted this fit from the global visibilities and created continuum-subtracted CO(3−2) visibilities.
We investigated different cleaning procedures to produce the continuum-subtracted cube of CO(3−2). We preferred the Hogbom algorithm and the application of interactive cleaning masks for each channel and cleaning iteration. The use of the Clark cleaning algorithm does not significantly affect the properties of the QSO emission but increases the number of negative artefacts in the ALMA maps, while non-interactive cleaning (without masks) results in positive residuals at the location of the QSO. We chose a natural weighting, a cleaning threshold equal to the rms per channel, a pixel size of 0.04 arcsec, and a spectral resolution of ∼30 km s−1. The final beam size of the observation is (0.23 × 0.29) arcsec2 at position angle PA = −70 deg. The 1σ rms in the final cube is ∼0.083 mJy beam−1 for a channel width of 30 km s−1. By adopting the same deconvolution procedure as explained above, we obtain a continuum map with synthetic beam of (0.24 × 0.30) arcsec2 and rms of 9.6 μJy beam−1 in the aggregated bandwidth. We also produced a CO(3−2) data-cube with increased angular resolution by applying a briggs weighting to the visibilites in our ALMA observation with robust parameter b = −0.5, resulting into an ALMA beamsize of 0.16 × 0.19 arcsec2 and a rms sensitivity of ∼0.16 mJy beam−1 for a 30 km s−1 channel width.
3. Results
The continuum-subtracted, velocity integrated CO(3−2) emission in the velocity range v ∈ [ − 160, 160] km s−1 of PDS 456 is shown in Fig. 1a. The contours of the 340 GHz continuum emission are also plotted. The peak of the CO(3−2) emission is located at RA (17:28:19.79 ± 0.01), Dec (−14:15:55.86 ± 0.01), consistent with the position of PDS 456 based on VLA data (Y04). The CO(3−2) emission line is detected with a significance of ∼350σ (with σ = 0.013 Jy beam−1 km s−1). The bulk of the emission is located within ∼1 arcsec from the QSO, with some extended, fainter clumps located at a greater distance detected with statistical significance of ∼4σ. Both CO(3−2) and continuum emission are resolved by the ALMA beam in our observation. Specifically, a 2D Gaussian fit of CO(3−2) in the image plane results in a deconvolved FWHM size of (0.28 ± 0.02) × (0.25 ± 0.02) arcsec2, which corresponds to a physical size of ∼0.9 kpc. A fit of the continuum map gives a FWHM deconvolved size of (0.19 ± 0.02) × (0.17 ± 0.02) arcsec2 and a flux density of 0.69 ± 0.02 mJy.
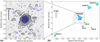 |
Fig. 1. Panel a: map of the continuum-subtracted, CO(3−2) emission of PDS 456 integrated over a line width of 320 km s−1. Black contours indicate the [−3,−2, 2, 3, 2n]σ significance levels (n ≥ 2 and σ = 0.013 Jy beam−1 km s−1) of the CO(3−2) emission. Blue contours indicate the (rest-frame) ∼340 GHz continuum [−3,−2, 2, 3, 2n]σ levels (with σ = 9.6 μJy beam−1). The ALMA synthetic beam is indicated by the grey ellipse. Panel b: map of the line and continuum emitters detected in the ALMA field of view at ≳5σ. |
In addition to PDS 456, three line emitters (CO-1, CO-2, CO-3) and three continuum emitters (Cont-1, Cont-2, Cont-3) are detected at ≳5σ in the ALMA primary beam (∼20 arcsec), as displayed in Fig. 1b. The proximity in sky frequency of the line emitters suggests that these are CO(3−2) emitters located at approximately the same redshift as the QSO. A detailed analysis of the galaxy overdensity around PDS 456 will be presented in a forthcoming paper (Piconcelli et al., in prep.).
As detailed in Sect. 2, for an accurate study of the CO(3−2) emission line profile and estimation of the underlying continuum, we combine two adjacent spectral windows in order to exploit the largest possible spectral coverage (i.e. ∼3.8 GHz). In Fig. 2 we present the continuum-subtracted spectrum of the CO(3−2) emission in PDS 456, extracted from a circular region of 1 arcsec radius. By fitting the line with a single Gaussian component, we measure a peak flux density S3 − 2 = 63.6 ± 0.7 mJy and a FWHM = 160 ± 30 km s−1. The line peak corresponds to a redshift zCO = 0.1850 ± 0.0001, consistent with the CO(1−0)-based redshift from Y04, but significantly larger than the value z[FeII] = 0.1837 ± 0.0003 derived from the [FeII] emission line in the near-IR spectrum (Simpson et al. 1999). We find a line brightness ratio S3 − 2/S1 − 0 ∼ 8, computed by using the S1 − 0 flux density reported by Y04. We estimate a possible contamination to the CO(1−0) flux due to the companion sources CO-1 and CO-2 to be ≲2%, once a CO excitation ladder similar to the Galactic one is assumed (Carilli & Walter 2013). The measured S3 − 2/S1 − 0 is in agreement with the CO excitation ladder typically found in QSOs (Carilli & Walter 2013). This suggests that our ALMA observation is able to recover the bulk of the CO(3−2) emission in PDS 456. According to our observation setup, the largest recoverable scale is 2.2 arcsec (∼6.6 kpc), which is larger than the size of the CO emission measured in local luminous infrared galaxies and QSOs (e.g. Bryant & Scoville 1999; Solomon & Vanden Bout 2005; Moser et al. 2016). We derive an integrated intensity SΔv3 − 2 = 10.6 ± 0.2 Jy km s−1. This translates into a luminosity L′CO3 − 2 = 2.1 × 10⁹ K km s−1 pc2 and a luminosity ratio L′CO3 − 2/L′CO1 − 0 ∼ 0.85.
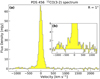 |
Fig. 2. Continuum-subtracted spectrum of the CO(3−2) emission line in PDS 456, extracted from a circular region of 1 arcsec radius. Panel a: integrated flux density as a function of velocity, corresponding to a circular region of 1 arcsec radius centred on the QSO position. The channel width is 30 km s−1. Panel b: zoomed-in view of the high-velocity wings in the CO(3−2) line profile. |
The line profile of the CO(3−2) emission exhibits a blue tail, indicating the presence of emitting material with velocities down to ∼ − 1000 km s−1 (see Fig. 2b), which we interpret as associated with outflowing gas. Conversely, no emission on the red side of CO(3−2) is detected at v > 600 km s−1. The spatial resolution of our ALMA observation allows us to map the morphology of the outflow in extreme detail, as shown in Fig. 3a. Specifically, the outflow in PDS 456 shows several components: a bright inner component located at a radial distance R ≲ 1.2 kpc, plus an extended component consisting of several clumps with different blue-shifted bulk velocities located at radii R ∼ 1.8 − 5 kpc.
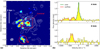 |
Fig. 3. Panel a: velocity-integrated map of the blue-shifted (v < −250 km s−1) CO(3−2) emission obtained by integrating the emission detected at > 3σ in each 30 km s−1 spectral channel, for at least four contiguous channels (i.e. over a velocity range of ≥120 km s−1). White contours show the systemic CO(3−2) emission (same as Fig. 1a). Panel b: CO(3−2) spectra of the extended outflowing clumps A and B shown in panel a, together with their best-fit multi-Gaussian components model. The spectrum extracted at the position of clump A (top panel), located at ∼1.8 kpc from the QSO, shows CO(3−2) emission centred at v ∼ 0 (systemic emission from the QSO, green curve) plus two components with blue-shifted velocities of v ∼ −300 and ∼ − 700 km s−1. The spectrum extracted at the position of clump B (bottom panel) shows no contamination from the CO(3−2) systemic emission, while blue-shifted emission is detected at v ∼ −400 km s−1. |
3.1. Extended outflow
Figure 3a shows the velocity integrated map of the CO(3−2) clumps in the v ∈ [ − 1000, −250] km s−1, obtained by integrating the emission detected at > 3σ in each 30 km s−1 spectral channel, for at least four contiguous channels (i.e. over a velocity range ≥120 km s−1). The colour map shows that the outflowing gas is distributed in several clumps located at different distances from the QSO, up to ∼5 kpc, while the white contours refer to the quiescent molecular gas traced by the CO(3−2) core. Two examples of the clumps spectra are given in Fig. 3b, showing that each clump emits over a typical range of ∼200 km s−1. Specifically, the CO(3−2) spectrum at the position of clump A (located at ∼0.6 arcsec = 1.8 kpc from the nucleus) is characterised by an emission component centred at v ∼ 0, which is associated with the quiescent gas. It also shows an excess of blue-shifted emission at v ∼ −300 and v ∼ −750 km s−1. Conversely, the spectrum of clump B at a larger separation (∼1.6 arcsec = 5 kpc) lacks systemic emission but shows a blue-shifted component centred at v ∼ −350 km s−1. We model the spectrum of each extended clump with multiple Gaussian components (also shown in Fig. 3b).
For a single high-velocity clump the mass outflow rate is computed as:
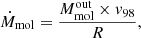 (1)
(1)
where  is the clump mass, v98 is the velocity enclosing 98% of the cumulative velocity distribution of the outflowing gas, and R is the projected distance of the clump from the QSO. The factor
  is derived from the CO(3−2) luminosity of the clumps detected at > 3σ in the velocity range v ∈ [ − 1000, −250] km s−1. We use the L′CO3 − 2/L′CO1 − 0 luminosity ratio measured for the systemic emission, and a luminosity-to-gas-mass conversion factor αCO = 0.8 M⊙ (K km s−1 pc2)−1, typical of star-forming QSO hosts (see Sect. 4 for further details). By adding together the contribution of all clumps, we estimate the molecular gas mass, the molecular mass outflow rate, and momentum flux of the extended outflow detected in PDS 456; see Table 1.
Main parameters of the molecular outflow detected in PDS 456.
3.2. Central outflow
Figure 4 shows the velocity and velocity dispersion map of CO(3−2) emission of the inner 1 arcsec2 region. The latter is resolved in about 12 independent beams which allow us to detect a projected velocity gradient in approximately the northwest to south direction with a relatively small total range (v ∈ [ − 50, +40] km s−1). Emission with a flat velocity distribution around v = 0 km s−1 smears the velocity gradient in an arc-like region extending from the QSO position to ∼[+0.3, −0.3] arcsec. The maximum of the velocity dispersion is observed in the central region (σvel ∼ 80 km s−1), where beam-smearing effects are more prominent (Davies et al. 2011; Tacconi et al. 2013). A more reliable estimate of σvel is provided by the average σvel ∼ 40 − 50 km s−1 in an annulus with 0.2 < R < 0.4 arcsec. The kinematics in the central region of PDS 456 is more complex than that of a rotating disk, as further supported by the position-velocity diagram shown in Fig. 5a, extracted along the maximum velocity gradient direction from a 0.3 arcsec slit. A rotation pattern can be identified, with a velocity gradient Δvblue − red ∼ 200 km s−1, which is modified by the presence of an excess of emission due to gas with velocity v ∈ [ − 1000, +600] km s−1 roughly centred at the position of the QSO. This appears more evidently in Fig. 5b,c showing zoom-in position-velocity diagrams of the v ∈ [ − 500, +600] km s−1 velocity range with an increased angular resolution of 0.16 × 0.19 arcsec2 (see Sect. 2), extracted along and perpendicular to the major kinematic axis direction, respectively.
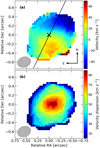 |
Fig. 4. Panel a: velocity map of the CO(3−2) emission detected at ≳5σ in the host galaxy of PDS 456, resolved with ∼12 ALMA beams (indicated by the grey ellipse). The main kinematic axis is indicated by the black line. Panel b: velocity dispersion map, characterised by values of σ ≲ 80 km s−1. |
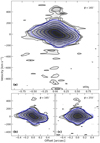 |
Fig. 5. Panel a: position-velocity diagram, extracted from a 0.3 arcsec slit centred on the QSO location along the major kinematic axis (see Fig. 4a) corresponding to a PA of 165 deg (measured anti-clockwise from north). Black contours refer to the [2, 3, 4, …2n]σ significance level of the CO(3−2) emission, with σ = 0.083 mJy beam−1 and n > 2. The contours associated with the best-fit 3DBAROLO model of the kinematics are also shown by the blue contours. Panels b and c: zoom-in of the velocity range v ∈ [ − 500, +600] km s−1 with increased angular resolution (0.16 × 0.19 arcsec2), extracted along and perpendicular to the major kinematic axis, respectively. Contours are as in the top panel, with σ = 0.16 mJy beam−1. |
We fit a 3D tilted-ring model with 3DBAROLO (Di Teodoro & Fraternali 2015) to the data to provide a zero-order description of the kinematics. We exclude from the fit the region with an angular separation ≲0.15 arcsec from the nucleus, where the high-velocity gas perturbs the kinematics. This results in an inclination i = 25 ± 10 deg, which is consistent with the value of ∼25 deg derived from the projected axes ratio, and an intrinsic circular velocity vrot = 1.3 × Δvblue − red/(2sin i) ∼ 280 km s−1 (e.g. Tacconi et al. 2013). The implied virial dynamical mass is  , where D ∼ 1.3 kpc is the source size estimated as 1.5× the deconvolved major axis of the CO(3−2) emission. A comparable value, namely Mdyn(i = 25 deg) ∼ 1.2 × 10¹⁰ M⊙, is derived using the relation Mdyn = 1.16 × 105 × (0.75 × FWHM/sin i)2 × D (Wang et al. 2013; Bischetti et al. 2018). Using the inferred dynamical mass we derive an escape velocity from the central 1.3 kpc of PDS 456 of ∼280 km s−1.
By subtracting the 3DBAROLO model to the ALMA cube we find that strong (∼8% of the total CO(3−2) flux) positive residuals are present in the velocity range v ∈ [ − 500, +600] km s−1. It is likely that these residuals are due to an inner emission component associated with the outflow described in Sect. 3.1. Therefore, we perform an accurate modelling of the spectrum of the central region to better disentangle the contribution provided by the outflow from the total CO(3−2) emission. Specifically, we use a pixel-by-pixel spectral decomposition in the range v ∈ [ − 500, +600] km s−1 with a combination of four Gaussian components to model: (a) the disk rotation. We include two components, needed to account for the partially resolved velocity distribution, i.e. nearby emitting regions with different rotation velocities within the ALMA beam. The normalisation of the first component is initially set to the peak of the emission in each pixel, while that of the second component is set to be one tenth of that. (b) The outflow (one component with σ > 90 km s−1, i.e. the maximum value measured in the velocity dispersion map of the CO(3−2) emission); and (c) the possible contamination by H13CN(4−3) emission (rest frequency νrest = 345.34 GHz) to the red wing of the CO(3−2) emission line (Sakamoto et al. 2010). This component has a fixed velocity offset of +390 km s−1, corresponding to the spectral separation between H13CN and CO(3−2), and line width equal to or larger than that of the main rotation component. Figure 6 shows the spectrum of the 1 × 1 arcsec2 central region with the different components obtained by adding together the best-fit models obtained from the pixel-by-pixel fit.
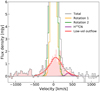 |
Fig. 6. CO(3−2) spectrum of the central 1 × 1 arcsec2 region centred on PDS 456. Data are shown in grey together with the total best-fit model resulting from the pixel-by-pixel decomposition in the v ∈ [ − 500, +600] km s−1 range, obtained by adding the best-fit models of each pixel. Yellow and green histograms indicate the two rotation components used to model the CO(3−2) core, while the emission from H13CN at v ∼ +390 km s−1 is shown in purple. The red histogram represents the best-fit of the low-velocity outflow component. The red shaded area represents the emission, remaining after the subtraction of rotation and H13CN emission, which we consider to be associated with the outflow, and indicates the presence of a blue-shifted, high-velocity (v ∼ −800 km s−1) outflow component. |
We then subtract from the total spectrum the components due to disk rotation and H13CN. The residuals (red histogram in Fig. 6) may be associated with emission from outflowing gas. It is worth noting that a spectral decomposition without the outflow component (i.e. maximising the contribution from the emission due to rotation) is able to account for at most ∼50% of these residuals.
The bulk of this emission is due to a low-velocity (|v|≲500 km s−1) component. Maps of the integrated flux density, velocity, and velocity dispersion of this low-velocity emission component are shown in Fig. 7. This emission peaks at an offset of ∼0.05 arcsec (∼160 pc) west from the QSO position (marked by a cross). After deconvolving from the beam, the low-velocity outflow has a total projected physical scale of ∼2.4 kpc. A fraction of ∼40% of this emission is unresolved in the present ALMA observation. A velocity gradient is detected along the east–west direction (see Fig. 7b), that is, roughly perpendicular to the north–south gradient in the velocity map of the total CO(3−2) emission (see Fig. 4a). This molecular gas is also characterised by a high-velocity dispersion (see Fig. 7c), with a peak value of σ ∼ 360 km s−1 and an average (Davies et al. 2011; Tacconi et al. 2013) σ ∼ 200 km s−1, suggesting highly turbulent gas close to the nucleus. All these pieces of evidence, in combination with the position–velocity diagram shown in Fig. 5, strongly suggest the presence of molecular gas whose kinematics is associated with outflowing gas.
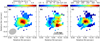 |
Fig. 7. Intensity (a), velocity (b), and velocity dispersion (c) maps of the central, low-velocity outflow component resulting from the pixel-by-pixel decomposition of the CO(3−2) spectrum in the velocity range v ∈ [ − 500, +600] km s−1 (red histogram in Fig. 6). The ALMA beam is shown by the grey ellipse, while the black cross indicates the QSO position. |
Beyond the velocity range v ∈ [ − 500, +600] km s−1 covered by the spectral decomposition mentioned above, the CO(3−2) spectrum of the central 1 × 1 arcsec2 region exhibits an excess of blue-shifted emission between −500 and −1000 km s−1 (see Fig. 6). This high-velocity component can be modelled with a Gaussian line centred at −800 ± 80 km s−1, with flux density 0.25 ± 0.08 mJy and σ = 180 ± 70 km s−1, and is visible in Fig. 3a at the position of the QSO. Based on its large velocity, this emission can also be associated with the molecular outflow in PDS 456.
Accordingly, the red shaded area in Fig. 6 represents the combination of the low- and high-velocity components for which we measure the outflow parameters (i.e. outflow mass, mass outflow rate, and momentum flux) listed in Table 1. To avoid any possible contamination from H13CN we exclude the spectral region in the range v ∈ [310, 560] km s−1.
As the central outflow is only marginally resolved by our ALMA observation, we infer its Ṁmol by considering the simple scenario of a spherically or biconically symmetric, mass-conserving flow with constant velocity and uniform density up to R ∼ 1.2 kpc (Fig. 7), similarly to the geometry assumed for the molecular outflows detected in other luminous AGN; see for example Vayner et al. (2017), Feruglio et al. (2017), Brusa et al. (2018). This corresponds to multiplying the Ṁmol value inferred by Eq. (1) by a factor of three. Alternative outflow models considering a time-averaged thin shell geometry (e.g. Cicone et al. 2015; Veilleux et al. 2017) or a density profile scaling as R−2 (Rupke et al. 2005) predict instead a mass outflow rate consistent with the value of Ṁmol derived by Eq. (1).
4. Discussion
The ALMA observation of the CO(3−2) emission line in PDS 456 reveals high-velocity molecular gas which traces a clumpy molecular outflow, extended out to ∼5 kpc from the nucleus in this hyper-luminous QSO. The molecular outflow discovered in PDS 456 is the first reported for a radio quiet, non-lensed QSO in the poorly-explored brightest end (LBol ≳ 1047 erg s−1) of the AGNs luminosity distribution. The total mass of the outflowing molecular gas is  (for an αCO = 0.8 M⊙ (K km s−1 pc2)−1), of which ∼70% is located within the ∼2 × 2 kpc2 inner region. We stress that the high spatial resolution of our ALMA observation has been crucial to disentangle the outflow-related emission from the dominant emission of the quiescent gas. The ratio between
  and the total molecular gas mass for PDS 456 is ∼12%, which is comparable to ratios typically measured for other molecular outflows (∼10 − 20%, e.g. Feruglio et al. 2013b, 2015; Cicone et al. 2014; Brusa et al. 2018). We note that the estimate of the molecular gas masses strongly depends on the assumption on αCO. Given that (i) PDS 456 exhibits a LBol comparable to that of high-z QSOs with available CO measurements (Carilli & Walter 2013) and (ii) the host-galaxy of PDS 456 shows both a compact size and SFR comparable to local luminous IR galaxies, we expect αCO ∼ 0.8 M⊙ (K km s−1 pc2)−1 in the central region, where the bulk of the outflowing gas lies (Downes et al. 1993; Bolatto et al. 2013). Similarly to Herrera-Camus et al. (2019), we adopt the same conversion factor for the extended outflow. We note that CO(3−2) emission in the extended outflow clumps may turn optically thin because of the large velocity dispersion (Bolatto et al. 2013). This would imply a lower αCO ∼ 0.34 M⊙ (K km s−1 pc2)−1 and, in turn, a smaller mass of the extended outflow by a factor of approximately 2.5. On the other hand, assuming αCO ∼ 2 M⊙ (K km s−1 pc2)−1 as recently derived for the extended neutral outflow in NGC 6240, that is, a merging LIRG hosting two AGN (Cicone et al. 2018), would imply a larger total mass of the outflowing gas by a factor of ≈2.5.
By adding together the mass outflow rates of the inner and outer outflow components discovered by ALMA in PDS 456, we find a total Ṁmol ∼ 290 M⊙ yr−1. This translates into a depletion timescale τdep = Mmol/Ṁmol ∼ 8 Myr for the molecular gas reservoir in PDS 456, suggesting a potential quenching of the star formation within a short time. Such a τdep is comparable to the Salpeter time for the mass growth rate of the SMBH in PDS 456 and close to the typical QSO lifetime, indicating that this system will likely evolve into a passive galaxy with a dormant SMBH at its centre. Moreover, by including the measured rest-frame ∼1 mm continuum emission in a broad-band, UV-to-FIR fitting of the spectral energy distribution in PDS 456, we are able to measure a SFR ∼ 30 − 80 M⊙ yr−1 in the QSO host galaxy (Vignali, in prep.). In this process we avoid the contamination from the companions which account for the bulk of the FIR luminosity derived by previous low-resolution observations with only upper-limits in the FIR range above 100 microns (Yun et al. 2004).
This implies that τdep is a factor of ≈4 − 10 shorter than the time needed for the molecular gas to be converted into stars (τSF), indicating that the detected outflow is potentially able to affect the evolution of the host galaxy in PDS 456. A value of τdep < τSF has been similarly observed for other molecular outflows observed in AGN (e.g. Cicone et al. 2014; Veilleux et al. 2017; Brusa et al. 2018; Herrera-Camus et al. 2019). Given the large uncertainties both on τdep and τSF, it is not possible to exclude a starburst contribution to the outflow acceleration unless τdep ≪ τSF. However, for a given FIR luminosity, the estimate of the SFR depends on the assumption of the inital mass function (IMF) and star formation history. The SFR in the host-galaxy of PDS 456 is estimated assuming a continuous star formation burst of 10 − 100 Myr and a Salpeter IMF (Kennicutt 1998), in case of solar metallicity. A different IMF (i.e. Larson or Chabrier) would translate into a smaller SFR by a factor of ≈2 (Conroy et al. 2009; Valiante et al. 2014) and therefore a larger τSF.
Figure 8a shows the mass outflow rate Ṁof as a function of LBol for PDS 456 and a compilation of molecular and ionised AGN-driven outflows from Fiore et al. (2017). We also include the molecular outflows recently revealed in CO emission by Zschaechner et al. (2016), Feruglio et al. (2017), Querejeta et al. (2017), Veilleux et al. (2017), Brusa et al. (2018), Longinotti et al. (2018) and those detected in both the molecular and ionised phase by Vayner et al. (2017) and Herrera-Camus et al. (2019), which have been identified to be AGN-driven. In addition to these outflows, we consider those reported by Fluetsch et al. (2019) in systems where the AGN contributes to ≳20% of LBol, and that discovered by Pereira-Santaella et al. (2018) in IRAS 14348−1447, for which the PA and the high (∼800 km s−1) velocity of the outflow suggest an AGN origin, for a total of 23(60) molecular(ionised) outflows. To minimise the systematic differences from sample to sample, all values were recomputed from the tabulated data according to the same assumptions, following Eq. (B.2) of Fiore et al. (2017). Nevertheless, some scatter between various samples may still be present because of the different assumptions in the literature on αCO and, therefore, on the outflow mass.
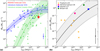 |
Fig. 8. Panel a: mass outflow rate as a function of LBol for PDS 456 (red star) and a compilation of AGNs with outflow detection from Fiore et al. (2017), Fluetsch et al. (2019), Zschaechner et al. (2016), Feruglio et al. (2017), Querejeta et al. (2017), Vayner et al. (2017), Veilleux et al. (2017), Brusa et al. (2018), Longinotti et al. (2018), Herrera-Camus et al. (2019). The blue(green) dashed line shows the best-fit parabolic function for the molecular(ionised) phase, while the shaded area indicates the rms scatter of the data from the relation. Panel b: ratio μ = Ṁion/Ṁmol (black solid curve) inferred from the best-fit relations in panel a, as a function of LBol. The shaded area represents the uncertainty on μ, given the scatter of these relations. Data points indicate the position in the μ − LBol plane of the AGNs with available molecular and ionised mass outflow rates (Vayner et al. 2017; Brusa et al. 2018; Herrera-Camus et al. 2019). We also include the sources with AGN contribution to LBol > 10% from Fluetsch et al. (2019). |
This updated compilation allows us to populate the luminosity range above 1046 erg s−1, poorly sampled by both Fiore et al. (2017) and Fluetsch et al. (2019) samples. The relation for the molecular mass outflow rates as a function of LBol by Fiore et al. (2017) predicts much larger values of Ṁmol than those measured for the sources with LBol > 1046 erg s−1. Accordingly, in order to model a likely flattening of the relation between the molecular mass outflow rate and LBol in this high-luminosity range, we fit the molecular data with a parabolic function defined as:
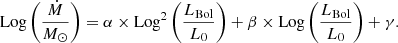 (2)
(2)
The best-fit relation is given by αmol = −0.11, βmol = 0.80, γmol = 1.78 and L0, mol = 1044.03 erg s−1, with an associated scatter of ∼0.37 dex, computed as the rms of the molecular data points with respect to the relation. Our modelling suggests a molecular mass outflow rate Ṁmol ∼ 1000 M⊙ yr−1 for LBol in the range 1046 − 1048 erg s−1. By fitting the ionised data with Eq. (2), we find αion = −0.21, βion = 1.26, γion = 2.14 and L0, ion = 1046.07 erg s−1, and a rms scatter of 0.91 dex. According to our best-fit relation, the ionised mass outflow rate Ṁion continues to increase up to LBol ∼ 1048 erg s−1.
Figure 8b shows the ratio between the two parabolic functions described above which reproduce the ionised and molecular mass outflow rate trends with LBol, that is μ(LBol) = Ṁion/Ṁmol, in the luminosity range LBol ∈ [1043 − 1048] erg s−1. Similarly to what was previously noted by Fiore et al. (2017), we find that despite a large scatter of about one order of magnitude, the ratio μ(LBol) = Ṁion/Ṁmol increases with LBol. The mean expected value varies between μ ∼ 10−3 at LBol ∼ 1044 erg s−1 and μ ∼ 1 at LBol ∼ 1047 erg s−1, suggesting a comparable contribution of the molecular and ionised gas phase to the outflow in PDS 456. In our analysis we do not take into account the contribution of the neutral atomic gas phase to the total mass outflow rate. However, for the few moderate-luminosity AGNs with spatially resolved measurements of the outflow in both the molecular and neutral gas phase, the latter seems to represent a fraction of ≲30% of the molecular one (e.g. Rupke & Veilleux 2013; Rupke et al. 2017; Brusa et al. 2018). In Fig. 8b the sources with combined detection of outflow in the ionised and molecular gas phases are also shown. Differently from Fluetsch et al. (2019), who explored the luminosity range LBol ∈ [1044 − 1046] erg s−1 finding an anti-correlation between μ and LBol, we observe that a positive trend is likely present over a wider luminosity range, although the limited statistics (three more objects with respect to Fluetsch et al. 2019) does not allow us to make any firm conclusions on this. However, we note that values of μ close or even larger than unity have already been reported for moderately luminous QSOs (e.g. Vayner et al. 2017; Brusa et al. 2018), suggesting that sources with comparable molecular and ionised mass outflow rates may span a wide range of LBol.
In Fig. 9 we plot the outflow momentum boost Ṗof/Ṗrad as a function of the outflow velocity1, where Ṗrad = LBol/c. This plot has often been used to compare different models of energy transfer between UFOs and galaxy-scale outflows, assuming that most of the outflow mass is carried by the molecular phase, that is Ṗof ∼ Ṗmol (Tombesi et al. 2015; Feruglio et al. 2015). This may not be true, especially in the high-LBol regime, as in the case of PDS 456 (Fig. 9a). The ratio Ṗmol/Ṗrad ∼ 0.36 estimated using CO for the galactic-scale outflow in PDS 456 is significantly smaller than those measured in other AGN, typically showing Ṗmol/Ṗrad ∼ 5−50; interestingly, it is of the order of ṖUFO/Ṗrad, found by Nardini et al. (2015), Luminari et al. (2018).
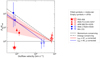 |
Fig. 9. Ratio between the outflow (molecular or UFO) momentum flux and the radiative momentum flux as a function of the outflow velocity. Star = PDS 456; blue symbols are AGNs with LBol < 1046 erg s−1 (Feruglio et al. 2015; Longinotti et al. 2018); red symbols are AGNs with LBol ∼ 1046 − 1048 (Tombesi et al. 2015; Veilleux et al. 2017; Feruglio et al. 2017, and this work). Filled symbols represent molecular outflows and open symbols show UFOs. The dashed line is the expectation for a momentum-driven outflow. The dot-dashed line represents the prediction for an energy-driven outflow with Ṗmol/Ṗrad = vUFO/v. The solid lines show the expected Ṗmol/Ṗrad for a given luminosity and for different μ(L) = Ṁion/Ṁmol. The red(blue) shaded area shows the uncertainty on Ṗmol/Ṗrad at LBol ∼ 1047(1045) erg s−1, given the rms scatter on Ṁion according to Eq. (2). |
The dot-dashed line indicates the expected Ṗof/Ṗrad for an energy conserving expansion assuming that most of the outflow mass is traced by the molecular phase. As suggested by Fig. 8, this is likely not the case in the high-LBol regime, where the ionised outflow can be as massive as the molecular one. We thus probably detect in the molecular phase only a fraction of the total outflowing mass in PDS 456. Therefore, when comparing the expectation for the energy-conserving scenario with the results of ALMA observations we need to take into account that using the molecular phase alone to estimate the outflow mass may lead to an underestimation of the total mass of the outflow (i.e. the y-position of the red star marking PDS 456 in Fig. 9 should be considered as a lower limit). We therefore use an empirical relation to estimate the molecular momentum flux Ṗmol using the scaling relations given by Eq. (2). Specifically, the ratio between the total momentum flux of the large-scale outflow and that of the UFO for an energy-conserving expansion is related to the UFO and outflow velocities (vUFO and vof) by the following relation:
 (3)
(3)
that, by assuming Ṗof ∼Ṗmol + Ṗion, translates into a ratio Ṗmol/Ṗrad given by
 (4)
(4)
where vmol is the velocity of the molecular and outflow and k = vion/vmol is the ratio between the velocity of the ionised outflow and vmol. For our calculations, we assume vmol ∼ 1000 km s−1 and k ∼ 2 (Fiore et al. 2017).
Solid lines plotted in Fig. 9 represent the relations inferred from Eq. (4) for a luminosity of LBol ∼ 1045 and ∼1047 erg s−1, respectively. We note that for AGNs at relatively low luminosity (such as Mrk 231 and IRAS 17020+4544) the relation has a similar slope to the classic energy-conserving model, for which μ(LBol)≪1, because the bulk of the outflowing mass is due to molecular gas. Conversely, for hyper-luminous AGN, the empirical relation for Ṗmol/Ṗrad is less steep, as expected when μ(LBol) increases. This effect reduces the discrepancy between the observed Ṗmol/Ṗrad and the expectation for a “luminosity-corrected” energy-conserving scenario.
So far, there is no available observation of the outflow in the ionised gas phase for these hyper-luminous sources. However, it is interesting to note that a massive ionised outflow characterised by Ṁion ≳ 103 M⊙ yr−1, as inferred from Eq. (2) at such high luminosities, would be required to fit the measured Ṗmol/Ṗrad in IRAS F11119+3257 and APM 08279+5255 (red shaded area in Fig. 9). Remarkably, in the case of PDS 456, even a Ṁion as large as 104 M⊙ yr−1 (i.e. the maximum value allowed for an ionised outflow by Eq. (2) and its associated scatter) would likely still be insufficient to match the expectation for an energy-conserving outflow. On the other hand, the small value of the momentum boost derived for PDS 456 may be an indication that the shocked gas by the UFO preferentially expands along a direction not aligned with the disc plane and is not able to sweep up large amounts of ISM (Menci et al. 2019).
Alternatively, the results of our analysis can be interpreted as an indication of forms of outflow-driving mechanisms in high-luminosity AGNs that are different from UFO-related energy-driving. Models based on a mechanism for driving galaxy-scale outflows via radiation pressure on dust indeed predict Ṗmol/Ṗrad values around unity, and may offer a viable explanation for the observed energetics of the outflow in PDS 456 (Ishibashi & Fabian 2014; Thompson et al. 2015; Costa et al. 2018; Ishibashi et al. 2018). On the other hand, large-scale (≳ a few hundreds of pc) outflows cannot be explained by a momentum-conserving expansion which predicts a rapid cooling of the shocked wind (e.g. King & Pounds 2015).
Figure 10 shows τof = Eof/ĖUFO, which represents the time needed for the relativistic wind to provide the mechanical energy of the galaxy-scale outflow integrated over its flow time, i.e.  , as a function of LBol. Being a function of Eof, τof allows us to constrain the UFO efficiency in producing the observed kiloparsec-scale outflow without any assumption on its morphology and size (Nardini & Zubovas 2018). For AGNs with LBol < 1046 erg s−1, τof ∼ 105 − 106 yr, while τof drops to ∼103 yr in hyper-luminous QSOs such as PDS 456, suggesting a highly efficient UFO launched in these sources. We note that Eof should in principle be derived by including all gas phases at a given radius (Nardini & Zubovas 2018), while in Fig. 10 we only consider the molecular gas. In fact, complementary information on both the molecular and ionised phases as traced by for example CO and [OIII] is typically unavailable. Therefore, the observed trend of a decreasing τof with increasing LBol may be a further indication of a smaller molecular gas contribution to the total energy carried by the outflow in the high-luminosity regime. However, since τof is the ratio between a time-averaged quantity (Eof) and an instantaneous quantity (ĖUFO), a small value may be also explained in terms of an “outburst” phase of the UFO in the two sources with LBol ∼ 1047 erg s−1 considered here (i.e. PDS 456 and APM 08279+5255). Alternatively, a small coupling of the UFO with the host-galaxy ISM can be invoked to account for the short τof observed in these QSOs in a scenario where the kiloparsec-scale outflow is undergoing an energy-conserving expansion.
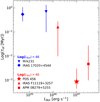 |
Fig. 10. τof = Eof/ĖUFO as a function of LBol for PDS 456 and a compilation of AGNs as in Fig. 9. Eof is computed under the assumption that the bulk of the outflowing gas mass is in the molecular phase. Blue (red) symbols correspond to AGNs with LBol < 1046 erg s−1 (LBol > 1046 erg s−1). |
5. Summary and conclusions
In this work, we report on the ALMA observation of the 1 mm continuum and CO(3−2) line emission in PDS 456 (zCO = 0.185). These data enable us to probe the ISM in the host-galaxy of a hyper-luminous (LBol ∼ 1047 erg s−1) QSO with unprecedented spatial resolution (∼700 pc). We provide the first detection of a molecular outflow in a radio-quiet, non-lensed source at the brightest end of the AGN-luminosity function. Our observation highlights the importance of the combined high spatial resolution and high sensitivity provided by ALMA in revealing broad wings much weaker than the core of the CO emission line, and disentangling the relative contribution of outflowing and quiescent molecular gas to the emission from the innermost regions around QSOs. Our main findings can be summarised as follows.
– We detect at ∼350σ significance the CO(3−2) emission from the host-galaxy of PDS 456, finding that the bulk of the molecular gas reservoir is located in a rotating disk with compact size (∼1.3 kpc) seen under a small inclination (i ∼ 25 deg), with an intrinsic circular velocity of ∼280 km s−1. We measure a molecular gas of Mmol ∼ 2.5 × 10⁹ M⊙ and a dynamical mass of Mdyn ∼ 1 × 10¹⁰ M⊙.
– The CO(3−2) emission line profile shows a blue-shifted tail (whose flux density is about 1/60 of the line peak), extending to v ∼ −1000 km s−1, and a red-shifted wing at v ≲ 600 km s−1, associated with molecular outflowing gas. The outflow is characterised by a complex morphology, as several clumps with blue-shifted velocity are detected over a wide region out to ∼5 kpc from the nucleus, in addition to a bright, compact outflow component with a velocity v ∈ [ − 1000, 500] km s−1 located within ∼1.2 kpc.
– By adding together all outflow components, we measure a total mass  and a mass outflow rate Ṁmol ∼ 290 M⊙ yr−1. This is a remarkably weak outflow for such a hyper-luminous QSO hosting one of the fastest and most energetic UFOs ever detected. Nevertheless, the measured Ṁmol implies a depletion timescale τdep ∼ 8 Myr for the molecular gas in PDS 456, being a factor of 4−10 shorter than the gas depletion time based on the SFR. This suggests a possible quenching of the star-formation activity in the host galaxy within a short time.
– The momentum boost of the molecular outflow with respect to the AGN radiative momentum output is Ṗmol/Ṗrad ∼ 0.36, which represents the smallest value reported so far for sources exhibiting both a UFO and molecular outflow. This result improves our understanding of the Ṗof/Ṗrad-versus-LBol relation and indicates that the relation between UFO and galaxy-scale molecular outflow is very complex and may significantly differ from the typical expectations of models of energy-conserving expansion (e.g. Faucher-Giguère & Quataert 2012; Zubovas & King 2012), i.e. Ṗof/Ṗrad ≫ 1.
– We calculate updated scaling relations between the mass outflow rate and LBol for both the molecular and ionised gas phase. Thanks to our detection of the molecular outflow in PDS 456, combined with other recent results, we can extend the modelling of the Ṁmol-versus-LBol relation by one order of magnitude in luminosity. Our best-fit relations indicate that the molecular mass outflow rate flattens at LBol > 1046 erg s−1, while the ionised one continues to increase up to LBol ∼ 1048 erg s−1. Although with a large scatter, the two gas phases appear comparable at LBol ∼ 1047 erg s−1, suggesting that in luminous QSOs the ionised gas phase cannot be neglected to properly evaluate the impact of AGN-driven feedback. Planned high-resolution VLT-MUSE observations will offer us an excellent opportunity to shed light on this by probing the ionised gas phase in PDS 456 with unprecedented detail.
– We derive an empirical relation to compute the luminosity-corrected Ṗmol as a function of LBol in the case of an energy-conserving scenario. Accordingly, we predict smaller Ṗmol/Ṗrad in luminous QSOs compared to the “classic” energy-conserving scenario. However, in case of PDS 456, the smallest Ṗmol predicted by our analysis (corresponding to a Ṁion ∼ 104 M⊙ yr−1) still falls short of matching the expectations for an efficient energy-conserving expansion, unless the shocked gas by the UFO leaks out along a direction that intercepts a small fraction of the molecular disc. Remarkably, the small momentum boost measured for the molecular outflow in PDS 456 lends support to a driving mechanism that is alternative to or concurrent with energy-driving, that is, the AGN radiation pressure on dust, predicting momentum ratios close to unity.
– The time necessary for the UFO to supply the energy measured for the molecular outflow in PDS 456, that is, τof ∼ 10−3 Myr, is about two orders of magnitude shorter than those derived for AGNs at lower LBol. Such a small value of τof may suggest that the molecular phase is not representative of the total outflow energy in hyper-luminous sources, or that the UFO in PDS 456 is caught in an “outburst” phase. Alternatively, it may be an indication of AGN radiative feedback at work in luminous QSOs. All these hypotheses suggest a very complex interplay between nuclear activity and its surroundings, with important implications for evaluating and simulating the impact and role of AGN-driven feedback in the evolution of massive galaxies.
Similarly to what has been done for the molecular outflows, all ṖUFO have been homogeneously recomputed according to Eq. (2) in Nardini & Zubovas (2018).
Acknowledgments
This paper makes use of the ALMA data from project ADS/JAO.ALMA#2016.1.01156.S. ALMA is a partnership of ESO (representing its member states), NSF (USA) and NINS (Japan), together with NRC (Canada), MOST and ASIAA (Taiwan), and KASI (Republic of Korea), in cooperation with the Republic of Chile. The Joint ALMA Observatory is operated by ESO, AUI/NRAO and NAOJ. We thank R. Valiante, C. Ramos-Almeida and N. Menci for helpful discussions, and E. Di Teodoro and M. Talia for their assistance in the usage of the 3DBAROLO model. M. Bischetti, E. Piconcelli, A. Bongiorno, L. Zappacosta and M. Brusa acknowledge financial support from ASI and INAF under the contract 2017-14-H.0 ASI-INAF. C. Feruglio, E. Piconcelli and F. Fiore acknowledge financial support from INAF under the contract PRIN INAF 2016 FORECAST. R. Maiolino acknowledges ERC Advanced Grant 695671 “QUENCH” and support by the Science and Technology Facilities Council (STFC). C. Cicone and E. Nardini acknowledge funding from the European Union’s Horizon 2020 research and innovation program under the Marie Sklodowska-Curie grant agreement No 664931.
References
- Aalto, S., Garcia-Burillo, S., Muller, S., et al. 2015, A&A, 574, A85 [NASA ADS] [CrossRef] [EDP Sciences] [Google Scholar]
- Alatalo, K. 2015, ApJ, 801, L17 [NASA ADS] [CrossRef] [Google Scholar]
- Alatalo, K., Lacy, M., Lanz, L., et al. 2015, ApJ, 798, 31 [NASA ADS] [CrossRef] [Google Scholar]
- Barcos-Muñoz, L., Aalto, S., Thompson, T. A., et al. 2018, ApJ, 853, L28 [NASA ADS] [CrossRef] [Google Scholar]
- Bischetti, M., Piconcelli, E., Vietri, G., et al. 2017, A&A, 598, A122 [NASA ADS] [CrossRef] [EDP Sciences] [Google Scholar]
- Bischetti, M., Piconcelli, E., Feruglio, C., et al. 2018, A&A, 617, A82 [NASA ADS] [CrossRef] [EDP Sciences] [Google Scholar]
- Bolatto, A. D., Wolfire, M., & Leroy, A. K. 2013, ARA&A, 51, 207 [Google Scholar]
- Brusa, M., Cresci, G., Daddi, E., et al. 2018, A&A, 612, A29 [NASA ADS] [CrossRef] [EDP Sciences] [Google Scholar]
- Bryant, P. M., & Scoville, N. Z. 1999, AJ, 117, 2632 [NASA ADS] [CrossRef] [Google Scholar]
- Carilli, C. L., & Walter, F. 2013, ARA&A, 51, 105 [NASA ADS] [CrossRef] [EDP Sciences] [Google Scholar]
- Choi, E., Somerville, R. S., Ostriker, J. P., Naab, T., & Hirschmann, M. 2018, ApJ, 866, 91 [NASA ADS] [CrossRef] [Google Scholar]
- Cicone, C., Maiolino, R., Sturm, E., et al. 2014, A&A, 562, A21 [NASA ADS] [CrossRef] [EDP Sciences] [Google Scholar]
- Cicone, C., Maiolino, R., Gallerani, S., et al. 2015, A&A, 574, A14 [NASA ADS] [CrossRef] [EDP Sciences] [Google Scholar]
- Cicone, C., Severgnini, P., Papadopoulos, P. P., et al. 2018, ApJ, 863, 143 [NASA ADS] [CrossRef] [Google Scholar]
- Conroy, C., Gunn, J. E., & White, M. 2009, ApJ, 699, 486 [NASA ADS] [CrossRef] [Google Scholar]
- Costa, T., Sijacki, D., & Haehnelt, M. G. 2014, MNRAS, 444, 2355 [NASA ADS] [CrossRef] [Google Scholar]
- Costa, T., Rosdahl, J., Sijacki, D., & Haehnelt, M. G. 2018, MNRAS, 473, 4197 [NASA ADS] [CrossRef] [Google Scholar]
- Croton, D. J., Springel, V., White, S. D. M., et al. 2006, MNRAS, 365, 11 [NASA ADS] [CrossRef] [Google Scholar]
- Davies, R., Förster Schreiber, N. M., Cresci, G., et al. 2011, ApJ, 741, 69 [NASA ADS] [CrossRef] [Google Scholar]
- Di Teodoro, E. M., & Fraternali, F. 2015, MNRAS, 451, 3021 [NASA ADS] [CrossRef] [Google Scholar]
- Downes, D., Solomon, P. M., & Radford, S. J. E. 1993, ApJ, 414, L13 [NASA ADS] [CrossRef] [Google Scholar]
- Evans, A. S., Solomon, P. M., Tacconi, L. J., Vavilkin, T., & Downes, D. 2006, AJ, 132, 2398 [NASA ADS] [CrossRef] [Google Scholar]
- Faucher-Giguère, C.-A., & Quataert, E. 2012, MNRAS, 425, 605 [NASA ADS] [CrossRef] [Google Scholar]
- Feruglio, C., Maiolino, R., Piconcelli, E., et al. 2010, A&A, 518, L155 [NASA ADS] [CrossRef] [EDP Sciences] [Google Scholar]
- Feruglio, C., Fiore, F., Piconcelli, E., et al. 2013a, A&A, 558, A87 [NASA ADS] [CrossRef] [EDP Sciences] [Google Scholar]
- Feruglio, C., Fiore, F., Maiolino, R., et al. 2013b, A&A, 549, A51 [NASA ADS] [CrossRef] [EDP Sciences] [Google Scholar]
- Feruglio, C., Fiore, F., Carniani, S., et al. 2015, A&A, 583, A99 [NASA ADS] [CrossRef] [EDP Sciences] [Google Scholar]
- Feruglio, C., Ferrara, A., Bischetti, M., et al. 2017, A&A, 608, A30 [NASA ADS] [CrossRef] [EDP Sciences] [Google Scholar]
- Fiore, F., Feruglio, C., Shankar, F., et al. 2017, A&A, 601, A143 [NASA ADS] [CrossRef] [EDP Sciences] [Google Scholar]
- Fluetsch, A., Maiolino, R., Carniani, S., et al. 2019, MNRAS, 483, 4586 [NASA ADS] [Google Scholar]
- García-Burillo, S., Combes, F., Usero, A., et al. 2014, A&A, 567, A125 [NASA ADS] [CrossRef] [EDP Sciences] [Google Scholar]
- Gaspari, M., & Sdowski, A. 2017, ApJ, 837, 149 [NASA ADS] [CrossRef] [Google Scholar]
- Hamann, F., Chartas, G., Reeves, J., & Nardini, E. 2018, MNRAS, 476, 943 [NASA ADS] [CrossRef] [Google Scholar]
- Herrera-Camus, R., Tacconi, L., Genzel, R., et al. 2019, ApJ, 871, 37 [NASA ADS] [CrossRef] [Google Scholar]
- Ishibashi, W., & Fabian, A. C. 2014, MNRAS, 441, 1474 [NASA ADS] [CrossRef] [Google Scholar]
- Ishibashi, W., Fabian, A. C., & Maiolino, R. 2018, MNRAS, 476, 512 [NASA ADS] [Google Scholar]
- Kennicutt, Jr., R. C. 1998, ApJ, 498, 541 [NASA ADS] [CrossRef] [Google Scholar]
- King, A., & Pounds, K. 2015, ARA&A, 53, 115 [Google Scholar]
- Longinotti, A. L., Krongold, Y., Guainazzi, M., et al. 2015, ApJ, 813, L39 [NASA ADS] [CrossRef] [EDP Sciences] [Google Scholar]
- Longinotti, A. L., Vega, O., Krongold, Y., et al. 2018, ApJ, 867, L11 [NASA ADS] [CrossRef] [Google Scholar]
- Luminari, A., Piconcelli, E., Tombesi, F., et al. 2018, A&A, 619, A149 [NASA ADS] [CrossRef] [EDP Sciences] [Google Scholar]
- Maiolino, R., Gallerani, S., Neri, R., et al. 2012, MNRAS, 425, L66 [NASA ADS] [CrossRef] [Google Scholar]
- McMullin, J. P., Waters, B., Schiebel, D., Young, W., & Golap, K. 2007, in Astronomical Data Analysis Software and Systems XVI, eds. R. A. Shaw, F. Hill, & D. J. Bell, ASP Conf. Ser., 376, 127 [Google Scholar]
- Menci, N., Fiore, F., Feruglio, C., et al. 2019, ApJ, 877, 74 [NASA ADS] [CrossRef] [Google Scholar]
- Moser, L., Krips, M., Busch, G., et al. 2016, A&A, 587, A137 [NASA ADS] [CrossRef] [EDP Sciences] [Google Scholar]
- Nardini, E., & Zubovas, K. 2018, MNRAS, 478, 2274 [Google Scholar]
- Nardini, E., Reeves, J. N., Gofford, J., et al. 2015, Science, 347, 860 [Google Scholar]
- Pereira-Santaella, M., Colina, L., García-Burillo, S., et al. 2018, A&A, 616, A171 [NASA ADS] [CrossRef] [EDP Sciences] [Google Scholar]
- Querejeta, M., Schinnerer, E., García-Burillo, S., et al. 2017, A&A, 599, C1 [CrossRef] [EDP Sciences] [Google Scholar]
- Reeves, J. N., O’Brien, P. T., & Ward, M. J. 2003, ApJ, 593, L65 [NASA ADS] [CrossRef] [Google Scholar]
- Reeves, J. N., Braito, V., Nardini, E., et al. 2016, ApJ, 824, 20 [NASA ADS] [CrossRef] [Google Scholar]
- Rupke, D. S. N., & Veilleux, S. 2013, ApJ, 768, 75 [NASA ADS] [CrossRef] [Google Scholar]
- Rupke, D. S., Veilleux, S., & Sanders, D. B. 2005, ApJS, 160, 115 [NASA ADS] [CrossRef] [Google Scholar]
- Rupke, D. S. N., Gültekin, K., & Veilleux, S. 2017, ApJ, 850, 40 [Google Scholar]
- Sakamoto, K., Aalto, S., Evans, A. S., Wiedner, M. C., & Wilner, D. J. 2010, ApJ, 725, L228 [NASA ADS] [CrossRef] [Google Scholar]
- Saturni, F. G., Bischetti, M., Piconcelli, E., et al. 2018, A&A, 617, A118 [NASA ADS] [CrossRef] [EDP Sciences] [Google Scholar]
- Sijacki, D., Springel, V., Di Matteo, T., & Hernquist, L. 2007, MNRAS, 380, 877 [NASA ADS] [CrossRef] [Google Scholar]
- Simpson, C., Ward, M., O’Brien, P., & Reeves, J. 1999, MNRAS, 303, L23 [NASA ADS] [CrossRef] [Google Scholar]
- Solomon, P. M., Downes, D., Radford, S. J. E., & Barrett, J. W. 1997, ApJ, 478, 144 [NASA ADS] [CrossRef] [Google Scholar]
- Solomon, P. M., & Vanden Bout, P. A. 2005, ARA&A, 43, 677 [NASA ADS] [CrossRef] [Google Scholar]
- Tacconi, L. J., Neri, R., Genzel, R., et al. 2013, ApJ, 768, 74 [Google Scholar]
- Thompson, T. A., Fabian, A. C., Quataert, E., & Murray, N. 2015, MNRAS, 449, 147 [NASA ADS] [CrossRef] [Google Scholar]
- Tombesi, F., Cappi, M., Reeves, J. N., & Braito, V. 2012, MNRAS, 422, L1 [NASA ADS] [CrossRef] [Google Scholar]
- Tombesi, F., Meléndez, M., Veilleux, S., et al. 2015, Nature, 519, 436 [Google Scholar]
- Torres, C. A. O., Quast, G. R., Coziol, R., et al. 1997, ApJ, 488, L19 [NASA ADS] [CrossRef] [Google Scholar]
- Valiante, R., Schneider, R., Salvadori, S., & Gallerani, S. 2014, MNRAS, 444, 2442 [NASA ADS] [CrossRef] [Google Scholar]
- Vayner, A., Wright, S. A., Murray, N., et al. 2017, ApJ, 851, 126 [NASA ADS] [CrossRef] [Google Scholar]
- Veilleux, S., Bolatto, A., Tombesi, F., et al. 2017, ApJ, 843, 18 [Google Scholar]
- Voit, G. M., Donahue, M., O’Shea, B. W., et al. 2015, ApJ, 803, L21 [NASA ADS] [CrossRef] [Google Scholar]
- Wang, R., Wagg, J., Carilli, C. L., et al. 2013, ApJ, 773, 44 [NASA ADS] [CrossRef] [Google Scholar]
- Xia, X. Y., Gao, Y., Hao, C.-N., et al. 2012, ApJ, 750, 92 [NASA ADS] [CrossRef] [Google Scholar]
- Yun, M. S., Reddy, N. A., Scoville, N. Z., et al. 2004, ApJ, 601, 723 [NASA ADS] [CrossRef] [Google Scholar]
- Zschaechner, L. K., Walter, F., Bolatto, A., et al. 2016, ApJ, 832, 142 [NASA ADS] [CrossRef] [Google Scholar]
- Zubovas, K., & King, A. 2012, ApJ, 745, L34 [Google Scholar]
All Tables
All Figures
|
Fig. 1. Panel a: map of the continuum-subtracted, CO(3−2) emission of PDS 456 integrated over a line width of 320 km s−1. Black contours indicate the [−3,−2, 2, 3, 2n]σ significance levels (n ≥ 2 and σ = 0.013 Jy beam−1 km s−1) of the CO(3−2) emission. Blue contours indicate the (rest-frame) ∼340 GHz continuum [−3,−2, 2, 3, 2n]σ levels (with σ = 9.6 μJy beam−1). The ALMA synthetic beam is indicated by the grey ellipse. Panel b: map of the line and continuum emitters detected in the ALMA field of view at ≳5σ. |
| In the text | |
|
Fig. 2. Continuum-subtracted spectrum of the CO(3−2) emission line in PDS 456, extracted from a circular region of 1 arcsec radius. Panel a: integrated flux density as a function of velocity, corresponding to a circular region of 1 arcsec radius centred on the QSO position. The channel width is 30 km s−1. Panel b: zoomed-in view of the high-velocity wings in the CO(3−2) line profile. |
| In the text | |
|
Fig. 3. Panel a: velocity-integrated map of the blue-shifted (v < −250 km s−1) CO(3−2) emission obtained by integrating the emission detected at > 3σ in each 30 km s−1 spectral channel, for at least four contiguous channels (i.e. over a velocity range of ≥120 km s−1). White contours show the systemic CO(3−2) emission (same as Fig. 1a). Panel b: CO(3−2) spectra of the extended outflowing clumps A and B shown in panel a, together with their best-fit multi-Gaussian components model. The spectrum extracted at the position of clump A (top panel), located at ∼1.8 kpc from the QSO, shows CO(3−2) emission centred at v ∼ 0 (systemic emission from the QSO, green curve) plus two components with blue-shifted velocities of v ∼ −300 and ∼ − 700 km s−1. The spectrum extracted at the position of clump B (bottom panel) shows no contamination from the CO(3−2) systemic emission, while blue-shifted emission is detected at v ∼ −400 km s−1. |
| In the text | |
|
Fig. 4. Panel a: velocity map of the CO(3−2) emission detected at ≳5σ in the host galaxy of PDS 456, resolved with ∼12 ALMA beams (indicated by the grey ellipse). The main kinematic axis is indicated by the black line. Panel b: velocity dispersion map, characterised by values of σ ≲ 80 km s−1. |
| In the text | |
|
Fig. 5. Panel a: position-velocity diagram, extracted from a 0.3 arcsec slit centred on the QSO location along the major kinematic axis (see Fig. 4a) corresponding to a PA of 165 deg (measured anti-clockwise from north). Black contours refer to the [2, 3, 4, …2n]σ significance level of the CO(3−2) emission, with σ = 0.083 mJy beam−1 and n > 2. The contours associated with the best-fit 3DBAROLO model of the kinematics are also shown by the blue contours. Panels b and c: zoom-in of the velocity range v ∈ [ − 500, +600] km s−1 with increased angular resolution (0.16 × 0.19 arcsec2), extracted along and perpendicular to the major kinematic axis, respectively. Contours are as in the top panel, with σ = 0.16 mJy beam−1. |
| In the text | |
|
Fig. 6. CO(3−2) spectrum of the central 1 × 1 arcsec2 region centred on PDS 456. Data are shown in grey together with the total best-fit model resulting from the pixel-by-pixel decomposition in the v ∈ [ − 500, +600] km s−1 range, obtained by adding the best-fit models of each pixel. Yellow and green histograms indicate the two rotation components used to model the CO(3−2) core, while the emission from H13CN at v ∼ +390 km s−1 is shown in purple. The red histogram represents the best-fit of the low-velocity outflow component. The red shaded area represents the emission, remaining after the subtraction of rotation and H13CN emission, which we consider to be associated with the outflow, and indicates the presence of a blue-shifted, high-velocity (v ∼ −800 km s−1) outflow component. |
| In the text | |
|
Fig. 7. Intensity (a), velocity (b), and velocity dispersion (c) maps of the central, low-velocity outflow component resulting from the pixel-by-pixel decomposition of the CO(3−2) spectrum in the velocity range v ∈ [ − 500, +600] km s−1 (red histogram in Fig. 6). The ALMA beam is shown by the grey ellipse, while the black cross indicates the QSO position. |
| In the text | |
|
Fig. 8. Panel a: mass outflow rate as a function of LBol for PDS 456 (red star) and a compilation of AGNs with outflow detection from Fiore et al. (2017), Fluetsch et al. (2019), Zschaechner et al. (2016), Feruglio et al. (2017), Querejeta et al. (2017), Vayner et al. (2017), Veilleux et al. (2017), Brusa et al. (2018), Longinotti et al. (2018), Herrera-Camus et al. (2019). The blue(green) dashed line shows the best-fit parabolic function for the molecular(ionised) phase, while the shaded area indicates the rms scatter of the data from the relation. Panel b: ratio μ = Ṁion/Ṁmol (black solid curve) inferred from the best-fit relations in panel a, as a function of LBol. The shaded area represents the uncertainty on μ, given the scatter of these relations. Data points indicate the position in the μ − LBol plane of the AGNs with available molecular and ionised mass outflow rates (Vayner et al. 2017; Brusa et al. 2018; Herrera-Camus et al. 2019). We also include the sources with AGN contribution to LBol > 10% from Fluetsch et al. (2019). |
| In the text | |
|
Fig. 9. Ratio between the outflow (molecular or UFO) momentum flux and the radiative momentum flux as a function of the outflow velocity. Star = PDS 456; blue symbols are AGNs with LBol < 1046 erg s−1 (Feruglio et al. 2015; Longinotti et al. 2018); red symbols are AGNs with LBol ∼ 1046 − 1048 (Tombesi et al. 2015; Veilleux et al. 2017; Feruglio et al. 2017, and this work). Filled symbols represent molecular outflows and open symbols show UFOs. The dashed line is the expectation for a momentum-driven outflow. The dot-dashed line represents the prediction for an energy-driven outflow with Ṗmol/Ṗrad = vUFO/v. The solid lines show the expected Ṗmol/Ṗrad for a given luminosity and for different μ(L) = Ṁion/Ṁmol. The red(blue) shaded area shows the uncertainty on Ṗmol/Ṗrad at LBol ∼ 1047(1045) erg s−1, given the rms scatter on Ṁion according to Eq. (2). |
| In the text | |
|
Fig. 10. τof = Eof/ĖUFO as a function of LBol for PDS 456 and a compilation of AGNs as in Fig. 9. Eof is computed under the assumption that the bulk of the outflowing gas mass is in the molecular phase. Blue (red) symbols correspond to AGNs with LBol < 1046 erg s−1 (LBol > 1046 erg s−1). |
| In the text | |
Current usage metrics show cumulative count of Article Views (full-text article views including HTML views, PDF and ePub downloads, according to the available data) and Abstracts Views on Vision4Press platform.
Data correspond to usage on the plateform after 2015. The current usage metrics is available 48-96 hours after online publication and is updated daily on week days.
Initial download of the metrics may take a while.