Fig. 5.
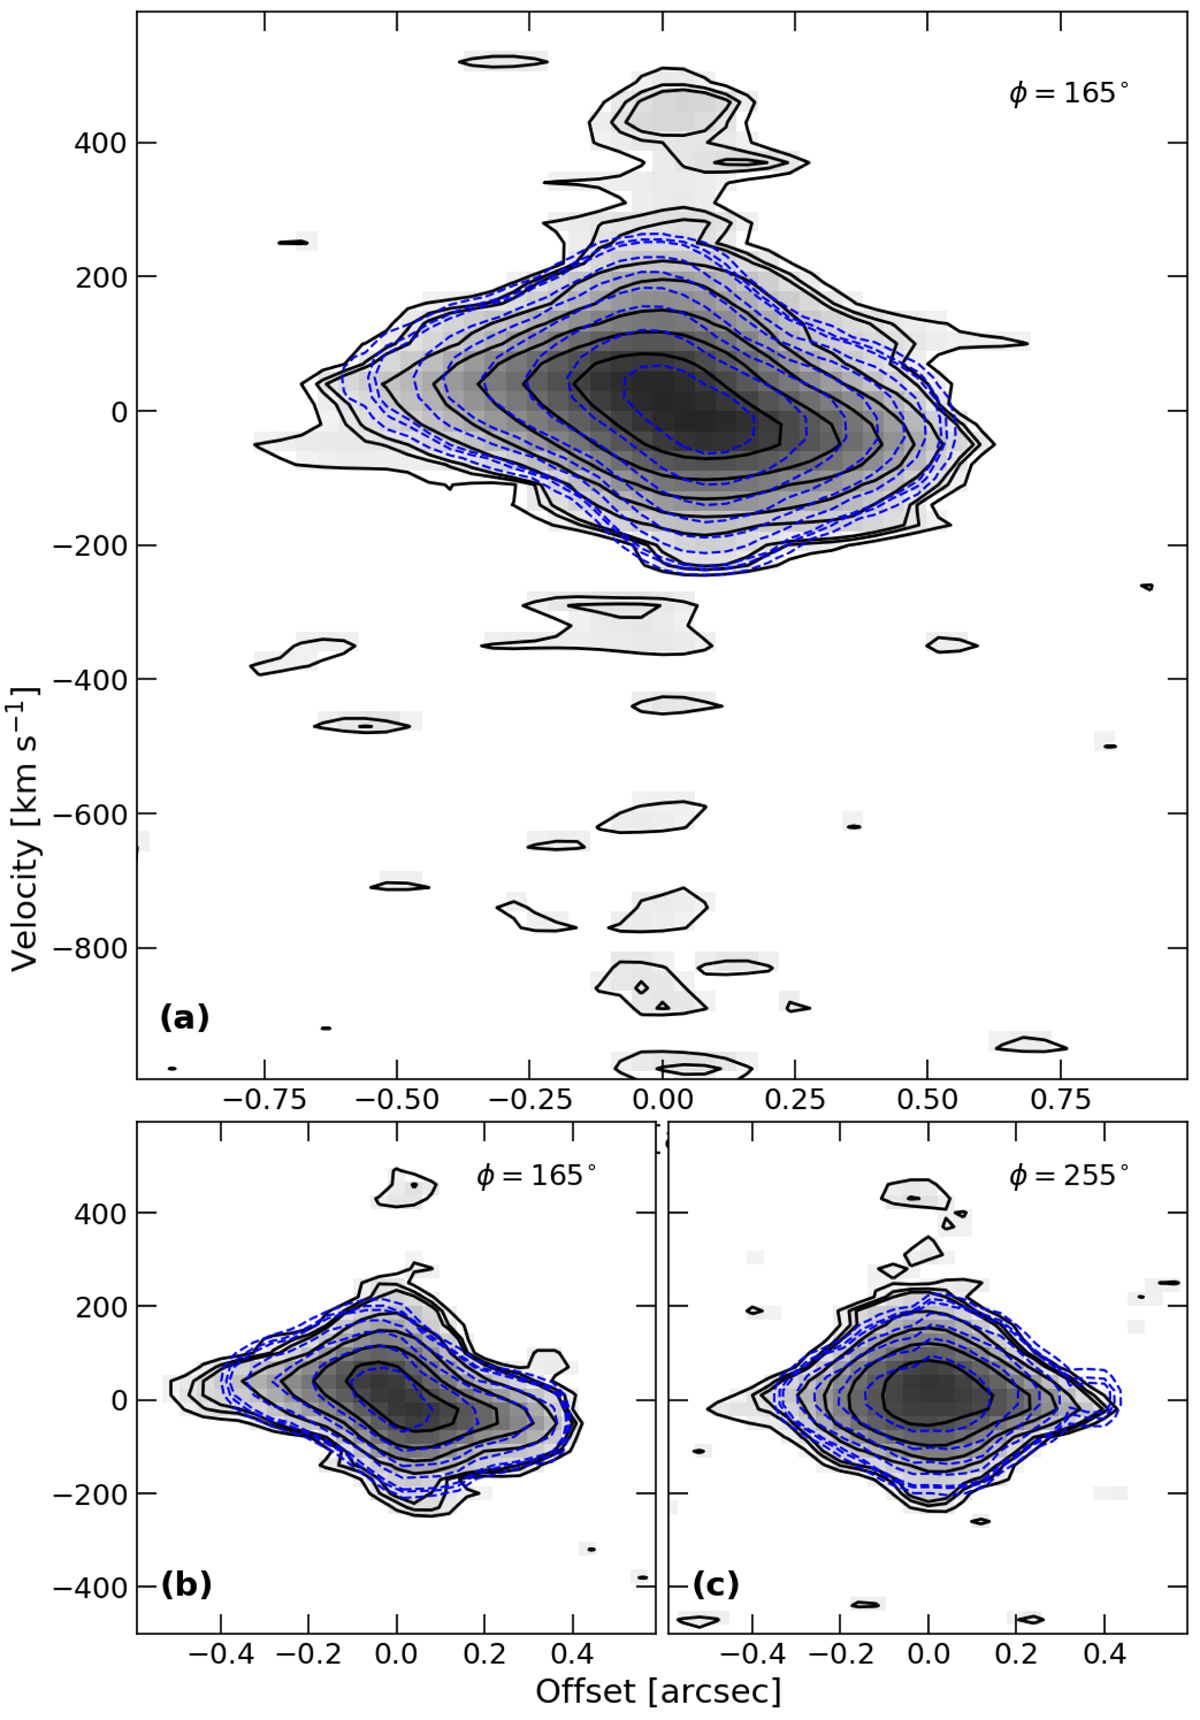
Panel a: position-velocity diagram, extracted from a 0.3 arcsec slit centred on the QSO location along the major kinematic axis (see Fig. 4a) corresponding to a PA of 165 deg (measured anti-clockwise from north). Black contours refer to the [2, 3, 4, …2n]σ significance level of the CO(3−2) emission, with σ = 0.083 mJy beam−1 and n > 2. The contours associated with the best-fit 3DBAROLO model of the kinematics are also shown by the blue contours. Panels b and c: zoom-in of the velocity range v ∈ [ − 500, +600] km s−1 with increased angular resolution (0.16 × 0.19 arcsec2), extracted along and perpendicular to the major kinematic axis, respectively. Contours are as in the top panel, with σ = 0.16 mJy beam−1.
Current usage metrics show cumulative count of Article Views (full-text article views including HTML views, PDF and ePub downloads, according to the available data) and Abstracts Views on Vision4Press platform.
Data correspond to usage on the plateform after 2015. The current usage metrics is available 48-96 hours after online publication and is updated daily on week days.
Initial download of the metrics may take a while.