Fig. 9.
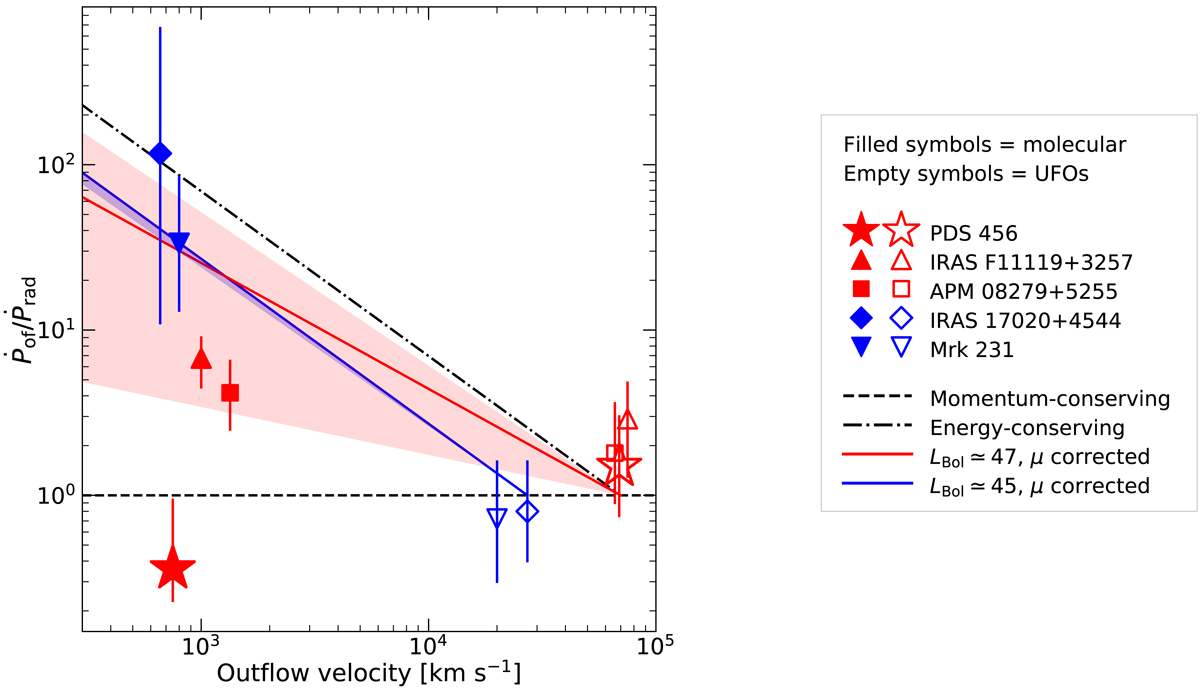
Ratio between the outflow (molecular or UFO) momentum flux and the radiative momentum flux as a function of the outflow velocity. Star = PDS 456; blue symbols are AGNs with LBol < 1046 erg s−1 (Feruglio et al. 2015; Longinotti et al. 2018); red symbols are AGNs with LBol ∼ 1046 − 1048 (Tombesi et al. 2015; Veilleux et al. 2017; Feruglio et al. 2017, and this work). Filled symbols represent molecular outflows and open symbols show UFOs. The dashed line is the expectation for a momentum-driven outflow. The dot-dashed line represents the prediction for an energy-driven outflow with Ṗmol/Ṗrad = vUFO/v. The solid lines show the expected Ṗmol/Ṗrad for a given luminosity and for different μ(L) = Ṁion/Ṁmol. The red(blue) shaded area shows the uncertainty on Ṗmol/Ṗrad at LBol ∼ 1047(1045) erg s−1, given the rms scatter on Ṁion according to Eq. (2).
Current usage metrics show cumulative count of Article Views (full-text article views including HTML views, PDF and ePub downloads, according to the available data) and Abstracts Views on Vision4Press platform.
Data correspond to usage on the plateform after 2015. The current usage metrics is available 48-96 hours after online publication and is updated daily on week days.
Initial download of the metrics may take a while.