Fig. 3.
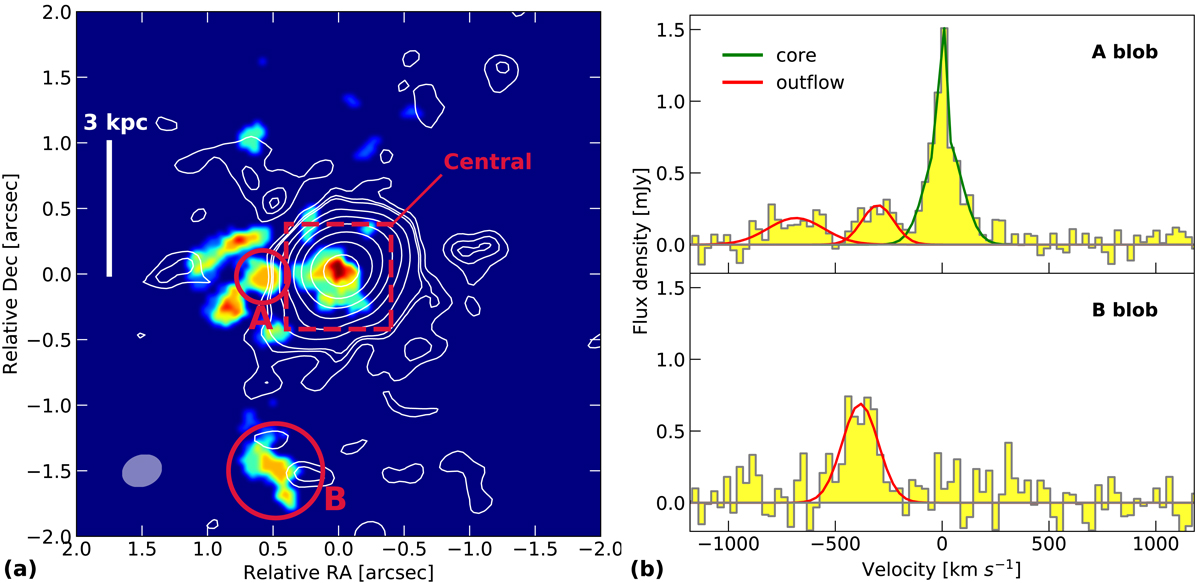
Panel a: velocity-integrated map of the blue-shifted (v < −250 km s−1) CO(3−2) emission obtained by integrating the emission detected at > 3σ in each 30 km s−1 spectral channel, for at least four contiguous channels (i.e. over a velocity range of ≥120 km s−1). White contours show the systemic CO(3−2) emission (same as Fig. 1a). Panel b: CO(3−2) spectra of the extended outflowing clumps A and B shown in panel a, together with their best-fit multi-Gaussian components model. The spectrum extracted at the position of clump A (top panel), located at ∼1.8 kpc from the QSO, shows CO(3−2) emission centred at v ∼ 0 (systemic emission from the QSO, green curve) plus two components with blue-shifted velocities of v ∼ −300 and ∼ − 700 km s−1. The spectrum extracted at the position of clump B (bottom panel) shows no contamination from the CO(3−2) systemic emission, while blue-shifted emission is detected at v ∼ −400 km s−1.
Current usage metrics show cumulative count of Article Views (full-text article views including HTML views, PDF and ePub downloads, according to the available data) and Abstracts Views on Vision4Press platform.
Data correspond to usage on the plateform after 2015. The current usage metrics is available 48-96 hours after online publication and is updated daily on week days.
Initial download of the metrics may take a while.