Fig. 8.
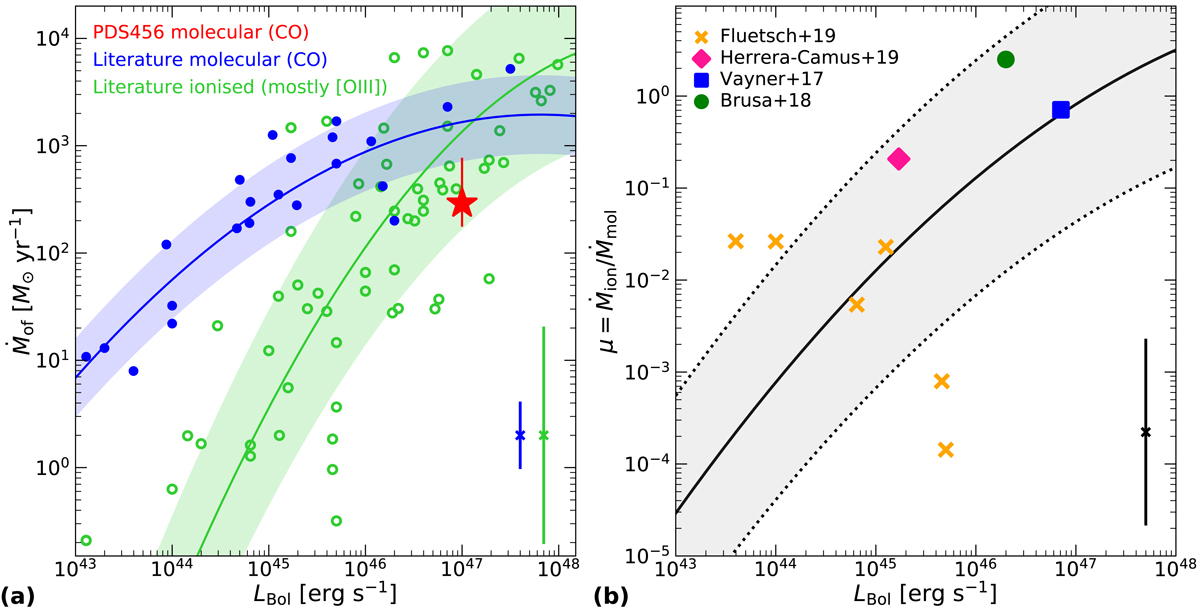
Panel a: mass outflow rate as a function of LBol for PDS 456 (red star) and a compilation of AGNs with outflow detection from Fiore et al. (2017), Fluetsch et al. (2019), Zschaechner et al. (2016), Feruglio et al. (2017), Querejeta et al. (2017), Vayner et al. (2017), Veilleux et al. (2017), Brusa et al. (2018), Longinotti et al. (2018), Herrera-Camus et al. (2019). The blue(green) dashed line shows the best-fit parabolic function for the molecular(ionised) phase, while the shaded area indicates the rms scatter of the data from the relation. Panel b: ratio μ = Ṁion/Ṁmol (black solid curve) inferred from the best-fit relations in panel a, as a function of LBol. The shaded area represents the uncertainty on μ, given the scatter of these relations. Data points indicate the position in the μ − LBol plane of the AGNs with available molecular and ionised mass outflow rates (Vayner et al. 2017; Brusa et al. 2018; Herrera-Camus et al. 2019). We also include the sources with AGN contribution to LBol > 10% from Fluetsch et al. (2019).
Current usage metrics show cumulative count of Article Views (full-text article views including HTML views, PDF and ePub downloads, according to the available data) and Abstracts Views on Vision4Press platform.
Data correspond to usage on the plateform after 2015. The current usage metrics is available 48-96 hours after online publication and is updated daily on week days.
Initial download of the metrics may take a while.