Fig. 6.
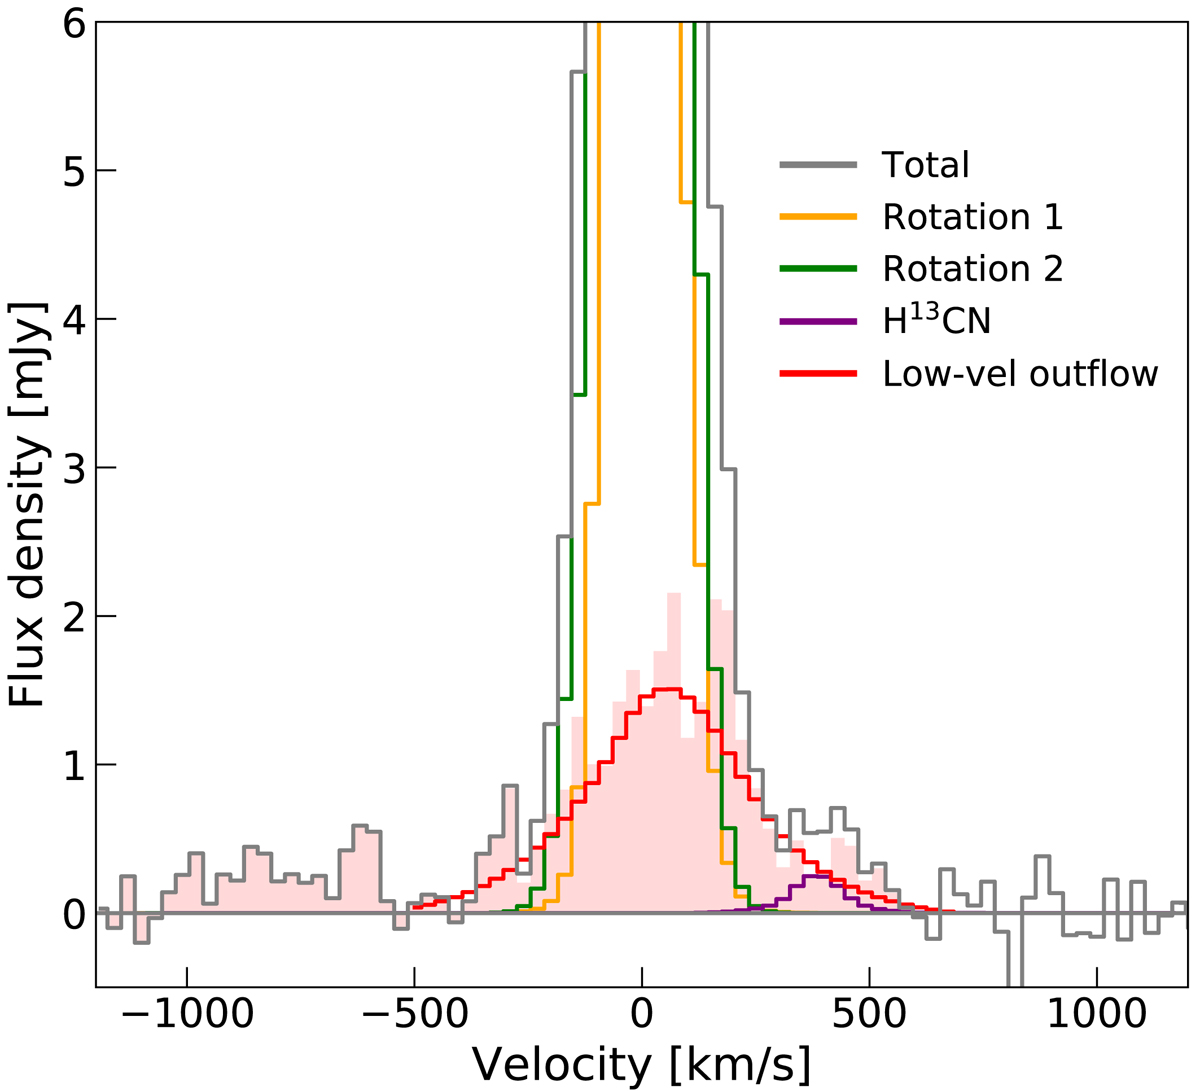
CO(3−2) spectrum of the central 1 × 1 arcsec2 region centred on PDS 456. Data are shown in grey together with the total best-fit model resulting from the pixel-by-pixel decomposition in the v ∈ [ − 500, +600] km s−1 range, obtained by adding the best-fit models of each pixel. Yellow and green histograms indicate the two rotation components used to model the CO(3−2) core, while the emission from H13CN at v ∼ +390 km s−1 is shown in purple. The red histogram represents the best-fit of the low-velocity outflow component. The red shaded area represents the emission, remaining after the subtraction of rotation and H13CN emission, which we consider to be associated with the outflow, and indicates the presence of a blue-shifted, high-velocity (v ∼ −800 km s−1) outflow component.
Current usage metrics show cumulative count of Article Views (full-text article views including HTML views, PDF and ePub downloads, according to the available data) and Abstracts Views on Vision4Press platform.
Data correspond to usage on the plateform after 2015. The current usage metrics is available 48-96 hours after online publication and is updated daily on week days.
Initial download of the metrics may take a while.