Fig. 1.
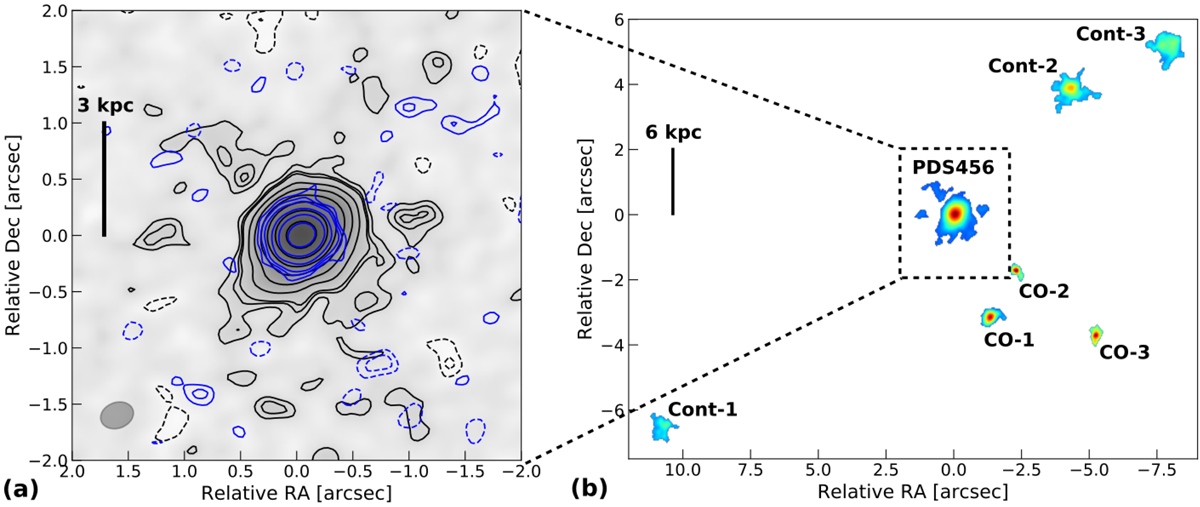
Panel a: map of the continuum-subtracted, CO(3−2) emission of PDS 456 integrated over a line width of 320 km s−1. Black contours indicate the [−3,−2, 2, 3, 2n]σ significance levels (n ≥ 2 and σ = 0.013 Jy beam−1 km s−1) of the CO(3−2) emission. Blue contours indicate the (rest-frame) ∼340 GHz continuum [−3,−2, 2, 3, 2n]σ levels (with σ = 9.6 μJy beam−1). The ALMA synthetic beam is indicated by the grey ellipse. Panel b: map of the line and continuum emitters detected in the ALMA field of view at ≳5σ.
Current usage metrics show cumulative count of Article Views (full-text article views including HTML views, PDF and ePub downloads, according to the available data) and Abstracts Views on Vision4Press platform.
Data correspond to usage on the plateform after 2015. The current usage metrics is available 48-96 hours after online publication and is updated daily on week days.
Initial download of the metrics may take a while.