| Issue |
A&A
Volume 627, July 2019
|
|
|---|---|---|
| Article Number | A44 | |
| Number of page(s) | 11 | |
| Section | Planets and planetary systems | |
| DOI | https://doi.org/10.1051/0004-6361/201935494 | |
| Published online | 27 June 2019 | |
Constraints on HD 113337 fundamental parameters and planetary system
Combining long-base visible interferometry, disc imaging, and high-contrast imaging★
1
LESIA, Observatoire de Paris, Université PSL, CNRS, Sorbonne Université, Université Paris Diderot, Sorbonne Paris Cité,
5 place Jules Janssen,
92195
Meudon,
France
e-mail: This email address is being protected from spambots. You need JavaScript enabled to view it.
2
Université Grenoble Alpes, IPAG, CNRS,
38000
Grenoble,
France
3
Steward Observatory, University of Arizona,
933 N Cherry Ave,
Tucson,
AZ
85721,
USA
4
Max Planck Institute for Astronomy,
Koenigstuhl 17,
69117
Heidelberg,
Germany
5
Jet Propulsion Laboratory, California Institute of Technology,
Pasadena,
CA,
USA
6
Space sciences, Technologies & Astrophysics Research (STAR) Institute, University of Liège,
Liège,
Belgium
7
Université Côte d’Azur, OCA, CNRS, Lagrange, Parc Valrose,
Bât. Fizeau,
06108
Nice cedex 02,
France
8
Steward Observatory, University of Arizona,
933 N Cherry Ave,
Tucson,
AZ
85721,
USA
Received:
19
March
2019
Accepted:
25
May
2019
Abstract
Context. HD 113337 is a main-sequence F6V field star more massive than the Sun. This star hosts one confirmed giant planet and possibly a second candidate, detected by radial velocities (RVs). The star also hosts a cold debris disc detected through the presence of an infrared excess, making it an interesting system to explore.
Aims. We aim to bring new constraints on the star’s fundamental parameters, debris disc properties, and planetary companion(s) by combining complementary techniques.
Methods. We used the VEGA interferometer on the CHARA array to measure the angular diameter of HD 113337. We derived its linear radius using the parallax from the Gaia Second Data Release. We computed the bolometric flux to derive its effective temperature and luminosity, and we estimated its mass and age using evolutionary tracks. Then, we used Herschel images to partially resolve the outer debris disc and estimate its extension and inclination. Next, we acquired high-contrast images of HD 113337 with the LBTI to probe the ~10–80 au separation range. Finally, we combined the deduced contrast maps with previous RVs of the star using the MESS2 software to bring upper mass limits on possible companions at all separations up to 80 au. We took advantage of the constraints on the age and inclination brought by fundamental parameter analysis and disc imaging, respectively, for this analysis.
Results. We derive a limb-darkened angular diameter of 0.386 ± 0.009 mas that converts into a linear radius of 1.50 ± 0.04 R⊙ for HD 113337. The fundamental parameter analysis leads to an effective temperature of 6774 ± 125 K and to two possible age solutions: one young within 14–21 Myr and one old within 0.8–1.7 Gyr. We partially resolve the known outer debris disc and model its emission. Our best solution corresponds to a radius of 85 ± 20 au, an extension of 30 ± 20 au, and an inclination within 10–30° for the outer disc. The combination of imaging contrast limits, published RV, and age and inclination solutions allows us to derive a first possible estimation of the true masses of the planetary companions: ~7−2+4 MJup for HD 113337 b (confirmed companion) and ~16−3+10 MJup for HD 113337 c (candidate companion). We also constrain possible additional companions at larger separations.
Key words: techniques: interferometric / techniques: high angular resolution / stars: individual: HD 113337 / planetary systems / stars: fundamental parameters
Partly based on observations made with the VEGA/CHARA spectro-interferometer.
© S. Borgniet et al. 2019
 Open Access article, published by EDP Sciences, under the terms of the Creative Commons Attribution License (http://creativecommons.org/licenses/by/4.0), which permits unrestricted use, distribution, and reproduction in any medium, provided the original work is properly cited.
1 Introduction
Thousands of exoplanets have been discovered for more than 20 yr, exhibiting a wide diversity of properties such as mass, separation and eccentricity. Each planet detection method allows for estimating only some of these parameters. Most of the planetary companions known so far have been detected indirectly, either with the transit or the radial velocity (RV) method. For both techniques, the main derived parameter (i.e. the planet radius from transits and the planet minimal mass from RV) depends directly on the values of the star parameters (i.e. the stellar radius and mass, respectively). Hence a better precision on these stellar parameters leads to better estimations of the planetary parameters (Ligi et al. 2012; Stassun et al. 2017; White et al. 2018). In the case of transiting companions, the combined use of the stellar mass and radius even allows for determining the true companion mass and thus, its density and expected composition (Ligi et al. 2016; Crida et al. 2018).
In the case of RV planetary systems, another major uncertainty lies in the inclination (i) between theorbital plane and the observer line of sight. Indeed, RVs alone only provide the minimal mass (mp sini) of the companion and not its true mass, which is essential to infer the true nature of the companion. While astrometric measurements of the primary star used in combination with RV can help to derive the true companion mass for the most massive companions,i.e. brown dwarfs (BDs; see e.g. Sahlmann et al. 2011; Bouchy et al. 2016), it is also possible to estimate the system inclination by looking at other proxies. Deriving the inclination of the rotation axis of the star or the inclination of a resolved debris disc are two such possibilities, if we assume that they all rotate in the same plane (i.e. the orbital plane).
Estimating precisely the main stellar fundamental parameters, i.e. the stellar mass (M⋆), stellar radius (R⋆), and stellar age is far from straightforward. Most estimates of these parameters are based on the use of evolutionary models with constraints brought by various observations. A direct and accurate way to obtain stellar radii is to use long-baseline interferometry to directly measure the stellar angular diameter, which allows us to reach an unbiased precision of ~3% on R⋆ (see e.g. Ligi et al. 2012, 2016; Boyajian et al. 2015). When combined to the stellar bolometric flux and the parallax, such a measurement of the stellar radius allows us to derive new (and potentially unbiased) estimations of the stellar luminosity (L⋆) and effective temperature(Teff). Then, once placed on a Hertzprung-Russell diagram, the mass and age can be determined through the use of stellar evolutionary models and the interpolation of isochrones. A good knowledge of the stellar age is essential in the case of directly imaged substellar companions because the companion mass is determined through the use of mass-luminosity model. Hence, understanding the true nature and the formation processes of such imaged companions strongly depends on a good estimation of the age of the primary star; the giant planet (GP) orbiting around β Pictoris (Bonnefoy et al. 2014a) or the companion to GJ504 (D’Orazi et al. 2017; Bonnefoy et al. 2018) are well-known cases, for example.
A key challenge to develop the theory of planetary formation and evolution processes is to understand the respective influence of the different stellar characteristics (e.g. the stellar mass, metallicity and effective temperature) on these processes. While stellar metallicity is well known to be positively correlated to the GP frequency (Fischer & Valenti 2005), a correlation between the stellar mass and the GP frequency or mass has yet to be fully investigated for stars more massive than the Sun (see e.g. Borgniet et al. 2017, and references therein). Interactions between giant planets and debris discs are another key topic to investigate in the context of planetary evolution.
In this work, we present a case study of a system of high interest. HD 113337 is a main-sequence star more massive than the Sun that hosts one (possibly two) RV-detected giant planet(s) (Borgniet et al. 2019, hereafter BO19+) and an unresolved debris disc. We use multi-technique observations to better understand and constrain the properties of the primary star (through optical interferometry), to resolve the debris disc, and to explore the outer environment of the system (through deep imaging). This paper is structured as follows: in Sect. 2, we present the HD 113337 system, looking at the star, debris disc, and planetary system. Second, we review in Sect. 3 the different observations that we made and the data reduction processes that we used. We present and discuss our results in Sect. 4. We specifically show how the combination of these different techniques allow us to better understand and constrain the HD 113337 system.
2 HD 113337 system
2.1 Star
HD 113337 is a main-sequence F6V-type star located at a distance d = 36.2 ± 0.2 pc from the Sun (based on the parallax given by the Gaia second Data Release or DR2; Gaia Collaboration 2016, 2018, and see details in Sect. 4.1). The mass of this star is consistently estimated to be ~1.4 M⊙ in the literature, based on spectroscopic (Allende Prieto & Lambert 1999, hereafter AP99+) or photometric analyses (Geneva-Copenhagen Survey, hereafter GCS III+; Casagrande et al. 2011). Its estimated effective temperature ranges from 6670 ± 80 K based on the photometry (GCS III+) to 6760 ± 160 K based on the spectroscopy (AP99+). The fit of the spectral energy distribution (SED) by Rhee et al. (2007) gives Teff = 7200 K and provides a stellar radius estimation of 1.5 ± 0.15 R⊙. As it is a field dwarf star, the age of HD 113337 is the most difficult stellar parameter to estimate. The typical isochronal age derived from the photometric Teff is  Gyr (GCS III+). It is in agreement with the age of
  Gyr derived by David & Hillenbrand (2015) from Strömgren photometry. We conducted two different analyses to derive independently an age estimation of HD 113337 in Borgniet et al. (2014). Briefly, we first estimated the age of the bound distant (projected separation of ~120 au or ~4400 au) M-type companion 2M1301+6337 to be
  Myr. Second, we measured the lithium abundance of HD 113337 and estimated the corresponding age to be > 160 Myr, leaving our analysis inconclusive (for more details, see Borgniet et al. 2014, and references therein). Finally, activity- and rotation-related age diagnostics, such as the relations derived by Mamajek & Hillenbrand (2008), do not apply to such an early spectral type.
2.2 Debris disc
HD 113337 exhibits a clear infrared (IR) excess from ~20 μm up to 1200 μm with a LIR∕LBOL = 10−4 fractional luminosity. Based on data from the InfraRed Astronomical Satellite (IRAS), Rhee et al. (2007) estimated the dust temperature to be ~100 K and radius to be 18 au. Using Spitzer data that provide a better coverage on the SED of the disc, Moór et al. (2011) concluded that the disc has a dust temperature of ~53 K, suggesting a disc radius of 55 ± 3 au. A more recent study by Chen et al. (2014) found that HD 113337 SED was best fitted by a two-belt model, with a first, warm (316 ± 10 K) dust ring located at 1.7 au from the star and a second, cold (54 ± 5 K) dust ring at 179 au. The system was observed with the James Clerk Maxwell Telescope (JCMT) for the SCUBA-2 Observations of Nearby Stars (SONS) survey at both 450 and 850 μm by Holland et al. (2017), who reported upper limits of <75 mJy (5σ) and <3.6 mJy (3σ), respectively.
2.3 Planetary system
From 2006 to 2016, a RV survey of 125 northern AF-type dwarf stars (including HD 113337) was carried out with the SOPHIE spectrograph at Observatoire de Haute-Provence (France). The aim was to search for GPs and BDs around main-sequence stars more massive than the Sun. Clear periodic variations of HD 113337 RVs were detected and attributed to the presence of a ~3 MJup GP orbiting around the star with a ~320-day period (~1 au, Borgniet et al. 2014). After monitoring the system with SOPHIE for three additional years, HD 113337 RVs were found to exhibit a second periodicity on a longer timescale. The possible sources for this RV long-term variability were investigated and it was concluded that a possible origin was the presence of a second GP with a mp sini ~ 7 MJup minimal mass on a wider orbit (~5 au, see BO19+).
The combined presence of a debris disc, giant planet(s) and ill-constrained age makes HD 113337 an object of high interest.
HD 113337 VEGA observation and reduction log.
3 Observations and data processing
3.1 Optical interferometry of HD 113337
The Center for High Angular Resolution Astronomy array (hereafter CHARA; ten Brummelaar et al. 2005) is the main optical and near-infrared interferometric array in the northern hemisphere. It hosts six 1 m telescopes arranged by pairs in a Y shape and orientated to the west (W1 and W2), east (E1 and E2), and south (S1 and S2), allowing a wide range of baseline orientations. The corresponding baselines range from ~30 to ~330 m (i.e. a maximal angular resolution of 0.2–0.3 mas in the visible). The Visible SpEctroGraph and polArimeter (hereafter VEGA; Mourard et al. 2009) is one of the instruments operating in the visible at the focus of the CHARA array. The VEGA instrument is a spectro-interferometer which allows us to combine the light coming from two to four telescopes simultaneously, at different spectral resolutions (R = 6000 and 30 000).
We observed HD 113337 with two different telescope triplets (E1E2W2 and E1E2W1) chosen to (partially) resolve its small expected angular diameter (~0.4 mas given its ~27 mas parallax and the 1.5 R⊙ radius from Rhee et al. 2007). For each observation point, we tried to follow a calibrator-target-calibrator sequence (C-S-C; see Table 1) with either 30 or 40 blocks of 2500 short (10 ms) exposures per star to ensure an instrumental transfer function that is stable enough to calibrate correctly the target squared visibilities (V2). While it is not necessarily mandatory, observing the calibrator (C) star twice (e.g. before and after the science (S) target) allows us to monitor and take into account possible variations of the transfer function during the observation time (see Mourard et al. 2012, and below). Furthermore and if possible, using two different calibrators with well-defined angular diameters (C1 -S-C2 sequence) instead of one (C-S-C sequence) reinforces the robustness of the target V2 computation by reducing its dependency to the calibrator diameter value and uncertainty. We used the SearchCal software (Bonneau et al. 2006) to select adequate calibrators at the different observation epochs. We acquired ten observation points on five different nights from May 2013 to June 2015, using VEGA red spectral channel in the ~700 to ~750 nm range. We computed the V2 values in either two or three 20-nm-wide spectral bands (depending on the observing conditions) with the standard VEGA reduction pipeline vegadrs (Mourard et al. 2012). Because of the small angular diameters of both our target and calibrators, we had to discard a significant part of the data that revealed themselves not to be robust enough. We first discarded three entire observation points (UT 06:37 on 2013-05-25, UT 04:59 on 2014-07-07, and UT 07:32 on 2015-06-01), for which either the calibrated target V2 computation process did not converge or the signal-to-noise ratio (S/N) on the V2 values was very low (≃0). It also happens that we were not able to obtain measurements on the second calibrator for these three observation points (C-S sequence), which may have hindered the estimation of the transfer function at the time of the observations. Second, we also discarded V2 measurements with S∕N <4 (Mourard et al. 2012), while ensuring that this did not bias our results (as done by Perraut et al. 2013). The details of our observations(after selection) are given in Table 1.
The JMMC Stellar Diameter Catalog (JSDC), which provides the calibrator angular diameters, has recently been updated (Bourges et al. 2017), and has a significant increase (by 6–12% here) in the diameters of early-type calibrators ( ) and diameter uncertainties (
 ) that are smaller by ~50%. We chose to use the
  values fromthe more recent JSDC2 while conservatively keeping the
  values from the JSDC1 (Table 1). The
  change from JSDC1 to JSDC2 translates into an average increase of ~7% on our V2 values lower than 0.6 (2013-05-25 data) and no significant change on our V2 values above 0.6. We fitted the visibility measurements with the JMMC fitting engine LITpro (Tallon-Bosc et al. 2008) based on a modified Levenberg-Marquardt algorithm1, and derived a uniform-disc (UD) angular diameter θUD = 0.371 ± 0.009 mas. We show the best model of the visibility function derived with LITpro in Fig. 1. If we use the
  values from the JSDC1 instead, we obtain θUD = 0.364 ± 0.009 mas (i.e. less than a 2% difference). Furthermore, using the smaller
  values from JSDC2 would lead to a θUD uncertainty of 0.007 mas instead of 0.009 mas. Our θUD robustness is due to the strong constraints brought on our model by the five measurements made with the E2W1 intermediate baseline on 2013-05-25 (our best data, see Fig. 1).
We used the linear limb-darkening coefficients in the R band provided byClaret & Bloemen (2011) to derive the corresponding limb-darkened angular diameter θLD. For a solar metallicity and a null microturbulent velocity, we computed the limb-darkened diameters for Teff in the 6500–7000 K range, and log g in the 4–4.5 range. These coefficients vary at the third decimal level within the considered Teff and log g ranges. We thus considered the average limb-darkening coefficient on our parameter space and obtained a limb-darkened angular diameter of θLD = 0.386 ± 0.009 mas (hence a ~2.4% precision).
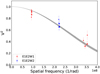 |
Fig. 1 VEGA squared visibilities vs. spatial frequency for HD 113337. The V2 are shown as red or blue circles (depending on the telescope triplet). The solid line and grey zone represent the uniform-disc LITpro best model along with its uncertainty. |
3.2 High-contrast imaging
HD 113337 was observed on January 7, 2015 with the LMIRCam near-infrared camera (Hinz et al. 2008; Skrutskie et al. 2010) at the Large Binocular Telescope Interferometer (LBTI). The LBTI was operated in double-aperture mode. The secondary deformable mirrors were used to record two side-by-side adaptive-optics (AO) images of HD 113337 recorded by LMIRCam at L band (3.68–3.88 μm). The telescope+instrument do not have a derotator. Therefore, it automatically enables the facility for passive angular differential imaging (ADI; Marois et al. 2006). We obtained 597 × 4.95 s and 605 × 4.95 s AO exposures of the target for the right and left eyes of the telescope, respectively. Fewer AO exposures were obtained on the right eye because of open loops. The field orientation changed by 35.1° and 37.2° during that sequence of exposures on the right and left eyes, respectively. The core of the star’s point spread function (PSF) was saturated over a diameter of ~128 mas during the observations to increase the dynamics of the recorded images. We therefore had to acquire non-saturated exposures of the star before and after the sequence of saturated exposures to calibrate the astrometry and photometry using a neutral density (attenuation factor of 9 × 10⁻³).
The data were reduced using the Max Planck Institute for Astronomy (MPIA) ADI pipeline (Bonnefoy et al. 2014b). The pipeline carried out the basic cosmetic steps on the raw frames (de-trending of the raw frames, bad pixel interpolation, sky-background subtraction, and flat-field calibration). The star position was registered in the resulting frames using the mpfit2Dpeak.pro IDL function2, which allowed for a bi-dimensional Moffat function to be fitted onto the PSF wings while masking the saturated core. The parallactic angles were computed at the time of the observations. We applied the locally-optimized combinationof images (LOCI) algorithm (Lafrenière et al. 2007) to evaluate and subtract the stellar halo in the left and right eye data, independently. No point source could be detected following that step (Fig. 2).
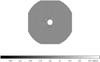 |
Fig. 2 LBTI (left eye) image of HD 113337. North is up and east is left. The size of the image is ~3.2 arcsec. |
3.3 Herschel observations of the cold outer disc
The Herschel data of HD 113337 were obtained using the Photodetector Array Camera and Spectrograph (PACS) instrument (Poglitsch et al. 2010), in the mini scanmap mode with simultaneous observations at 70 and 160 μm under the open time programme OT2_ksu_3 (Fig. 3). The data were obtained on March 3, 2012 with OBSID 1342243344 and 1342243345. Herschel PACS data reduction were performed following the procedure published by Balog et al. (2014) for calibration stars.
We fitted a 2D Gaussian function to estimate the full width at half maximum (FWHM) of the source. At 70 μm, the measured FWHM is 7.′′44 × 7.′′15, ~1.3 times larger than the FWHM of typical point sources (5.′′76 × 5.′′58). The measured FWHM at 160 μm is slightly larger than the typical value for point sources, but less significant. Because the source is marginally resolved at PACS wavelengths, we used aperture sizes of 12″ and 22″ to measure photometry with a sky annulus of 35″– 45″ at 70 and 160 μm, respectively. Including 7% of absolute flux calibration, the final PACS fluxes are 177.1±12.5 mJy and 118.5 ± 9.3 mJy at 70 and 160 μm, respectively. The PACS 70 μm flux agrees very well with the previously published Multiband Imaging Photometer for Spitzer (MIPS) 70 μm photometry (Moór et al. 2011, see below).
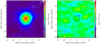 |
Fig. 3 Left: Herschel 70 μm image of the HD 113337 system. The best-fit disc can be described as a Gaussian ring peaked at 85 au (solid ellipse) with a width of 30 au (denoted by dashed ellipses), viewed at 25° from face-on. The PACS 70 μm beam is shown as the red ellipse on the bottom left corner. Right: residual image after the subtraction of the best-fit model. |
4 Results
4.1 Determination of the stellar fundamental parameters
Linear radius
We used the Gaia (Gaia Collaboration 2016) DR2 parallax πP = 27.61 ± 0.04 mas (Gaia Collaboration 2018). According to the Gaia documentation, the published DR2 parallax uncertainties may be underestimated by a factor of ~10% for bright stars such as HD 113337 (G ≃ 5.9 mag). Furthermore, there are potential systematic errors on the DR2 parallaxes such as a global zero-point offset (Lindegren et al. 2018). We used the formula given by Lindegren et al. (2018) for bright stars to recompute the error on HD 113337 DR2 parallax: i.e. we quadratically summed thepublished parallax uncertainty scaled by a factor 1.08 with an additional uncertainty of 0.021 mas. We thus obtained πP = 27.61 ± 0.05 mas. The corresponding distance is 36.2 ± 0.2 pc, i.e. in good agreement with the HD 113337 distance of 36.18 ± 0.06 pc derived by Bailer-Jones et al. (2018) based on a Bayesian analysis of Gaia DR2 parallaxes.
We used our limb-darkened angular diameter θLD in combinationwith the above Gaia parallax to derive the stellar radius and its error through a Monte Carlo simulation
 (1)
(1)
We obtained R⋆ = 1.50 ± 0.04 R⊙ (precision better than 2.7%).
Bolometric flux
We collected spectroscopic and photometric data to compute the bolometric flux fbol. We determined HD 113337 SED, and then computed the area under the curve of that distribution (Fig. 4). The flux distribution of HD 113337 was determined by concatenating several flux distributions:
-
For the ultraviolet region, the rebinned spectrum from the Sky Survey Telescope obtained by the International Ultraviolet Explorer (IUE) Newly Extracted Spectra (INES) data archive3. Based on the quality flag listed in the IUE spectra (Garhart et al. 1997), we removed all bad pixels from the data as well as measurements with negative flux.
-
For the visible and red regions, the STELIB spectrum (Le Borgne et al. 2003).
-
In the near-infrared range, the J, H, and K 2MASS magnitudes. We used the formula in Cohen et al. (2003) to convert 2MASS magnitudes in fluxes.
At the shortest wavelengths, we performed a linear interpolation on logarithmic scale between 912 and 1842 Å, considering zero flux at 912 Å. At the longest wavelengths, we performed a linear interpolation on logarithmic scale using the 2MASS magnitudes and assuming zero flux at 1.6 × 10⁶ Å. We estimated the uncertainty associated with the bolometric flux by considering the following conservative uncertainties, i.e. 3% uncertainty on the flux computed from the STELIB spectrum, 10% on the flux computed from the combined IUE spectra, and 15% on the flux derived from interpolations. Finally, we obtained a bolometric flux fbol = 1.05 ± 0.06 × 10⁻⁷ erg cm−2 s−1.
Luminosity and effective temperature
From the parallax and the bolometric flux we derived the luminosity through a Monte Carlo method
 (2)
(2)
where C is the conversion from parsecs to cm (3.086 × 10¹⁸), and πp the parallax in arcseconds. We found L⋆ = 4.29 ± 0.25 L⊙, where the error bar is dominated by that of the bolometric flux.
We finally derived the effective temperature Teff from θLD and fbol through a Monte Carlo method
 (3)
(3)
where σ stands for the Stefan-Boltzmann constant (5.67 × 10⁻⁵ erg cm−2 s−1 K−4). We determined Teff = 6774 ± 125 K.
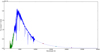 |
Fig. 4 Bolometric flux computation: INES spectrum (green), STELIB spectrum (blue), 2MASS magnitudes (circles), and interpolations (dash lines). |
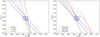 |
Fig. 5 Position of HD 113337 in the Hertzprung-Russell diagram. Left plot: old solution; right plot: young solution. On both plots, the blue dot and blue box represent the [ log (Teff), log (L⋆ ∕L⊙)] values and 1σ uncertainties (respectively) deduced from our analysis. The blue solid straight lines represent the constraints (1σ uncertainties) on R⋆. On both plots, evolutionary tracks for Z in the range 0.0169–0.0185 are shown for three cases: best age solution (solid orange curves), lower age limit (dotted red curves), andupper age limit (dashed green curves). |
Position in the Hertzsprung-Russell diagram
From the determined fundamental parameters, we set our target in the Hertzsprung-Russell diagram. We used the isochrone tool CMD 2.74 to derive the mass and age of HD 113337. We considered a metallicity [M/H] = 0.07 ± 0.02 based on different spectroscopic analyses (Boesgaard & Tripicco 1986; Soubiran et al. 2016), thus Z spanning from 0.0169 to 0.0185, and Y spanning from 0.279 to 0.282. We obtained two solutions in agreement with our 1σ error box: a young solution corresponding to an age of  Myr and a mass of 1.48 ± 0.08 M⊙, and an old solution corresponding to an age of 1.25 ± 0.45 Gyr and a mass of
  (Fig. 5). The fundamental parameters (R⋆, Teff) that we derived are generally in close agreement with previous determinations (Table 2). Regarding the stellar age and mass, finding such a degeneracy between a young and an old solution appears to be a typical result when carrying out this approach (see e.g. Ligi et al. 2016; Bonnefoy et al. 2018). The mass and age from our old solution agree with the mass and age ranges determined by Casagrande et al. (2011) and AP99+. However, our two age solutions for the adopted metallicity range do not fit the age of 150
 Myr that we adopted in Borgniet et al. (2014). Waiving the age degeneracy of HD 113337 remains problematic so far as we know. Even combining our interferometric radius with a technique such as asteroseismology (Creevey et al. 2007) to derive the stellar mass would prove fruitless because the two mass values corresponding to our two age solutions are already consistent together. There are hints that the rate of debris discs detected through the presence of an IR excess decreases with the stellar age (Montesinos et al. 2016), yet this does not allow us to rule out the old age solution in the specific case of HD 113337.
4.2 Outer disc geometry
We adopted a simple approach to estimate the disc extent at 70 μm (Fig. 3, left panel) by assuming that the disc emission can be described by an axisymmetric model, like a Gaussian ring defined by the peak (Rp) and width (FWHM) of the ring (Rw). The disc has a total flux, Ftot, at 70 μm, and its midplane is assumed to be inclined by an angle of i from face-on (i.e. i = 0°), with the major axis along a position angle (PA). We generated a series of high-resolution model images and convolved them with the observed PSF derived from the calibration stars. We then determined the best-fit parameters (five free parameters) by comparing the convolved model images with the observation using a χ2 statistic. The best-fit parameters are Rp = 85 ± 20 au, Rw = 30 ± 20 au,  , PA = 128° ± 5°, and Ftot = 175 ± 12 mJy. The right panel of Fig. 3 shows the image residuals, which are all within ±1σ after the subtraction of the best-fit model.
To make sure that the best-fit disc parameters are consistent with the observed SED, we computed the model SED using the derived geometric parameters (i.e. Rp and Rw). Since the disc geometric parameters are derived using the PACS 70 μm data, we only try to reproduce the SED longward of 70 μm. Assuming the disc is optically and geometrically thin and has a surface density distribution best described by the derived Gaussian ring, we are able to reproduce the bulk part of the SED using icy silicate grains (the icy grain model from Su et al. 2015, for the HD 95086 system). The grain size distribution is assumed to be a power law form, ~ a−3.5, where a is the grain radius with a minimum amin and maximum amax cut-offs. We found that amin of ~2 μm and amax of 1 mm can fit the far-IR SED well (Fig. 6). The minimum grain size (2 μm) is roughly the radiation blowout size assuming a bulk density of 1.7 g cm−3, a typical minimum grain size in a collisional cascade debris discs. A total dust mass for this cold disc is 7.3 × 10⁻³MEarth (up to 1 mm grains). We note that the model cold-disc SED does not fit the MIPS 24 μm and IRS data, which might be related to the warm component reported by Chen et al. (2014). To explore this possibility, we tried to fit the mid-IR part of the SED with a simple blackbody function and found that a blackbody emission with a temperature of 80 K represents the mid-IR SED well (Fig. 6). The 80 K emission is too cold compared to the warm component derived by Chen et al. (2014). It might be an intermediate separate component in the disc structure, which would not be the first time that a complex disc structure is inferred (e.g. ϵ Eri, Su et al. 2017). Alternatively, this mid-IR emission can also arise from a small amount of dragged-in grains from the cold disc under the influence of Poynting-Robertson (P-R) drag (e.g. van Lieshout et al. 2014). Since our Herschel data do not have enough resolution to resolve the inner edge of the cold disc spatially, both scenarios are possible.
Fundamental parameters of HD 113337.
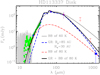 |
Fig. 6 Spectral energy distribution (SED) of the debris around HD 113337, composed of broadband photometry and mid-infraredspectrum after the removal of the stellar photosphere. The blue diamonds are the Spitzer MIPS photometry from Moór et al. (2011), the green dots (with uncertainties shown in grey area) are the Spitzer IRS spectrum from Chen et al. (2014), and the purple diamonds are the Herschel PACS fluxes from this study. Also plotted are the JCMT SCUBA2 upper limits (Holland et al. 2017) and IRAM MAMBO2 1.2 mm from Moór et al. (2011). The mid- and far-IR broadband photometry can be described by a simple blackbody emission of 60 K (thin grey line); however, it is slightly too high compared to the IRS spectrum. The Gaussian ring (GR) SED is shown as the blue dashed line. The disc SED from ~20 μm to 1.2 mm is best described by the combination of a cold GR plus a 80 K blackbody emission (see text for details). |
4.3 Constraints on actual and possible companions
Known planetary system
We recomputed the minimal masses of the planetary companion HD 113337 b and candidate c, using the new Gaia parallax, the new M⋆ values from our fundamental parameter analysis, and our orbital analysis from BO19+. For HD 113337 b we obtain mp sini = 3.1 ± 0.2 MJup, and for thecandidate companion HD 113337 c we obtain mp sini = 7.2 ± 0.5 MJup (without significant differences between the two stellar mass solutions). Understandably, the mp sini do not change significantly with respect to the values we derived in BO19+ (i.e. 3 ± 0.3 MJup and 6.9 ± 0.6 MJup for HD 113337 b and c, respectively) owing to the little difference in the adopted stellar mass and parallax values.
HD 113337 b and candidate c orbit too close to the primary to be detected or even mass-constrained with an imager such as the LBTI. However, we can use the debris disc inclination value that we derived from the disc modelling (i.e.  ) as a possible starting point. If we assume that the GP(s) and the partially resolved outer disc orbit within the same plane, we can then estimate their true mass(es). Assuming such a system inclination, the true mass of HD 113337 b would then be
  . The true mass of the tentative HD 113337 c would be
 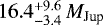 . These true masses would be more than twice the value of the corresponding minimal masses from BO19+, in agreement with the small inclination considered in this work. We emphasize that this hypothesis remains widely speculative at this stage. Yet, if confirmed, this would make HD 113337 GP(s) very massive planetary companions. This would be in agreement with the trend of higher GP masses with increasing stellar masses predicted by the core-accretion theory (Kennedy & Kenyon 2008, 2009).
Combined mass detection probabilities
From the LBTI images, we estimated the flux losses at each separation associated with the ADI process (Bonnefoy et al. 2014a) and derived detection limits (1D) and detection maps (2D) in contrast. We classically converted our detection limits in contrast into masses using the star distance, the Wide-field Infrared Survey Explorer (WISE) W1 magnitude (Cutri et al. 2014) as a proxy of the L’ band star magnitude, and the COND tracks (Baraffe et al. 2003). We considered two respective ages of 20 Myr and 1 Gyr, roughly corresponding to the young and old age solutions derived from our stellar fundamental parameter analysis (Sect. 4.1). We show the derived mass detection limits in Fig. 7. The difference in terms of achieved companion sensitivity between our two age solutions (i.e. roughly one order of magnitude) highlights the importance of an accurate age determination.
We brought additional constraints on the mass of possible additional companions by combining our contrast detection (2D) maps with RVs. For this purpose, we used the Multi-epoch multi-purpose Exoplanet Simulation System (MESS2; Lannier et al. 2017)tool. The MESS2 tool generates populations of synthetic planets with masses and orbital parameters within pre-defined ranges through a Monte Carlo simulation. For each of the synthetic planets, the synthetic RV signal generated at the RV observation epochs, and the simulated planet projected separation at the image’s observation epoch are simultaneously compared to the RV and imaging data, respectively. With respect to so-called classical mass detection limits derived from contrast (as in Fig. 7), the advantage of this approach is twofold: (1) it allows us to explore different hypotheses on the companion orbital properties; and (2) it allows us to assess the companion mass detection probabilities in the combined separation range covered by RV and imaging (i.e. from the close proximity of the star out to the field of view of the imager). The MESS2 tool was successfully applied to famous systems such as AU Mic (Lannier et al. 2017), HD 95086 (Chauvin et al. 2018), β Pictoris (Lagrange et al. 2018), and GJ504 (Bonnefoy et al. 2018).
We applied MESS2 to the HD 113337 SOPHIE RV data set detailed in BO19+ (Sect. 2). We mainly used the RV corrected from the two-planet Keplerian fit performed by BO19+, assuming that HD 113337 c is an actual planetary companion. The RV analysis within MESS2 relies on the periodogram-based local power analysis method (LPA; Meunier et al. 2012). Regarding the LBTI data, we used the contrast 2D maps converted into masses considering the two possible age solutions of 20 Myr and 1 Gyr derived from the evolutionary track analysis (Sect. 4.1). In addition to the two age solutions, we also considered two synthetic planet inclination distributions: first, a uniform distribution between 0° and 90° (i.e. no assumption on i); and second, a narrow inclination range between 10° and 30° (assuming that the synthetic planets orbit within the same plane as the resolved outer disc). Thus, we mainly tested four MESS2 simulations. We show the deduced detection probability curves in Fig. 8.
The SOPHIE RV data set allows us to rule out any additional companion to the known GP(s) with a mass above ~ 5 MJup up to 9 au if considering a system inclination around 25°, and we can rule out another 90% if considering a uniform inclination distribution. We note that we used RV residuals of a two-planet Keplerian fit, explaining this good sensitivity. We overplotted the true masses (or minimal masses) of the known companions on Fig. 8 for the 25° and uniform inclinations, respectively (top and bottom plots). The sudden sensitivity gap at ~8 au is explained by the current impossibility to simulate the RV signal of synthetic planets with orbital periods longer than twice the RV data set time span within MESS2 (Bonnefoy et al. 2018). We are not able to fully bridge the gap between the RV and imaging separation domains in any of the four simulations. Understandably, the detection probabilities provided by the LBTI images are best when considering the young age solution and close to pole-on inclination (top left plot). In this case, ~100% of additional companions above ~10 MJup are excluded between ~25 and ~35 au, and ~90% are excluded between ~15 and ~45 au. Increasing the age to 1 Gyr or assuming no hypothesis on the system inclination significantly reduces our sensitivity to companions within the separation domain covered by the LBTI. Compared to our classical (1D) mass detection limits (Fig. 7), our MESS2 detection probabilities show a decreased companion sensitivity within the separation range covered by the LBTI images. This can be expected as we computed the former 1D detection limits as if assuming the HD 113337 system was seen face-on (i.e. the most favourable case for imaging companions). We emphasize that we used only one epoch of observation regarding the imaging data within our MESS2 analysis. A way to increase the sensitivity to companions within the imaging separation domain is to combine multiple high-contrast images acquired at different epochs (see e.g. Lannier et al. 2017; Lagrange et al. 2018).
We additionally tested the impact of assuming the presence of only one RV-detected GP in the HD 113337 system (HD 113337 b, confirmed planet) on our MESS2 detection probabilities. To do so, we used the SOPHIE RV data corrected from the one-planet Keplerian model corresponding to planet b only, while keeping the longer term RV variability (see more details in BO19+). We performed only one simulation, considering the young age solution and an inclination between 10° and 30°. In this case, the detection probabilities at the shortest separations are significantly degraded (Fig. 9), increasing the gap between the separation ranges covered by RV and direct imaging. This is expected as the computation of the RV detection probabilities within MESS2 is based on the analysis of the RV Lomb-Scargle periodogram (Meunier et al. 2012; Lannier et al. 2017).
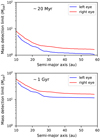 |
Fig. 7 Classical mass detection limits derived from the LBTI images of HD 113337, for the left (blue) and right (red) eyes. Top panel: age of 20 Myr; bottom panel: age of 1 Gyr (see text). |
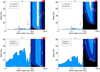 |
Fig. 8 MESS2 detection probabilities of HD 113337. The four plots correspond to our four (age; i) cases (~20 Myr or ~1 Gyr, and i within 10–30° or uniform i distribution, respectively). On each plot, the contour colours (from white to black) correspond to a higher or lower (respectively) detection probability of additional companions, as indicated by the numbers: 1 indicates a detection probability over 99%, 0.9 over 90%, etc. We show the assumed true masses of HD 113337 b and c (full and empty red dots, respectively) on the top plots (inclination assumed to be 25°), and their minimal masses on the bottom plots. On the top of each plot, we indicate the outer debris disc extension resolved in this study with a red band. We also indicate the disc position previously assumed from SED fits from the literature: from Moór et al. (2011; purple triangle), Rhee et al. (2007; yellow triangle), and the inner disc component from Chen et al. (2014; green triangle), respectively. |
5 Conclusions
We combined different techniques to explore and bring constraints on various aspects of the HD 113337 system. New optical long-based interferometric measurements allowed us to measure the linear radius of HD 113337 with a precision better than 3%. By using the new Gaia DR2 parallax and computing the bolometric flux of the star, we were able to derive two very distinct isochronal age solutions for the system. The first (young) solution corresponds to an age of ~14–21 Myr, while the second (old) one corresponds to an age of ~0.8–1.7 Gyr. However, as often with such age degeneracies, we could not definitely settle the question of HD 113337 age. For the first time, we were able to (partially) resolve the HD 113337 outer debris disc and to model its radius, its radial extension and, very interestingly, its inclination. We also found hints of possible inner disc components, which would be in agreement with previous SED studies. Next, we took new high-contrast images of the outer environment of the system with the LBTI imager. We used both the deduced contrast limits and previous RV data to explore the complete GP-type companion (mass, separation) range up to 80–100 au from HD 113337. At the same time, we took advantage of the age solutions and disc inclination value that we found to characterize the corresponding sensitivity to companions. Interestingly, this allowed us to deduce hints of the possible true masses of the HD 113337 b confirmed GP and of the candidate HD 113337 c. Furthermore, we were able to bring the first constraints on the presence of additional undetected companions at larger separations using the MESS2 tool.
While it was not the main topic of this study, an important issue with the HD 113337 system is to determine once and for all if the candidate companion HD 113337 c is a real companion (see BO19+). At this time, we are carrying out an additional long-term RV monitoring of HD 113337 with the SOPHIE spectrograph to increase our RV time span. This could allow us to remove the ambiguity of the RV and spectral line profile long-term signals. Another compelling possibility is to combine our RV data with astrometric data from HIPPARCOS or Gaia. The tentative second GP that might orbit around HD 113337 is an ideal target within this context. Furthermore, the RV + astrometric data combination would bring more constraints on the inclination of the system and might even allow us to confirm if the GP(s) orbit within the same plane as the outer debris disc. If present, and if seen inclined, HD 113337 c would be a very massive planet, most probably formed through core accretion while close at the same time to the commonly considered mass boundary between GP and brown dwarf companions. Finally, the combined RV + imaging analysis that we carried out in this study can be extended by using multi-epoch high-contrast imaging data, which would allow to fully close the gap with the RV sensitivity domain. HD 113337 has already been included in several high-contrast imaging surveys. To conclude, we consider that HD 113337 constitutes an exciting and rich system to explore further. It could make for a useful contribution for both stellar physics (with regard to stellar age determination), GP formation, GP evolution as a function of stellar properties, possibly multi-component debris disc studies, and planetary-disc interactions.
 |
Fig. 9 Comparison of MESS2 detection probabilities when removing a two-planet Keplerian model from the RV (left; assuming the candidate planet HD 113337 c is real) or only a one-planet Keplerian model (right; assuming only the confirmed planet HD 113337 b). This simulation was made in the case of the young age solution and for an inclination within 10–30°. The y-scale is zoomed-in on the 0–5 MJup range if compared to Fig. 8; the left plot corresponds to the same simulation as the top left plot of Fig. 8. |
Acknowledgements
This work is based upon observations obtained with the Georgia State University Center for High Angular Resolution Astronomy Array at Mount Wilson Observatory. The CHARA Array is supported by the National Science Foundation under Grants No. AST-1211929 and AST-1411654. This work was supported by the Programme National de Physique Stellaire (PNPS) of CNRS and INSU co-funded by CEA and CNES. We acknowledge financial support from LabEx OSUG@2020 (Investissements d’avenir – ANR10LABX56). K.Y.L.S. acknowledges the partial support from the NASA grant NNX15AI86G. This work has made use of data from the European Space Agency (ESA) mission Gaia (https://www.cosmos.esa.int/gaia), processed by the Gaia Data Processing and Analysis Consortium (DPAC, https://www.cosmos.esa.int/web/gaia/dpac/consortium). Funding for the DPAC has been provided by national institutions, in particular the institutions participating in the Gaia Multilateral Agreement. This research has made use of the SIMBAD and VIZIER databases5 at the CDS, Strasbourg (France), and of electronic bibliography maintained by the NASA Astrophysics Data System (ADS) system. It has made use of the Jean-Marie Mariotti Center Aspro service6. We would like to thank our anonymous referee for the appreciated comments.
References
- Allende Prieto, C., & Lambert, D. L. 1999, VizieR Online Data Catalog: 335 [Google Scholar]
- Bailer-Jones, C. A. L., Rybizki, J., Fouesneau, M., Mantelet, G., & Andrae, R. 2018, AJ, 156, 58 [NASA ADS] [CrossRef] [Google Scholar]
- Balog, Z., Müller, T., Nielbock, M., et al. 2014, Exp. Astron., 37, 129 [NASA ADS] [CrossRef] [EDP Sciences] [Google Scholar]
- Baraffe, I., Chabrier, G., Barman, T. S., Allard, F., & Hauschildt, P. H. 2003, A&A, 402, 701 [NASA ADS] [CrossRef] [EDP Sciences] [Google Scholar]
- Boesgaard, A. M., & Tripicco, M. J. 1986, ApJ, 303, 724 [NASA ADS] [CrossRef] [Google Scholar]
- Bonneau, D., Clausse, J.-M., Delfosse, X., et al. 2006, A&A, 456, 789 [NASA ADS] [CrossRef] [EDP Sciences] [Google Scholar]
- Bonnefoy, M., Marleau, G.-D., Galicher, R., et al. 2014a, A&A, 567, L9 [NASA ADS] [CrossRef] [EDP Sciences] [Google Scholar]
- Bonnefoy, M., Currie, T., Marleau, G.-D., et al. 2014b, A&A, 562, A111 [NASA ADS] [CrossRef] [EDP Sciences] [Google Scholar]
- Bonnefoy, M., Perraut, K., Lagrange, A.-M., et al. 2018, A&A, 618, A63 [NASA ADS] [CrossRef] [EDP Sciences] [Google Scholar]
- Borgniet, S., Boisse, I., Lagrange, A.-M., et al. 2014, A&A, 561, A65 [NASA ADS] [CrossRef] [EDP Sciences] [Google Scholar]
- Borgniet, S., Lagrange, A.-M., Meunier, N., & Galland, F. 2017, A&A, 599, A57 [NASA ADS] [CrossRef] [EDP Sciences] [Google Scholar]
- Borgniet, S., Lagrange, A.-M., Meunier, N., et al. 2019, A&A, 621, A87 [NASA ADS] [CrossRef] [EDP Sciences] [Google Scholar]
- Bouchy, F., Ségransan, D., Díaz, R. F., et al. 2016, A&A, 585, A46 [NASA ADS] [CrossRef] [EDP Sciences] [Google Scholar]
- Bourges, L., Mella, G., Lafrasse, S., et al. 2017, VizieR Online Data Catalog: II/346 [Google Scholar]
- Boyajian, T., von Braun, K., Feiden, G. A., et al. 2015, MNRAS, 447, 846 [NASA ADS] [CrossRef] [Google Scholar]
- Casagrande, L., Schoenrich, R., Asplund, M., et al. 2011, VizieR Online Data Catalog: 353 [Google Scholar]
- Chauvin, G., Gratton, R., Bonnefoy, M., et al. 2018, A&A, 617, A76 [NASA ADS] [CrossRef] [EDP Sciences] [Google Scholar]
- Chen, C. H., Mittal, T., Kuchner, M., et al. 2014, ApJS, 211, 25 [NASA ADS] [CrossRef] [Google Scholar]
- Claret, A., & Bloemen, S. 2011, VizieR Online Data Catalog: J/A+A/352/075 [Google Scholar]
- Cohen, M., Wheaton, W. A., & Megeath, S. T. 2003, AJ, 126, 1090 [NASA ADS] [CrossRef] [Google Scholar]
- Creevey, O. L., Monteiro, M. J. P. F. G., Metcalfe, T. S., et al. 2007, ApJ, 659, 616 [NASA ADS] [CrossRef] [Google Scholar]
- Crida, A., Ligi, R., Dorn, C., & Lebreton, Y. 2018, ApJ, 860, 122 [NASA ADS] [CrossRef] [Google Scholar]
- Cutri, R. M., Skrutskie, M. F., Stiening, R. R. M., et al. 2014, VizieR Online Data Catalog: II/328 [Google Scholar]
- David, T. J., & Hillenbrand, L. A. 2015, ApJ, 804, 146 [NASA ADS] [CrossRef] [Google Scholar]
- D’Orazi, V., Desidera, S., Gratton, R. G., et al. 2017, A&A, 598, A19 [NASA ADS] [CrossRef] [EDP Sciences] [Google Scholar]
- ESA 1997, The HIPPARCOS and TYCHO catalogues. Astrometric and photometric star catalogues derived from the ESA HIPPARCOS Space Astrometry Mission, ESA SP, 1200 [Google Scholar]
- Fischer, D. A., & Valenti, J. 2005, ApJ, 622, 1102 [NASA ADS] [CrossRef] [Google Scholar]
- Gaia Collaboration (Prusti, T., et al.) 2016, A&A, 595, A1 [NASA ADS] [CrossRef] [EDP Sciences] [Google Scholar]
- Gaia Collaboration (Brown, A. G. A., et al.) 2018, A&A, 616, A1 [NASA ADS] [CrossRef] [EDP Sciences] [Google Scholar]
- Garhart, M. P., Smith, M. A., Turnrose, B. E., Levay, K. L., & Thompson, R. W. 1997, IUE NASA Newsletter, 57, 1 [NASA ADS] [Google Scholar]
- Hinz, P. M., Solheid, E., Durney, O., & Hoffmann, W. F. 2008, Proc. SPIE, 7013, 701339 [CrossRef] [Google Scholar]
- Holland, W. S., Matthews, B. C., Kennedy, G. M., et al. 2017, MNRAS, 470, 3606 [NASA ADS] [CrossRef] [Google Scholar]
- Kennedy, G. M., & Kenyon, S. J. 2008, ApJ, 673, 502 [NASA ADS] [CrossRef] [Google Scholar]
- Kennedy, G. M., & Kenyon, S. J. 2009, ApJ, 695, 1210 [NASA ADS] [CrossRef] [Google Scholar]
- Lafrasse, S., Mella, G., Bonneau, D., et al. 2010, in Optical and Infrared Interferometry II, Proc. SPIE, 7734, 77344E [CrossRef] [Google Scholar]
- Lafrenière, D., Marois, C., Doyon, R., Nadeau, D., & Artigau, É. 2007, ApJ, 660, 770 [NASA ADS] [CrossRef] [Google Scholar]
- Lagrange, A.-M., Keppler, M., Meunier, N., et al. 2018, A&A, 612, A108 [NASA ADS] [CrossRef] [EDP Sciences] [Google Scholar]
- Lannier, J., Lagrange, A. M., Bonavita, M., et al. 2017, A&A, 603, A54 [NASA ADS] [CrossRef] [EDP Sciences] [Google Scholar]
- Le Borgne, J.-F., Bruzual, G., Pelló, R., et al. 2003, A&A, 402, 433 [NASA ADS] [CrossRef] [EDP Sciences] [Google Scholar]
- Ligi, R., Mourard, D., Lagrange, A. M., et al. 2012, A&A, 545, A5 [NASA ADS] [CrossRef] [EDP Sciences] [Google Scholar]
- Ligi, R., Creevey, O., Mourard, D., et al. 2016, A&A, 586, A94 [NASA ADS] [CrossRef] [EDP Sciences] [Google Scholar]
- Lindegren, L., Hernández, J., Bombrun, A., et al. 2018, A&A, 616, A2 [NASA ADS] [CrossRef] [EDP Sciences] [Google Scholar]
- Mamajek, E. E., & Hillenbrand, L. A. 2008, ApJ, 687, 1264 [NASA ADS] [CrossRef] [Google Scholar]
- Marois, C., Lafrenière, D., Doyon, R., Macintosh, B., & Nadeau, D. 2006, ApJ, 641, 556 [Google Scholar]
- Meunier, N., Lagrange, A.-M., & De Bondt, K. 2012, A&A, 545, A87 [NASA ADS] [CrossRef] [EDP Sciences] [Google Scholar]
- Montesinos, B., Eiroa, C., Krivov, A. V., et al. 2016, A&A, 593, A51 [NASA ADS] [CrossRef] [EDP Sciences] [Google Scholar]
- Moór, A., Pascucci, I., Kóspál, Á., et al. 2011, ApJS, 193, 4 [NASA ADS] [CrossRef] [Google Scholar]
- Mourard, D., Clausse, J. M., Marcotto, A., et al. 2009, A&A, 508, 1073 [NASA ADS] [CrossRef] [EDP Sciences] [Google Scholar]
- Mourard, D., Challouf, M., Ligi, R., et al. 2012, Proc. SPIE, 8445, 84450K [CrossRef] [Google Scholar]
- Perraut, K., Borgniet, S., Cunha, M., et al. 2013, A&A, 559, A21 [NASA ADS] [CrossRef] [EDP Sciences] [Google Scholar]
- Poglitsch, A., Waelkens, C., Geis, N., et al. 2010, A&A, 518, L2 [NASA ADS] [CrossRef] [EDP Sciences] [Google Scholar]
- Rhee, J. H., Song, I., Zuckerman, B., & McElwain, M. 2007, ApJ, 660, 1556 [NASA ADS] [CrossRef] [MathSciNet] [Google Scholar]
- Sahlmann, J., Ségransan, D., Queloz, D., et al. 2011, A&A, 525, A95 [NASA ADS] [CrossRef] [EDP Sciences] [Google Scholar]
- Skrutskie, M. F., Jones, T., Hinz, P., et al. 2010, Ground-based and Airborne Instrumentation for Astronomy III, Proc. SPIE, 7735, 77353H [CrossRef] [Google Scholar]
- Soubiran, C., Le Campion, J.-F., Brouillet, N., & Chemin, L. 2016, A&A, 591, A118 [NASA ADS] [CrossRef] [EDP Sciences] [Google Scholar]
- Stassun, K. G., Collins, K. A., & Gaudi, B. S. 2017, AJ, 153, 136 [NASA ADS] [CrossRef] [Google Scholar]
- Su, K. Y. L., Morrison, S., Malhotra, R., et al. 2015, ApJ, 799, 146 [NASA ADS] [CrossRef] [Google Scholar]
- Su, K. Y. L., De Buizer, J. M., Rieke, G. H., et al. 2017, AJ, 153, 226 [NASA ADS] [CrossRef] [Google Scholar]
- Tallon-Bosc, I., Tallon, M., Thiébaut, E., et al. 2008, SPIE Conf. Ser., 7013, 44 [Google Scholar]
- ten Brummelaar, T. A., McAlister, H. A., Ridgway, S. T., et al. 2005, ApJ, 628, 453 [NASA ADS] [CrossRef] [Google Scholar]
- van Leeuwen, F. 2007, A&A, 474, 653 [NASA ADS] [CrossRef] [EDP Sciences] [Google Scholar]
- van Lieshout, R., Dominik, C., Kama, M., & Min, M. 2014, A&A, 571, A51 [NASA ADS] [CrossRef] [EDP Sciences] [Google Scholar]
- White, T. R., Huber, D., Mann, A. W., et al. 2018, MNRAS, 477, 4403 [NASA ADS] [CrossRef] [Google Scholar]
- Zuckerman, B., & Song, I. 2004, ARA&A, 42, 685 [NASA ADS] [CrossRef] [MathSciNet] [Google Scholar]
Available at http://cdsweb.u-strasbg.fr/
Available at http://www.jmmc.fr/aspro
All Tables
All Figures
|
Fig. 1 VEGA squared visibilities vs. spatial frequency for HD 113337. The V2 are shown as red or blue circles (depending on the telescope triplet). The solid line and grey zone represent the uniform-disc LITpro best model along with its uncertainty. |
| In the text | |
|
Fig. 2 LBTI (left eye) image of HD 113337. North is up and east is left. The size of the image is ~3.2 arcsec. |
| In the text | |
|
Fig. 3 Left: Herschel 70 μm image of the HD 113337 system. The best-fit disc can be described as a Gaussian ring peaked at 85 au (solid ellipse) with a width of 30 au (denoted by dashed ellipses), viewed at 25° from face-on. The PACS 70 μm beam is shown as the red ellipse on the bottom left corner. Right: residual image after the subtraction of the best-fit model. |
| In the text | |
|
Fig. 4 Bolometric flux computation: INES spectrum (green), STELIB spectrum (blue), 2MASS magnitudes (circles), and interpolations (dash lines). |
| In the text | |
|
Fig. 5 Position of HD 113337 in the Hertzprung-Russell diagram. Left plot: old solution; right plot: young solution. On both plots, the blue dot and blue box represent the [ log (Teff), log (L⋆ ∕L⊙)] values and 1σ uncertainties (respectively) deduced from our analysis. The blue solid straight lines represent the constraints (1σ uncertainties) on R⋆. On both plots, evolutionary tracks for Z in the range 0.0169–0.0185 are shown for three cases: best age solution (solid orange curves), lower age limit (dotted red curves), andupper age limit (dashed green curves). |
| In the text | |
|
Fig. 6 Spectral energy distribution (SED) of the debris around HD 113337, composed of broadband photometry and mid-infraredspectrum after the removal of the stellar photosphere. The blue diamonds are the Spitzer MIPS photometry from Moór et al. (2011), the green dots (with uncertainties shown in grey area) are the Spitzer IRS spectrum from Chen et al. (2014), and the purple diamonds are the Herschel PACS fluxes from this study. Also plotted are the JCMT SCUBA2 upper limits (Holland et al. 2017) and IRAM MAMBO2 1.2 mm from Moór et al. (2011). The mid- and far-IR broadband photometry can be described by a simple blackbody emission of 60 K (thin grey line); however, it is slightly too high compared to the IRS spectrum. The Gaussian ring (GR) SED is shown as the blue dashed line. The disc SED from ~20 μm to 1.2 mm is best described by the combination of a cold GR plus a 80 K blackbody emission (see text for details). |
| In the text | |
|
Fig. 7 Classical mass detection limits derived from the LBTI images of HD 113337, for the left (blue) and right (red) eyes. Top panel: age of 20 Myr; bottom panel: age of 1 Gyr (see text). |
| In the text | |
|
Fig. 8 MESS2 detection probabilities of HD 113337. The four plots correspond to our four (age; i) cases (~20 Myr or ~1 Gyr, and i within 10–30° or uniform i distribution, respectively). On each plot, the contour colours (from white to black) correspond to a higher or lower (respectively) detection probability of additional companions, as indicated by the numbers: 1 indicates a detection probability over 99%, 0.9 over 90%, etc. We show the assumed true masses of HD 113337 b and c (full and empty red dots, respectively) on the top plots (inclination assumed to be 25°), and their minimal masses on the bottom plots. On the top of each plot, we indicate the outer debris disc extension resolved in this study with a red band. We also indicate the disc position previously assumed from SED fits from the literature: from Moór et al. (2011; purple triangle), Rhee et al. (2007; yellow triangle), and the inner disc component from Chen et al. (2014; green triangle), respectively. |
| In the text | |
|
Fig. 9 Comparison of MESS2 detection probabilities when removing a two-planet Keplerian model from the RV (left; assuming the candidate planet HD 113337 c is real) or only a one-planet Keplerian model (right; assuming only the confirmed planet HD 113337 b). This simulation was made in the case of the young age solution and for an inclination within 10–30°. The y-scale is zoomed-in on the 0–5 MJup range if compared to Fig. 8; the left plot corresponds to the same simulation as the top left plot of Fig. 8. |
| In the text | |
Current usage metrics show cumulative count of Article Views (full-text article views including HTML views, PDF and ePub downloads, according to the available data) and Abstracts Views on Vision4Press platform.
Data correspond to usage on the plateform after 2015. The current usage metrics is available 48-96 hours after online publication and is updated daily on week days.
Initial download of the metrics may take a while.