Fig. 6
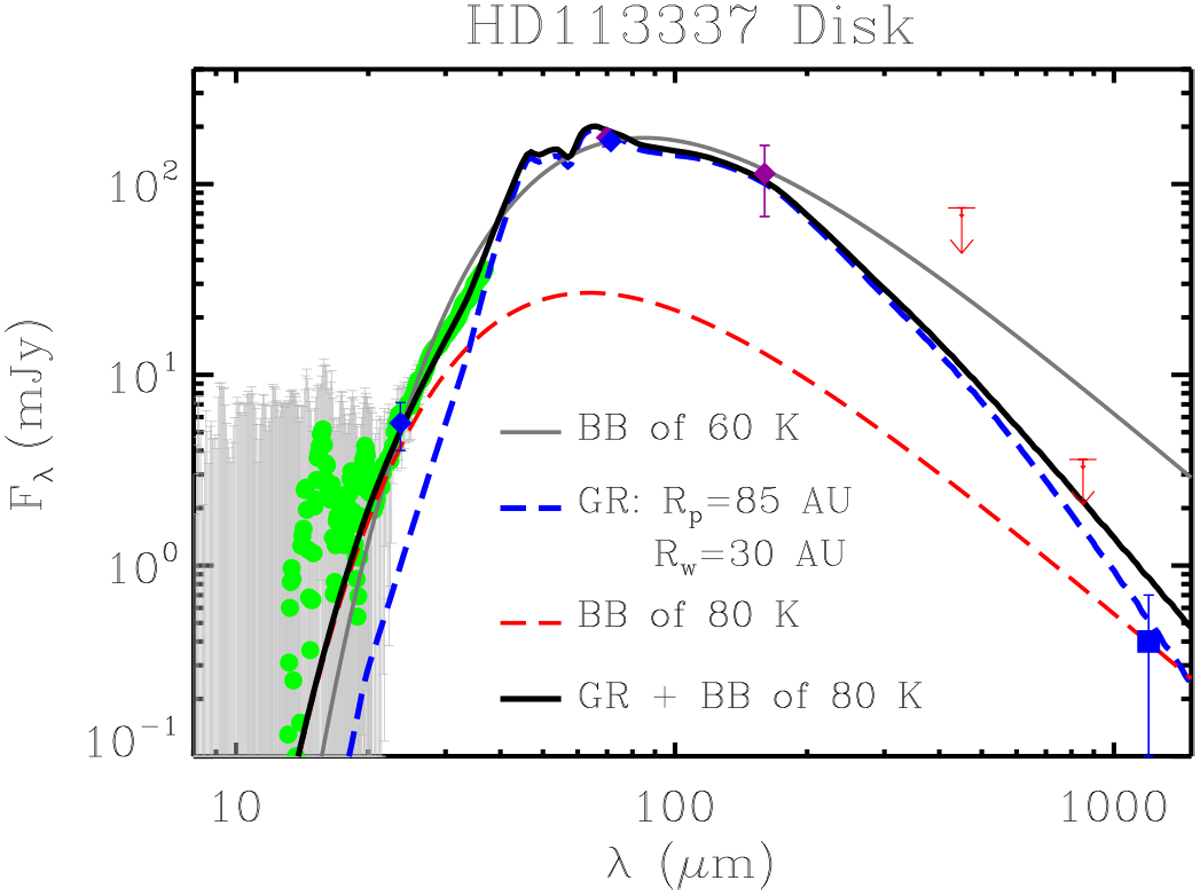
Spectral energy distribution (SED) of the debris around HD 113337, composed of broadband photometry and mid-infraredspectrum after the removal of the stellar photosphere. The blue diamonds are the Spitzer MIPS photometry from Moór et al. (2011), the green dots (with uncertainties shown in grey area) are the Spitzer IRS spectrum from Chen et al. (2014), and the purple diamonds are the Herschel PACS fluxes from this study. Also plotted are the JCMT SCUBA2 upper limits (Holland et al. 2017) and IRAM MAMBO2 1.2 mm from Moór et al. (2011). The mid- and far-IR broadband photometry can be described by a simple blackbody emission of 60 K (thin grey line); however, it is slightly too high compared to the IRS spectrum. The Gaussian ring (GR) SED is shown as the blue dashed line. The disc SED from ~20 μm to 1.2 mm is best described by the combination of a cold GR plus a 80 K blackbody emission (see text for details).
Current usage metrics show cumulative count of Article Views (full-text article views including HTML views, PDF and ePub downloads, according to the available data) and Abstracts Views on Vision4Press platform.
Data correspond to usage on the plateform after 2015. The current usage metrics is available 48-96 hours after online publication and is updated daily on week days.
Initial download of the metrics may take a while.