Fig. 8
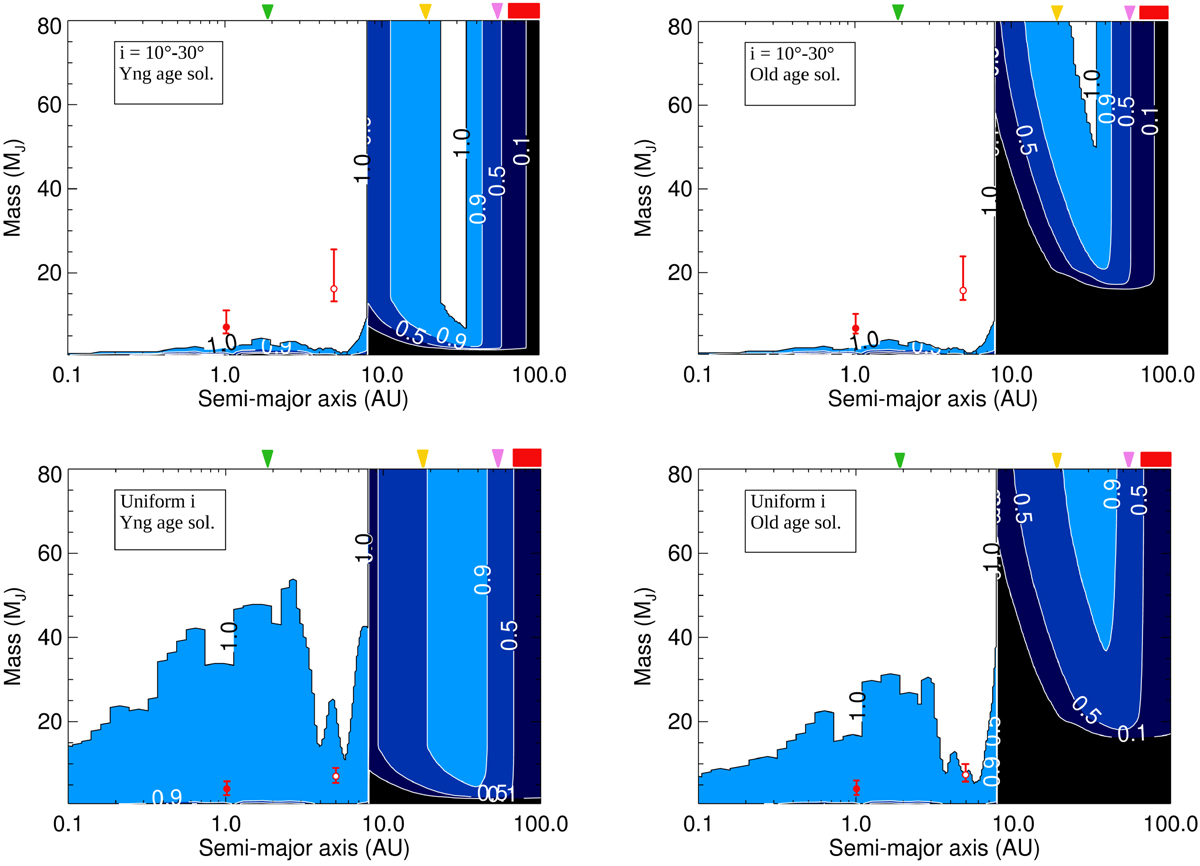
MESS2 detection probabilities of HD 113337. The four plots correspond to our four (age; i) cases (~20 Myr or ~1 Gyr, and i within 10–30° or uniform i distribution, respectively). On each plot, the contour colours (from white to black) correspond to a higher or lower (respectively) detection probability of additional companions, as indicated by the numbers: 1 indicates a detection probability over 99%, 0.9 over 90%, etc. We show the assumed true masses of HD 113337 b and c (full and empty red dots, respectively) on the top plots (inclination assumed to be 25°), and their minimal masses on the bottom plots. On the top of each plot, we indicate the outer debris disc extension resolved in this study with a red band. We also indicate the disc position previously assumed from SED fits from the literature: from Moór et al. (2011; purple triangle), Rhee et al. (2007; yellow triangle), and the inner disc component from Chen et al. (2014; green triangle), respectively.
Current usage metrics show cumulative count of Article Views (full-text article views including HTML views, PDF and ePub downloads, according to the available data) and Abstracts Views on Vision4Press platform.
Data correspond to usage on the plateform after 2015. The current usage metrics is available 48-96 hours after online publication and is updated daily on week days.
Initial download of the metrics may take a while.